
|
|||||
|
 | |
| |
| |
| |
| |
| |
|
Gene: MGLL |
Gene summary for MGLL |
| Gene information | Species | Human | Gene symbol | MGLL | Gene ID | 11343 |
| Gene name | monoglyceride lipase | |
| Gene Alias | HU-K5 | |
| Cytomap | 3q21.3 | |
| Gene Type | protein-coding | GO ID | GO:0001676 | UniProtAcc | Q99685 |
Top |
Malignant transformation analysis |
| Identification of the aberrant gene expression in precancerous and cancerous lesions by comparing the gene expression of stem-like cells in diseased tissues with normal stem cells |
| Entrez ID | Symbol | Replicates | Species | Organ | Tissue | Adj P-value | Log2FC | Malignancy |
| 11343 | MGLL | GSM4909281 | Human | Breast | IDC | 1.42e-09 | -3.02e-01 | 0.21 |
| 11343 | MGLL | GSM4909282 | Human | Breast | IDC | 2.09e-02 | -2.47e-01 | -0.0288 |
| 11343 | MGLL | GSM4909285 | Human | Breast | IDC | 1.32e-08 | -2.98e-01 | 0.21 |
| 11343 | MGLL | GSM4909286 | Human | Breast | IDC | 3.86e-10 | -3.12e-01 | 0.1081 |
| 11343 | MGLL | GSM4909287 | Human | Breast | IDC | 1.05e-08 | -2.83e-01 | 0.2057 |
| 11343 | MGLL | GSM4909291 | Human | Breast | IDC | 4.16e-15 | 7.08e-01 | 0.1753 |
| 11343 | MGLL | GSM4909296 | Human | Breast | IDC | 1.31e-06 | -2.61e-01 | 0.1524 |
| 11343 | MGLL | GSM4909299 | Human | Breast | IDC | 3.68e-08 | -2.94e-01 | 0.035 |
| 11343 | MGLL | GSM4909301 | Human | Breast | IDC | 5.35e-06 | -2.71e-01 | 0.1577 |
| 11343 | MGLL | GSM4909302 | Human | Breast | IDC | 5.70e-07 | -2.59e-01 | 0.1545 |
| 11343 | MGLL | GSM4909304 | Human | Breast | IDC | 1.56e-05 | -2.84e-01 | 0.1636 |
| 11343 | MGLL | GSM4909309 | Human | Breast | IDC | 3.21e-02 | -2.00e-01 | 0.0483 |
| 11343 | MGLL | GSM4909311 | Human | Breast | IDC | 3.69e-12 | -2.81e-01 | 0.1534 |
| 11343 | MGLL | GSM4909315 | Human | Breast | IDC | 6.21e-05 | -2.65e-01 | 0.21 |
| 11343 | MGLL | GSM4909319 | Human | Breast | IDC | 8.28e-11 | -2.71e-01 | 0.1563 |
| 11343 | MGLL | GSM4909320 | Human | Breast | IDC | 1.69e-04 | -3.15e-01 | 0.1575 |
| 11343 | MGLL | GSM4909321 | Human | Breast | IDC | 1.11e-06 | -2.65e-01 | 0.1559 |
| 11343 | MGLL | brca10 | Human | Breast | Precancer | 2.93e-15 | 6.38e-01 | -0.0029 |
| 11343 | MGLL | P1 | Human | Breast | IDC | 1.08e-07 | -1.88e-01 | 0.1527 |
| 11343 | MGLL | P2 | Human | Breast | IDC | 1.16e-05 | -3.04e-01 | 0.21 |
| Page: 1 2 3 4 5 6 7 8 9 |
| Tissue | Expression Dynamics | Abbreviation |
| Breast |  | IDC: Invasive ductal carcinoma |
| DCIS: Ductal carcinoma in situ | ||
| Precancer(BRCA1-mut): Precancerous lesion from BRCA1 mutation carriers | ||
| Colorectum (GSE201348) |  | FAP: Familial adenomatous polyposis |
| CRC: Colorectal cancer | ||
| Colorectum (HTA11) |  | AD: Adenomas |
| SER: Sessile serrated lesions | ||
| MSI-H: Microsatellite-high colorectal cancer | ||
| MSS: Microsatellite stable colorectal cancer | ||
| Esophagus | 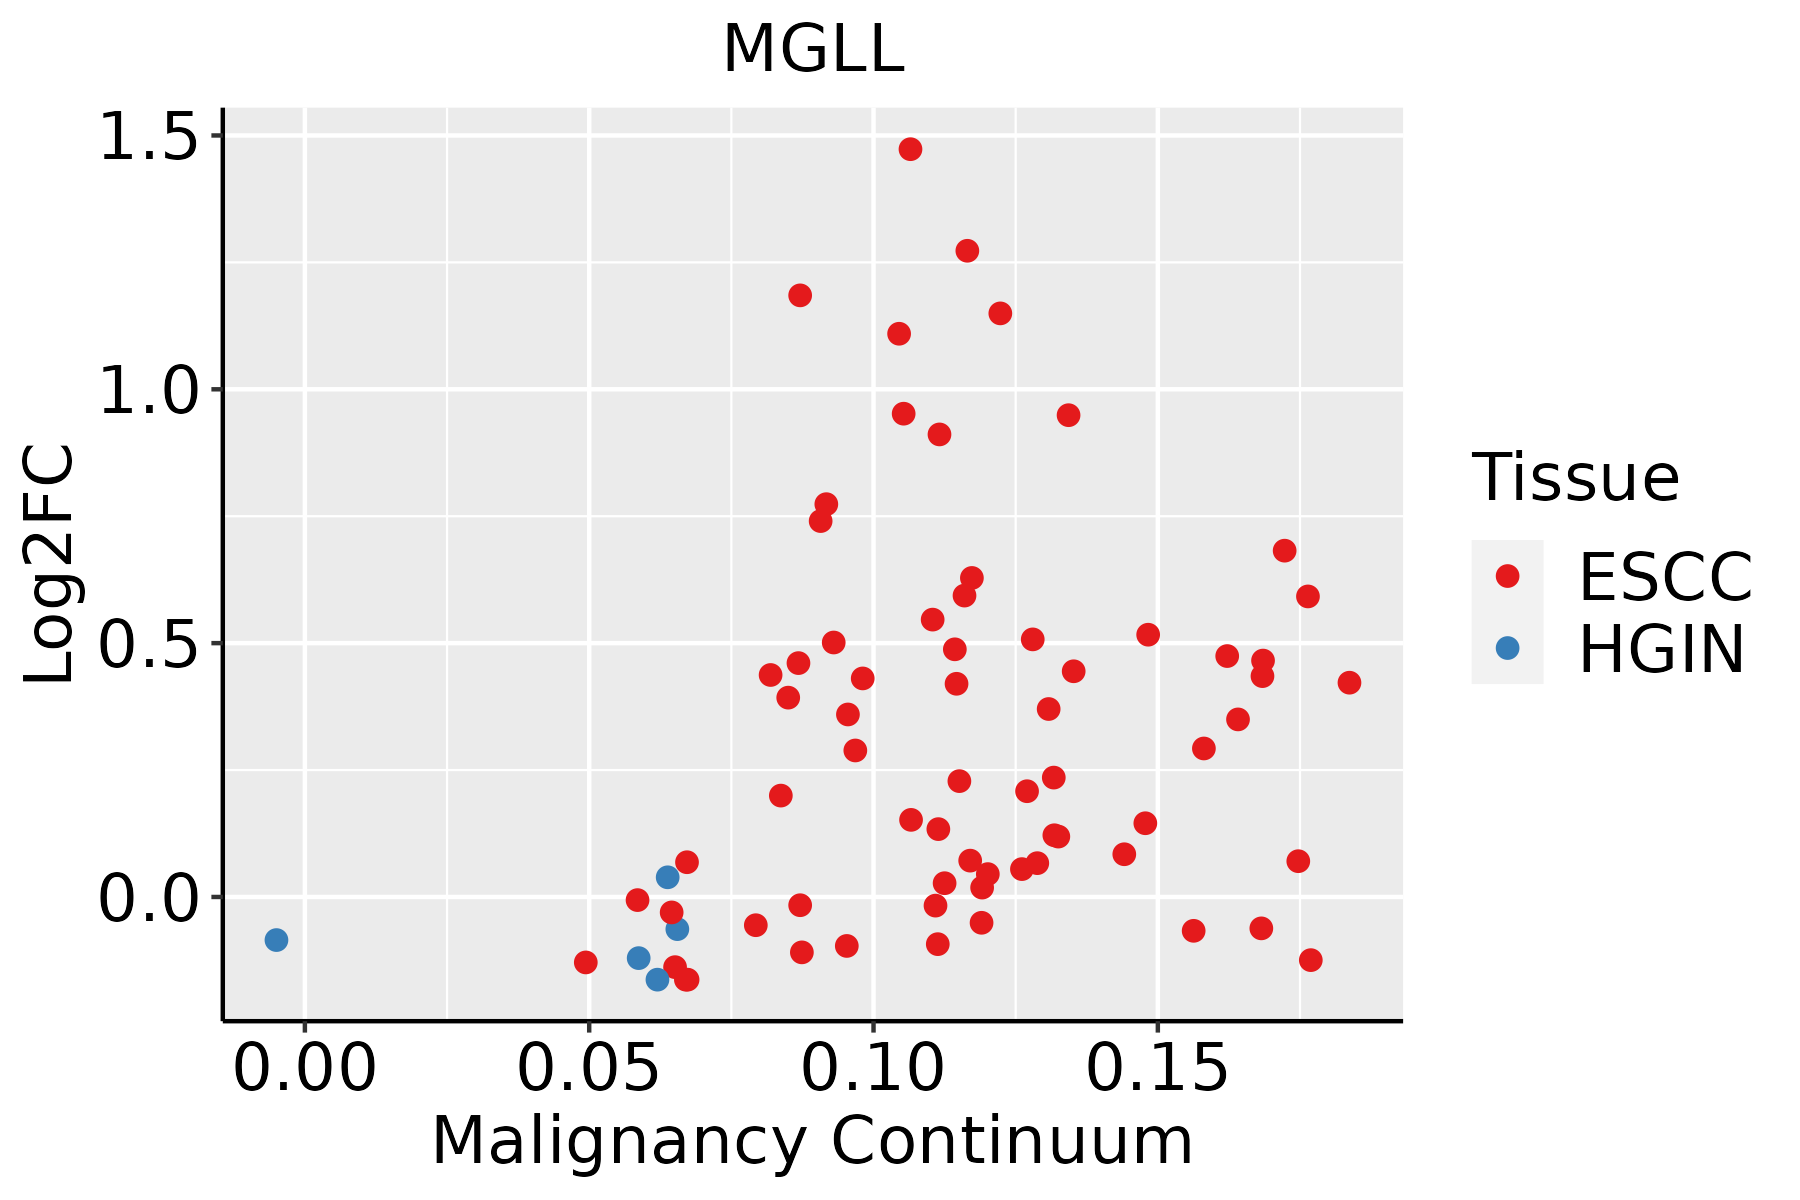 | ESCC: Esophageal squamous cell carcinoma |
| HGIN: High-grade intraepithelial neoplasias | ||
| LGIN: Low-grade intraepithelial neoplasias | ||
| GC |  | CAG: Chronic atrophic gastritis |
| CAG with IM: Chronic atrophic gastritis with intestinal metaplasia | ||
| CSG: Chronic superficial gastritis | ||
| GC: Gastric cancer | ||
| SIM: Severe intestinal metaplasia | ||
| WIM: Wild intestinal metaplasia | ||
| Liver |  | HCC: Hepatocellular carcinoma |
| NAFLD: Non-alcoholic fatty liver disease | ||
| Oral Cavity | 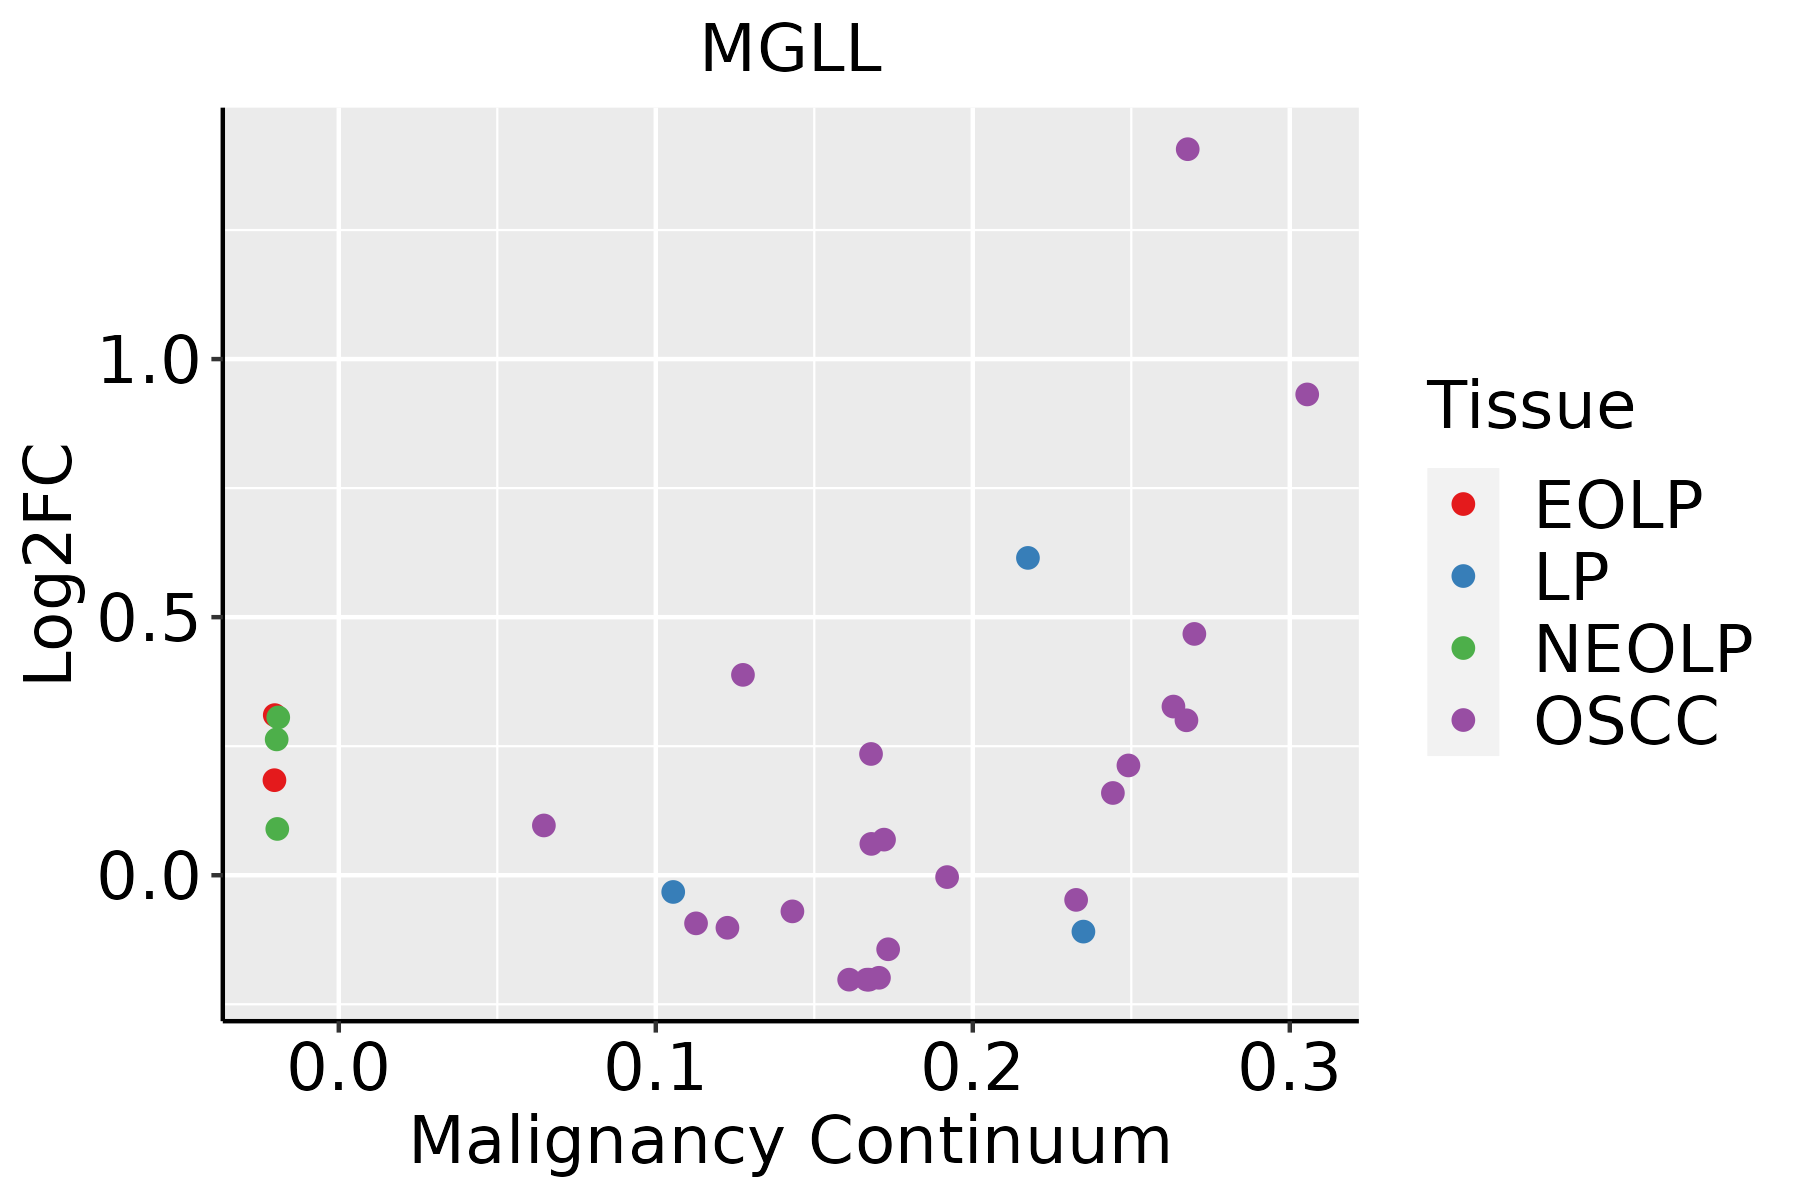 | EOLP: Erosive Oral lichen planus |
| LP: leukoplakia | ||
| NEOLP: Non-erosive oral lichen planus | ||
| OSCC: Oral squamous cell carcinoma | ||
| Thyroid | 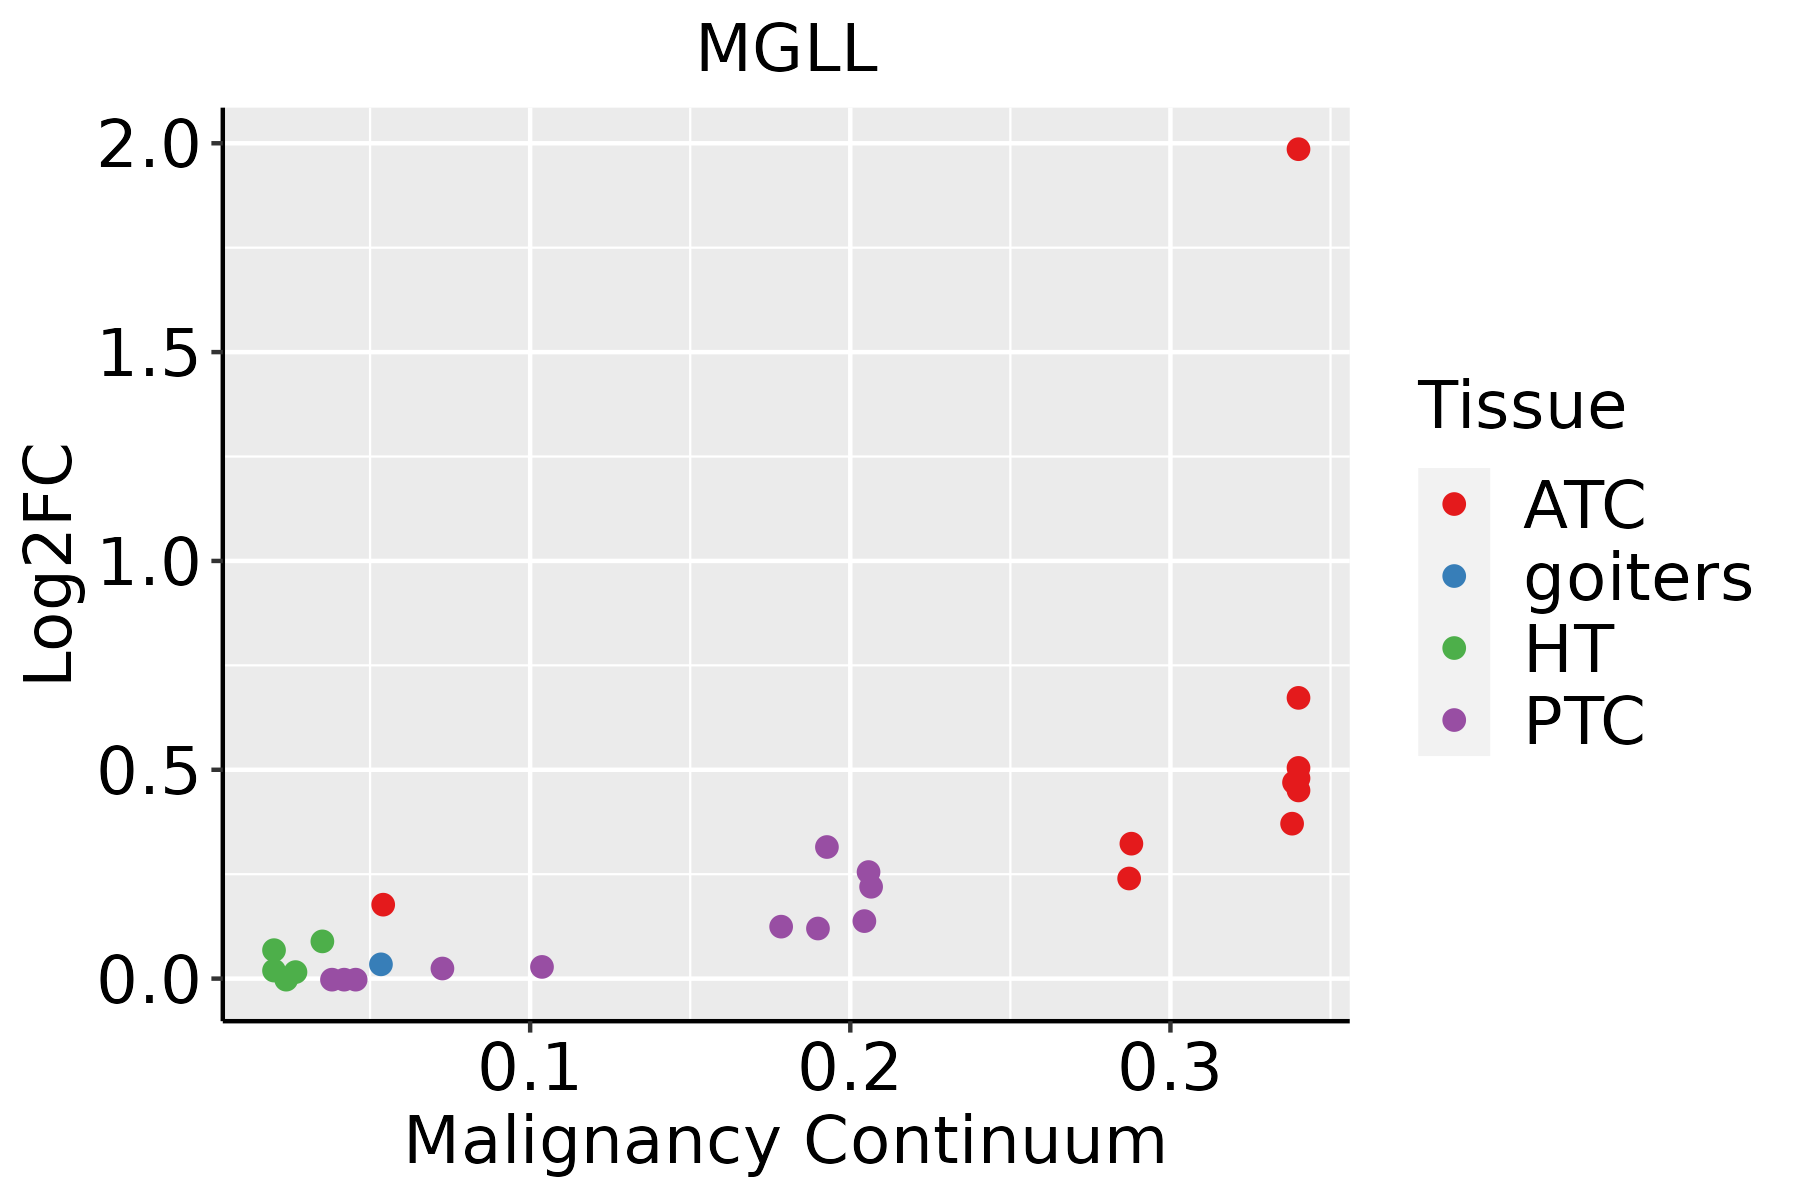 | ATC: Anaplastic thyroid cancer |
| HT: Hashimoto's thyroiditis | ||
| PTC: Papillary thyroid cancer |
| ∗log2FC in expression of this searched gene in stem-like cells from each diseased tissue sample relative to stem-like cells in normal samples in each tissue plotted against the malignancy continuum. Samples are colored based on if they are from different disease stage. |
Top |
Malignant transformation related pathway analysis |
| Find out the enriched GO biological processes and KEGG pathways involved in transition from healthy to precancer to cancer |
| Tissue | Disease Stage | Enriched GO biological Processes |
| Colorectum | AD |  |
| Colorectum | SER |  |
| Colorectum | MSS |  |
| Colorectum | MSI-H |  |
| Colorectum | FAP |  |
| ∗Top 15 enriched GO BP terms are showed in the bar plot of each disease state in each tissue. Each row represents a significant GO biological process which is colored according to the -log10(p.adjust). |
| Page: 1 2 3 4 5 6 7 8 9 |
| GO ID | Tissue | Disease Stage | Description | Gene Ratio | Bg Ratio | pvalue | p.adjust | Count |
| GO:0050727 | Breast | Precancer | regulation of inflammatory response | 44/1080 | 386/18723 | 1.26e-05 | 3.22e-04 | 44 |
| GO:00463946 | Breast | Precancer | carboxylic acid biosynthetic process | 32/1080 | 314/18723 | 1.30e-03 | 1.38e-02 | 32 |
| GO:00723304 | Breast | Precancer | monocarboxylic acid biosynthetic process | 24/1080 | 214/18723 | 1.41e-03 | 1.48e-02 | 24 |
| GO:00160536 | Breast | Precancer | organic acid biosynthetic process | 32/1080 | 316/18723 | 1.44e-03 | 1.50e-02 | 32 |
| GO:00066335 | Breast | Precancer | fatty acid biosynthetic process | 19/1080 | 163/18723 | 2.74e-03 | 2.42e-02 | 19 |
| GO:00507271 | Breast | IDC | regulation of inflammatory response | 48/1434 | 386/18723 | 5.99e-04 | 7.54e-03 | 48 |
| GO:007233012 | Breast | IDC | monocarboxylic acid biosynthetic process | 29/1434 | 214/18723 | 1.91e-03 | 1.83e-02 | 29 |
| GO:001605313 | Breast | IDC | organic acid biosynthetic process | 39/1434 | 316/18723 | 2.13e-03 | 1.99e-02 | 39 |
| GO:000663312 | Breast | IDC | fatty acid biosynthetic process | 23/1434 | 163/18723 | 3.21e-03 | 2.70e-02 | 23 |
| GO:004639413 | Breast | IDC | carboxylic acid biosynthetic process | 38/1434 | 314/18723 | 3.39e-03 | 2.83e-02 | 38 |
| GO:00507272 | Breast | DCIS | regulation of inflammatory response | 46/1390 | 386/18723 | 9.91e-04 | 1.10e-02 | 46 |
| GO:001605322 | Breast | DCIS | organic acid biosynthetic process | 38/1390 | 316/18723 | 2.22e-03 | 2.04e-02 | 38 |
| GO:007233022 | Breast | DCIS | monocarboxylic acid biosynthetic process | 28/1390 | 214/18723 | 2.43e-03 | 2.18e-02 | 28 |
| GO:004639422 | Breast | DCIS | carboxylic acid biosynthetic process | 37/1390 | 314/18723 | 3.56e-03 | 2.92e-02 | 37 |
| GO:000663322 | Breast | DCIS | fatty acid biosynthetic process | 22/1390 | 163/18723 | 4.62e-03 | 3.52e-02 | 22 |
| GO:0016042 | Colorectum | AD | lipid catabolic process | 97/3918 | 320/18723 | 4.31e-05 | 7.56e-04 | 97 |
| GO:0006631 | Colorectum | AD | fatty acid metabolic process | 114/3918 | 390/18723 | 5.58e-05 | 9.44e-04 | 114 |
| GO:0044242 | Colorectum | AD | cellular lipid catabolic process | 66/3918 | 214/18723 | 3.96e-04 | 4.50e-03 | 66 |
| GO:00160421 | Colorectum | SER | lipid catabolic process | 77/2897 | 320/18723 | 3.52e-05 | 9.18e-04 | 77 |
| GO:00442421 | Colorectum | SER | cellular lipid catabolic process | 51/2897 | 214/18723 | 8.60e-04 | 1.05e-02 | 51 |
| Page: 1 2 3 4 5 6 7 8 |
| Pathway ID | Tissue | Disease Stage | Description | Gene Ratio | Bg Ratio | pvalue | p.adjust | qvalue | Count |
| hsa0471424 | Breast | IDC | Thermogenesis | 75/867 | 232/8465 | 8.41e-21 | 3.04e-19 | 2.27e-19 | 75 |
| hsa0472323 | Breast | IDC | Retrograde endocannabinoid signaling | 31/867 | 148/8465 | 7.62e-05 | 7.50e-04 | 5.61e-04 | 31 |
| hsa0471434 | Breast | IDC | Thermogenesis | 75/867 | 232/8465 | 8.41e-21 | 3.04e-19 | 2.27e-19 | 75 |
| hsa0472333 | Breast | IDC | Retrograde endocannabinoid signaling | 31/867 | 148/8465 | 7.62e-05 | 7.50e-04 | 5.61e-04 | 31 |
| hsa0471443 | Breast | DCIS | Thermogenesis | 74/846 | 232/8465 | 8.72e-21 | 3.13e-19 | 2.30e-19 | 74 |
| hsa0471453 | Breast | DCIS | Thermogenesis | 74/846 | 232/8465 | 8.72e-21 | 3.13e-19 | 2.30e-19 | 74 |
| hsa04714 | Colorectum | AD | Thermogenesis | 120/2092 | 232/8465 | 2.76e-19 | 1.16e-17 | 7.37e-18 | 120 |
| hsa04723 | Colorectum | AD | Retrograde endocannabinoid signaling | 59/2092 | 148/8465 | 2.94e-05 | 2.73e-04 | 1.74e-04 | 59 |
| hsa00561 | Colorectum | AD | Glycerolipid metabolism | 24/2092 | 63/8465 | 1.25e-02 | 4.54e-02 | 2.90e-02 | 24 |
| hsa047141 | Colorectum | AD | Thermogenesis | 120/2092 | 232/8465 | 2.76e-19 | 1.16e-17 | 7.37e-18 | 120 |
| hsa047231 | Colorectum | AD | Retrograde endocannabinoid signaling | 59/2092 | 148/8465 | 2.94e-05 | 2.73e-04 | 1.74e-04 | 59 |
| hsa005611 | Colorectum | AD | Glycerolipid metabolism | 24/2092 | 63/8465 | 1.25e-02 | 4.54e-02 | 2.90e-02 | 24 |
| hsa047142 | Colorectum | SER | Thermogenesis | 106/1580 | 232/8465 | 1.15e-21 | 6.34e-20 | 4.61e-20 | 106 |
| hsa047232 | Colorectum | SER | Retrograde endocannabinoid signaling | 47/1580 | 148/8465 | 8.10e-05 | 8.68e-04 | 6.30e-04 | 47 |
| hsa047143 | Colorectum | SER | Thermogenesis | 106/1580 | 232/8465 | 1.15e-21 | 6.34e-20 | 4.61e-20 | 106 |
| hsa047233 | Colorectum | SER | Retrograde endocannabinoid signaling | 47/1580 | 148/8465 | 8.10e-05 | 8.68e-04 | 6.30e-04 | 47 |
| hsa047144 | Colorectum | MSS | Thermogenesis | 113/1875 | 232/8465 | 1.52e-19 | 4.62e-18 | 2.83e-18 | 113 |
| hsa047234 | Colorectum | MSS | Retrograde endocannabinoid signaling | 61/1875 | 148/8465 | 1.21e-07 | 1.93e-06 | 1.18e-06 | 61 |
| hsa005612 | Colorectum | MSS | Glycerolipid metabolism | 23/1875 | 63/8465 | 6.55e-03 | 2.64e-02 | 1.62e-02 | 23 |
| hsa047145 | Colorectum | MSS | Thermogenesis | 113/1875 | 232/8465 | 1.52e-19 | 4.62e-18 | 2.83e-18 | 113 |
| Page: 1 2 3 4 |
Top |
Cell-cell communication analysis |
| Identification of potential cell-cell interactions between two cell types and their ligand-receptor pairs for different disease states |
| Ligand | Receptor | LRpair | Pathway | Tissue | Disease Stage |
| Page: 1 |
Top |
Single-cell gene regulatory network inference analysis |
| Find out the significant the regulons (TFs) and the target genes of each regulon across cell types for different disease states |
| TF | Cell Type | Tissue | Disease Stage | Target Gene | RSS | Regulon Activity |
| ∗The dot plots of a searched regulon are shown for all cell subpopulations in each disease state of each tissue based on the regulon specific score inferred using pySCENIC and by calculating the average expression. |
| Page: 1 |
Top |
Somatic mutation of malignant transformation related genes |
| Annotation of somatic variants for genes involved in malignant transformation |
| Hugo Symbol | Variant Class | Variant Classification | dbSNP RS | HGVSc | HGVSp | HGVSp Short | SWISSPROT | BIOTYPE | SIFT | PolyPhen | Tumor Sample Barcode | Tissue | Histology | Sex | Age | Stage | Therapy Types | Drugs | Outcome |
| MGLL | insertion | In_Frame_Ins | novel | c.407_408insTTGTTATTT | p.Ala136_Ile137insCysTyrPhe | p.A136_I137insCYF | protein_coding | TCGA-AN-A0FX-01 | Breast | breast invasive carcinoma | Female | <65 | I/II | Unknown | Unknown | SD | |||
| MGLL | insertion | Frame_Shift_Ins | novel | c.406_407insAGGTTAGA | p.Ala136GlufsTer77 | p.A136Efs*77 | protein_coding | TCGA-AN-A0FX-01 | Breast | breast invasive carcinoma | Female | <65 | I/II | Unknown | Unknown | SD | |||
| MGLL | insertion | In_Frame_Ins | novel | c.471_472insAGGTACTGGGACTCTGGG | p.Pro157_Leu158insArgTyrTrpAspSerGly | p.P157_L158insRYWDSG | protein_coding | TCGA-B6-A0RE-01 | Breast | breast invasive carcinoma | Female | <65 | I/II | Unknown | Unknown | SD | |||
| MGLL | SNV | Missense_Mutation | rs374353919 | c.521C>T | p.Ala174Val | p.A174V | protein_coding | deleterious(0.01) | benign(0.035) | TCGA-5M-AAT6-01 | Colorectum | colon adenocarcinoma | Female | <65 | III/IV | Unknown | Unknown | PD | |
| MGLL | SNV | Missense_Mutation | c.436C>T | p.Pro146Ser | p.P146S | protein_coding | deleterious(0.02) | possibly_damaging(0.727) | TCGA-A6-6653-01 | Colorectum | colon adenocarcinoma | Male | >=65 | I/II | Unknown | Unknown | SD | ||
| MGLL | SNV | Missense_Mutation | c.249N>G | p.Phe83Leu | p.F83L | protein_coding | deleterious(0) | benign(0.188) | TCGA-AG-3882-01 | Colorectum | rectum adenocarcinoma | Female | >=65 | I/II | Unknown | Unknown | SD | ||
| MGLL | SNV | Missense_Mutation | c.185N>A | p.Gly62Glu | p.G62E | protein_coding | deleterious(0) | probably_damaging(0.998) | TCGA-AG-A002-01 | Colorectum | rectum adenocarcinoma | Male | <65 | I/II | Unknown | Unknown | SD | ||
| MGLL | SNV | Missense_Mutation | rs778074591 | c.271N>A | p.Gly91Arg | p.G91R | protein_coding | deleterious(0) | probably_damaging(1) | TCGA-AG-A01J-01 | Colorectum | rectum adenocarcinoma | Female | <65 | I/II | Unknown | Unknown | SD | |
| MGLL | SNV | Missense_Mutation | novel | c.835N>T | p.His279Tyr | p.H279Y | protein_coding | deleterious(0) | probably_damaging(1) | TCGA-A5-A0G2-01 | Endometrium | uterine corpus endometrioid carcinoma | Female | <65 | III/IV | Unknown | Unknown | SD | |
| MGLL | SNV | Missense_Mutation | novel | c.505N>G | p.Phe169Val | p.F169V | protein_coding | tolerated(0.1) | benign(0.033) | TCGA-A5-A0G2-01 | Endometrium | uterine corpus endometrioid carcinoma | Female | <65 | III/IV | Unknown | Unknown | SD |
| Page: 1 2 3 4 |
Top |
Related drugs of malignant transformation related genes |
| Identification of chemicals and drugs interact with genes involved in malignant transfromation |
| (DGIdb 4.0) |
| Entrez ID | Symbol | Category | Interaction Types | Drug Claim Name | Drug Name | PMIDs |
| 11343 | MGLL | DRUGGABLE GENOME, ENZYME | inhibitor | 252166807 | ||
| 11343 | MGLL | DRUGGABLE GENOME, ENZYME | Carbamate derivative 16 | |||
| 11343 | MGLL | DRUGGABLE GENOME, ENZYME | Pyrazole derivative 81 | |||
| 11343 | MGLL | DRUGGABLE GENOME, ENZYME | Azetidinyl-piperidine derivative 1 | |||
| 11343 | MGLL | DRUGGABLE GENOME, ENZYME | Azetidine-benzoxazin-3(4H)-one derivative 2 | |||
| 11343 | MGLL | DRUGGABLE GENOME, ENZYME | Azetidine-benzoxazin-3(4H)-one derivative 1 | |||
| 11343 | MGLL | DRUGGABLE GENOME, ENZYME | Azetidinyl-piperidine derivative 3 | |||
| 11343 | MGLL | DRUGGABLE GENOME, ENZYME | PMID29053063-Compound-17 | |||
| 11343 | MGLL | DRUGGABLE GENOME, ENZYME | ABX-1431 | |||
| 11343 | MGLL | DRUGGABLE GENOME, ENZYME | 1,4-BIS(MALIMIDO)XYLENE | CHEMBL565711 | 19583260 |
| Page: 1 2 3 4 5 6 |

Copyright 2023-Present -The University of Texas Health Science Center at Houston |