
|
|||||
|
 | |
| |
| |
| |
| |
| |
|
Gene: MGEA5 |
Gene summary for MGEA5 |
| Gene information | Species | Human | Gene symbol | MGEA5 | Gene ID | 10724 |
| Gene name | O-GlcNAcase | |
| Gene Alias | MEA5 | |
| Cytomap | 10q24.32 | |
| Gene Type | protein-coding | GO ID | GO:0006040 | UniProtAcc | O60502 |
Top |
Malignant transformation analysis |
| Identification of the aberrant gene expression in precancerous and cancerous lesions by comparing the gene expression of stem-like cells in diseased tissues with normal stem cells |
| Entrez ID | Symbol | Replicates | Species | Organ | Tissue | Adj P-value | Log2FC | Malignancy |
| 10724 | MGEA5 | HTA11_99999970781_79442 | Human | Colorectum | MSS | 3.27e-64 | 1.10e+00 | 0.294 |
| 10724 | MGEA5 | HTA11_99999965062_69753 | Human | Colorectum | MSI-H | 1.38e-28 | 1.83e+00 | 0.3487 |
| 10724 | MGEA5 | HTA11_99999965104_69814 | Human | Colorectum | MSS | 9.45e-48 | 1.46e+00 | 0.281 |
| 10724 | MGEA5 | HTA11_99999971662_82457 | Human | Colorectum | MSS | 3.14e-46 | 9.11e-01 | 0.3859 |
| 10724 | MGEA5 | HTA11_99999973899_84307 | Human | Colorectum | MSS | 4.31e-06 | 2.55e-01 | 0.2585 |
| 10724 | MGEA5 | HTA11_99999974143_84620 | Human | Colorectum | MSS | 1.42e-14 | 3.11e-01 | 0.3005 |
| 10724 | MGEA5 | P1T-E | Human | Esophagus | ESCC | 3.09e-12 | 7.07e-01 | 0.0875 |
| 10724 | MGEA5 | P2T-E | Human | Esophagus | ESCC | 9.27e-45 | 7.10e-01 | 0.1177 |
| 10724 | MGEA5 | P4T-E | Human | Esophagus | ESCC | 2.60e-17 | 4.72e-01 | 0.1323 |
| 10724 | MGEA5 | P5T-E | Human | Esophagus | ESCC | 6.29e-22 | 4.90e-01 | 0.1327 |
| 10724 | MGEA5 | P8T-E | Human | Esophagus | ESCC | 3.57e-28 | 5.73e-01 | 0.0889 |
| 10724 | MGEA5 | P9T-E | Human | Esophagus | ESCC | 7.47e-11 | 2.22e-01 | 0.1131 |
| 10724 | MGEA5 | P10T-E | Human | Esophagus | ESCC | 8.33e-18 | 2.02e-01 | 0.116 |
| 10724 | MGEA5 | P11T-E | Human | Esophagus | ESCC | 2.17e-08 | 6.55e-01 | 0.1426 |
| 10724 | MGEA5 | P12T-E | Human | Esophagus | ESCC | 1.20e-26 | 6.46e-01 | 0.1122 |
| 10724 | MGEA5 | P15T-E | Human | Esophagus | ESCC | 1.06e-22 | 5.57e-01 | 0.1149 |
| 10724 | MGEA5 | P16T-E | Human | Esophagus | ESCC | 1.18e-27 | 4.70e-01 | 0.1153 |
| 10724 | MGEA5 | P17T-E | Human | Esophagus | ESCC | 6.19e-06 | 3.44e-01 | 0.1278 |
| 10724 | MGEA5 | P19T-E | Human | Esophagus | ESCC | 9.92e-03 | 5.88e-02 | 0.1662 |
| 10724 | MGEA5 | P20T-E | Human | Esophagus | ESCC | 3.36e-22 | 5.19e-01 | 0.1124 |
| Page: 1 2 3 4 5 6 7 |
| Tissue | Expression Dynamics | Abbreviation |
| Colorectum (GSE201348) |  | FAP: Familial adenomatous polyposis |
| CRC: Colorectal cancer | ||
| Colorectum (HTA11) |  | AD: Adenomas |
| SER: Sessile serrated lesions | ||
| MSI-H: Microsatellite-high colorectal cancer | ||
| MSS: Microsatellite stable colorectal cancer | ||
| Esophagus |  | ESCC: Esophageal squamous cell carcinoma |
| HGIN: High-grade intraepithelial neoplasias | ||
| LGIN: Low-grade intraepithelial neoplasias | ||
| Liver |  | HCC: Hepatocellular carcinoma |
| NAFLD: Non-alcoholic fatty liver disease | ||
| Oral Cavity | 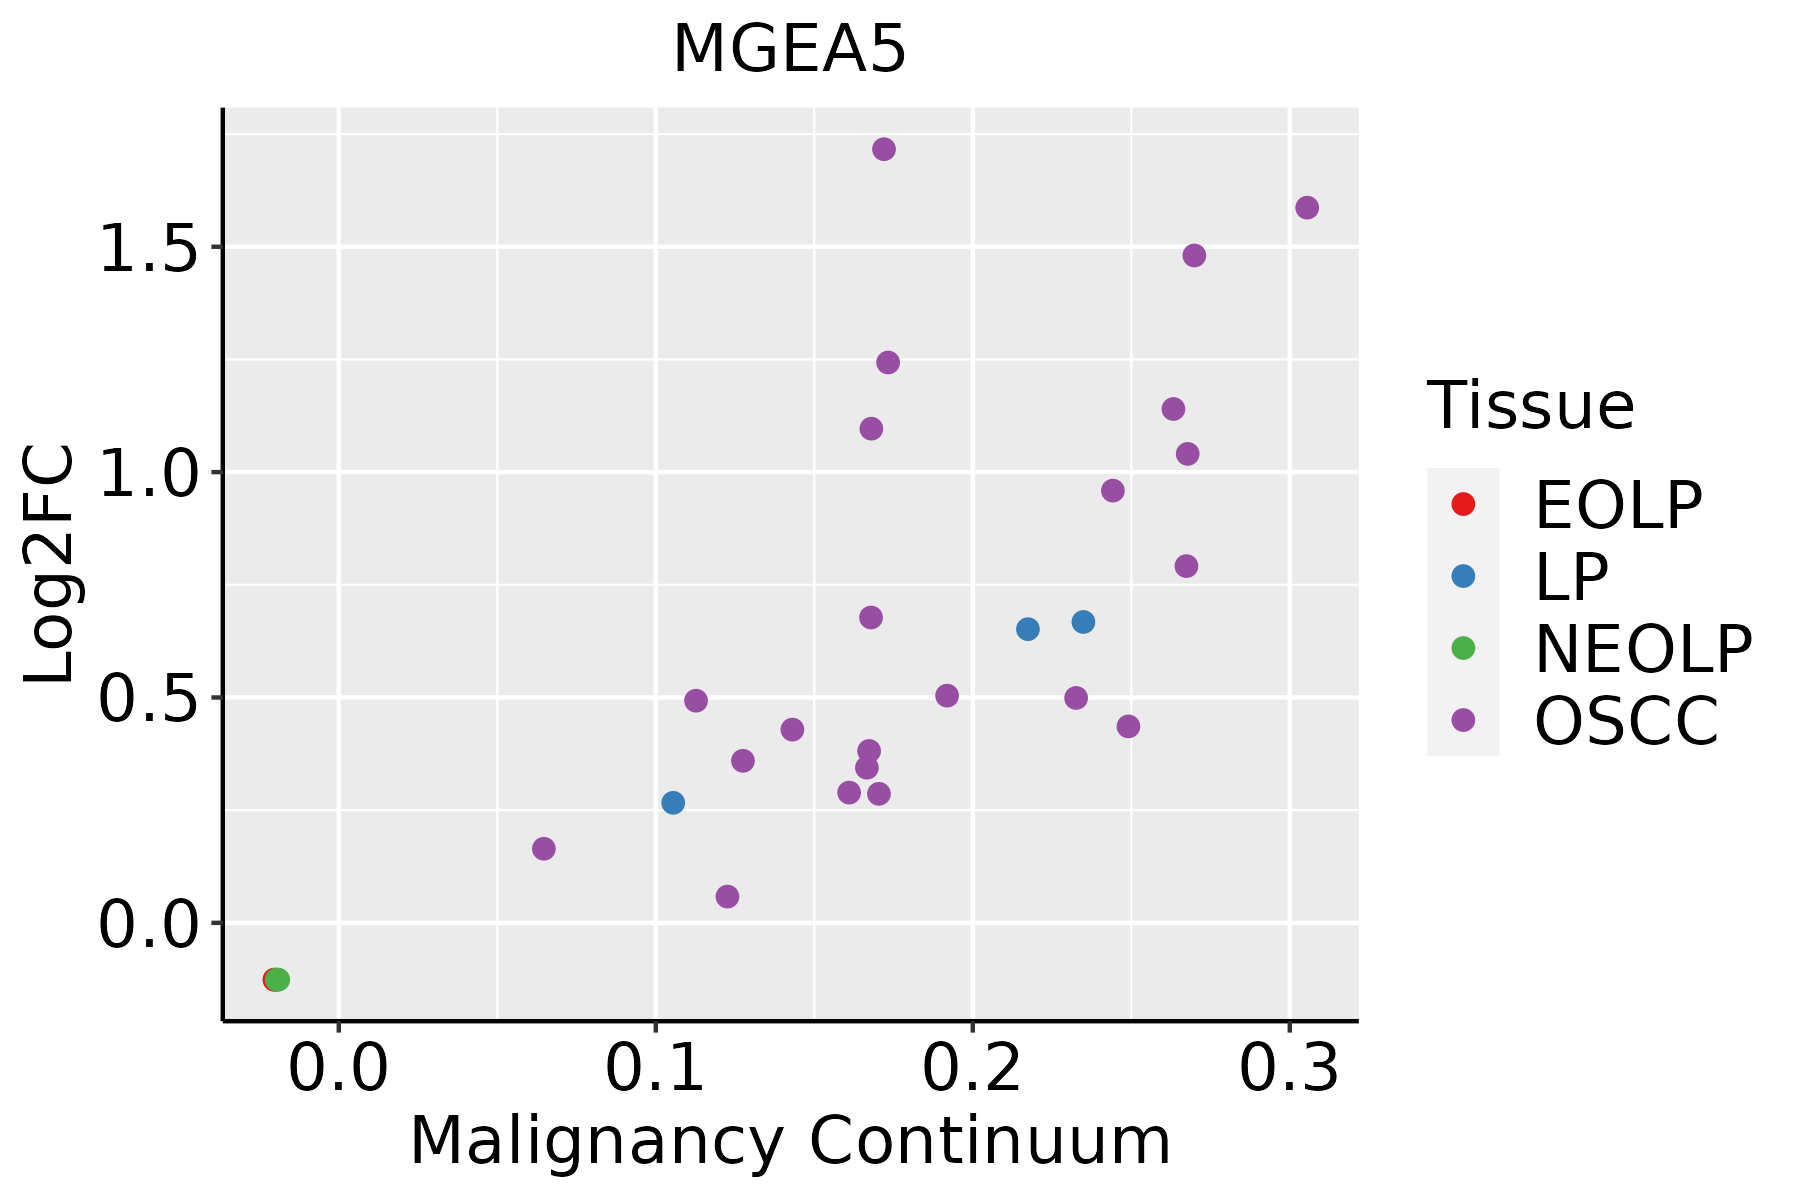 | EOLP: Erosive Oral lichen planus |
| LP: leukoplakia | ||
| NEOLP: Non-erosive oral lichen planus | ||
| OSCC: Oral squamous cell carcinoma | ||
| Prostate | 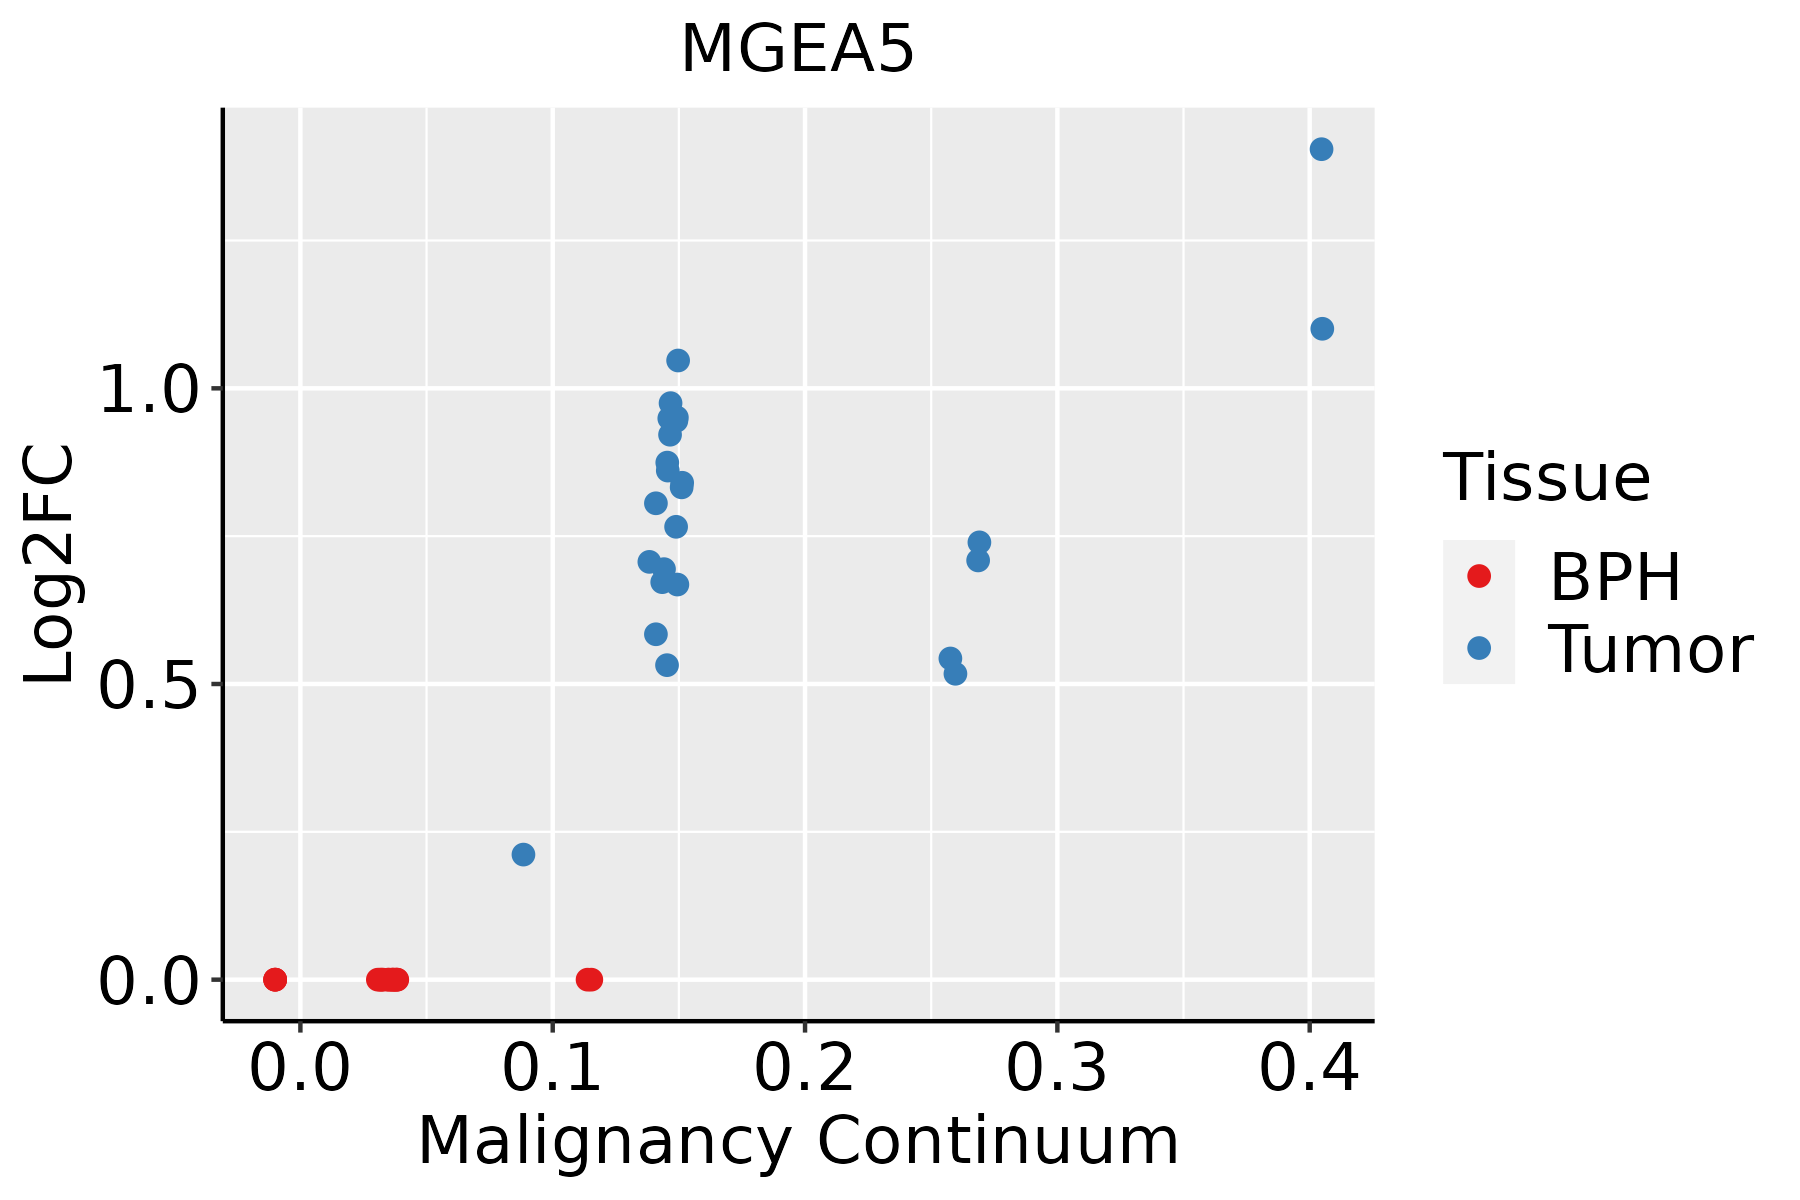 | BPH: Benign Prostatic Hyperplasia |
| Skin |  | AK: Actinic keratosis |
| cSCC: Cutaneous squamous cell carcinoma | ||
| SCCIS:squamous cell carcinoma in situ |
| ∗log2FC in expression of this searched gene in stem-like cells from each diseased tissue sample relative to stem-like cells in normal samples in each tissue plotted against the malignancy continuum. Samples are colored based on if they are from different disease stage. |
Top |
Malignant transformation related pathway analysis |
| Find out the enriched GO biological processes and KEGG pathways involved in transition from healthy to precancer to cancer |
| Tissue | Disease Stage | Enriched GO biological Processes |
| Colorectum | AD |  |
| Colorectum | SER |  |
| Colorectum | MSS |  |
| Colorectum | MSI-H |  |
| Colorectum | FAP |  |
| ∗Top 15 enriched GO BP terms are showed in the bar plot of each disease state in each tissue. Each row represents a significant GO biological process which is colored according to the -log10(p.adjust). |
| Page: 1 2 3 4 5 6 7 8 9 |
| GO ID | Tissue | Disease Stage | Description | Gene Ratio | Bg Ratio | pvalue | p.adjust | Count |
| Page: 1 |
| Pathway ID | Tissue | Disease Stage | Description | Gene Ratio | Bg Ratio | pvalue | p.adjust | qvalue | Count |
| hsa04931 | Colorectum | MSS | Insulin resistance | 36/1875 | 108/8465 | 4.74e-03 | 2.01e-02 | 1.23e-02 | 36 |
| hsa049311 | Colorectum | MSS | Insulin resistance | 36/1875 | 108/8465 | 4.74e-03 | 2.01e-02 | 1.23e-02 | 36 |
| hsa049312 | Colorectum | FAP | Insulin resistance | 32/1404 | 108/8465 | 4.90e-04 | 3.56e-03 | 2.16e-03 | 32 |
| hsa049313 | Colorectum | FAP | Insulin resistance | 32/1404 | 108/8465 | 4.90e-04 | 3.56e-03 | 2.16e-03 | 32 |
| hsa049314 | Colorectum | CRC | Insulin resistance | 28/1091 | 108/8465 | 1.78e-04 | 2.37e-03 | 1.61e-03 | 28 |
| hsa049315 | Colorectum | CRC | Insulin resistance | 28/1091 | 108/8465 | 1.78e-04 | 2.37e-03 | 1.61e-03 | 28 |
| hsa049318 | Esophagus | ESCC | Insulin resistance | 69/4205 | 108/8465 | 1.92e-03 | 5.54e-03 | 2.84e-03 | 69 |
| hsa0493113 | Esophagus | ESCC | Insulin resistance | 69/4205 | 108/8465 | 1.92e-03 | 5.54e-03 | 2.84e-03 | 69 |
| hsa049316 | Liver | NAFLD | Insulin resistance | 29/1043 | 108/8465 | 3.01e-05 | 7.59e-04 | 6.11e-04 | 29 |
| hsa0493111 | Liver | NAFLD | Insulin resistance | 29/1043 | 108/8465 | 3.01e-05 | 7.59e-04 | 6.11e-04 | 29 |
| hsa0493121 | Liver | HCC | Insulin resistance | 77/4020 | 108/8465 | 3.89e-07 | 4.46e-06 | 2.48e-06 | 77 |
| hsa0493131 | Liver | HCC | Insulin resistance | 77/4020 | 108/8465 | 3.89e-07 | 4.46e-06 | 2.48e-06 | 77 |
| Page: 1 |
Top |
Cell-cell communication analysis |
| Identification of potential cell-cell interactions between two cell types and their ligand-receptor pairs for different disease states |
| Ligand | Receptor | LRpair | Pathway | Tissue | Disease Stage |
| Page: 1 |
Top |
Single-cell gene regulatory network inference analysis |
| Find out the significant the regulons (TFs) and the target genes of each regulon across cell types for different disease states |
| TF | Cell Type | Tissue | Disease Stage | Target Gene | RSS | Regulon Activity |
| ∗The dot plots of a searched regulon are shown for all cell subpopulations in each disease state of each tissue based on the regulon specific score inferred using pySCENIC and by calculating the average expression. |
| Page: 1 |
Top |
Somatic mutation of malignant transformation related genes |
| Annotation of somatic variants for genes involved in malignant transformation |
| Hugo Symbol | Variant Class | Variant Classification | dbSNP RS | HGVSc | HGVSp | HGVSp Short | SWISSPROT | BIOTYPE | SIFT | PolyPhen | Tumor Sample Barcode | Tissue | Histology | Sex | Age | Stage | Therapy Types | Drugs | Outcome |
| MGEA5 | SNV | Missense_Mutation | novel | c.258N>T | p.Gln86His | p.Q86H | O60502 | protein_coding | deleterious(0.02) | probably_damaging(0.95) | TCGA-AN-A046-01 | Breast | breast invasive carcinoma | Female | >=65 | I/II | Unknown | Unknown | SD |
| MGEA5 | SNV | Missense_Mutation | c.443C>T | p.Pro148Leu | p.P148L | O60502 | protein_coding | tolerated(0.08) | benign(0.158) | TCGA-AO-A128-01 | Breast | breast invasive carcinoma | Female | <65 | I/II | Chemotherapy | doxorubicin | SD | |
| MGEA5 | SNV | Missense_Mutation | c.2086N>C | p.Asp696His | p.D696H | O60502 | protein_coding | deleterious(0) | benign(0.422) | TCGA-D8-A1JA-01 | Breast | breast invasive carcinoma | Female | <65 | III/IV | Chemotherapy | adriamycin | PD | |
| MGEA5 | SNV | Missense_Mutation | c.437N>T | p.Ser146Phe | p.S146F | O60502 | protein_coding | deleterious(0) | probably_damaging(0.999) | TCGA-D8-A27G-01 | Breast | breast invasive carcinoma | Female | >=65 | I/II | Unknown | Unknown | SD | |
| MGEA5 | SNV | Missense_Mutation | c.836N>T | p.Asp279Val | p.D279V | O60502 | protein_coding | deleterious(0) | probably_damaging(1) | TCGA-E2-A1LB-01 | Breast | breast invasive carcinoma | Female | <65 | I/II | Chemotherapy | cytoxan | SD | |
| MGEA5 | insertion | Frame_Shift_Ins | novel | c.1760_1761insGGGAATTTCAATGGCTTCGAGC | p.Asn588GlyfsTer9 | p.N588Gfs*9 | O60502 | protein_coding | TCGA-E2-A156-01 | Breast | breast invasive carcinoma | Female | <65 | I/II | Hormone Therapy | arimidex | SD | ||
| MGEA5 | SNV | Missense_Mutation | c.1829N>T | p.Arg610Leu | p.R610L | O60502 | protein_coding | deleterious(0) | probably_damaging(0.96) | TCGA-C5-A1ME-01 | Cervix | cervical & endocervical cancer | Female | <65 | I/II | Unknown | Unknown | SD | |
| MGEA5 | SNV | Missense_Mutation | c.796N>C | p.Glu266Gln | p.E266Q | O60502 | protein_coding | deleterious(0.01) | possibly_damaging(0.892) | TCGA-EX-A69L-01 | Cervix | cervical & endocervical cancer | Female | <65 | I/II | Unknown | Unknown | SD | |
| MGEA5 | SNV | Missense_Mutation | c.406N>A | p.Ala136Thr | p.A136T | O60502 | protein_coding | deleterious(0) | probably_damaging(0.999) | TCGA-A6-5661-01 | Colorectum | colon adenocarcinoma | Female | >=65 | I/II | Unknown | Unknown | SD | |
| MGEA5 | SNV | Missense_Mutation | c.2537N>G | p.Asp846Gly | p.D846G | O60502 | protein_coding | tolerated(0.19) | benign(0.147) | TCGA-AA-3684-01 | Colorectum | colon adenocarcinoma | Female | >=65 | III/IV | Unknown | Unknown | SD |
| Page: 1 2 3 4 5 6 7 8 |
Top |
Related drugs of malignant transformation related genes |
| Identification of chemicals and drugs interact with genes involved in malignant transfromation |
| (DGIdb 4.0) |
| Entrez ID | Symbol | Category | Interaction Types | Drug Claim Name | Drug Name | PMIDs |
| Page: 1 |

Copyright 2023-Present -The University of Texas Health Science Center at Houston |