
|
|||||
|
 | |
| |
| |
| |
| |
| |
|
Gene: MGAT4C |
Gene summary for MGAT4C |
| Gene information | Species | Human | Gene symbol | MGAT4C | Gene ID | 25834 |
| Gene name | MGAT4 family member C | |
| Gene Alias | GNTIVH | |
| Cytomap | 12q21.31-q21.32 | |
| Gene Type | protein-coding | GO ID | GO:0006464 | UniProtAcc | Q9UBM8 |
Top |
Malignant transformation analysis |
| Identification of the aberrant gene expression in precancerous and cancerous lesions by comparing the gene expression of stem-like cells in diseased tissues with normal stem cells |
| Entrez ID | Symbol | Replicates | Species | Organ | Tissue | Adj P-value | Log2FC | Malignancy |
| 25834 | MGAT4C | HTA12-15-2 | Human | Pancreas | PDAC | 4.45e-06 | 4.54e-01 | 0.2315 |
| 25834 | MGAT4C | HTA12-23-1 | Human | Pancreas | PDAC | 8.83e-07 | 7.32e-01 | 0.3405 |
| 25834 | MGAT4C | HTA12-25-1 | Human | Pancreas | PDAC | 3.07e-08 | 5.97e-01 | 0.313 |
| 25834 | MGAT4C | HTA12-26-1 | Human | Pancreas | PDAC | 6.32e-21 | 9.98e-01 | 0.3728 |
| 25834 | MGAT4C | HTA12-29-1 | Human | Pancreas | PDAC | 1.93e-09 | 3.05e-01 | 0.3722 |
| 25834 | MGAT4C | male-WTA | Human | Thyroid | PTC | 1.64e-44 | 5.50e-01 | 0.1037 |
| 25834 | MGAT4C | PTC01 | Human | Thyroid | PTC | 1.34e-38 | 8.86e-01 | 0.1899 |
| 25834 | MGAT4C | PTC04 | Human | Thyroid | PTC | 2.22e-15 | 5.95e-01 | 0.1927 |
| 25834 | MGAT4C | PTC05 | Human | Thyroid | PTC | 6.48e-28 | 1.46e+00 | 0.2065 |
| 25834 | MGAT4C | PTC06 | Human | Thyroid | PTC | 8.25e-78 | 2.49e+00 | 0.2057 |
| 25834 | MGAT4C | PTC07 | Human | Thyroid | PTC | 4.33e-91 | 1.80e+00 | 0.2044 |
| Page: 1 |
| Tissue | Expression Dynamics | Abbreviation |
| Thyroid | 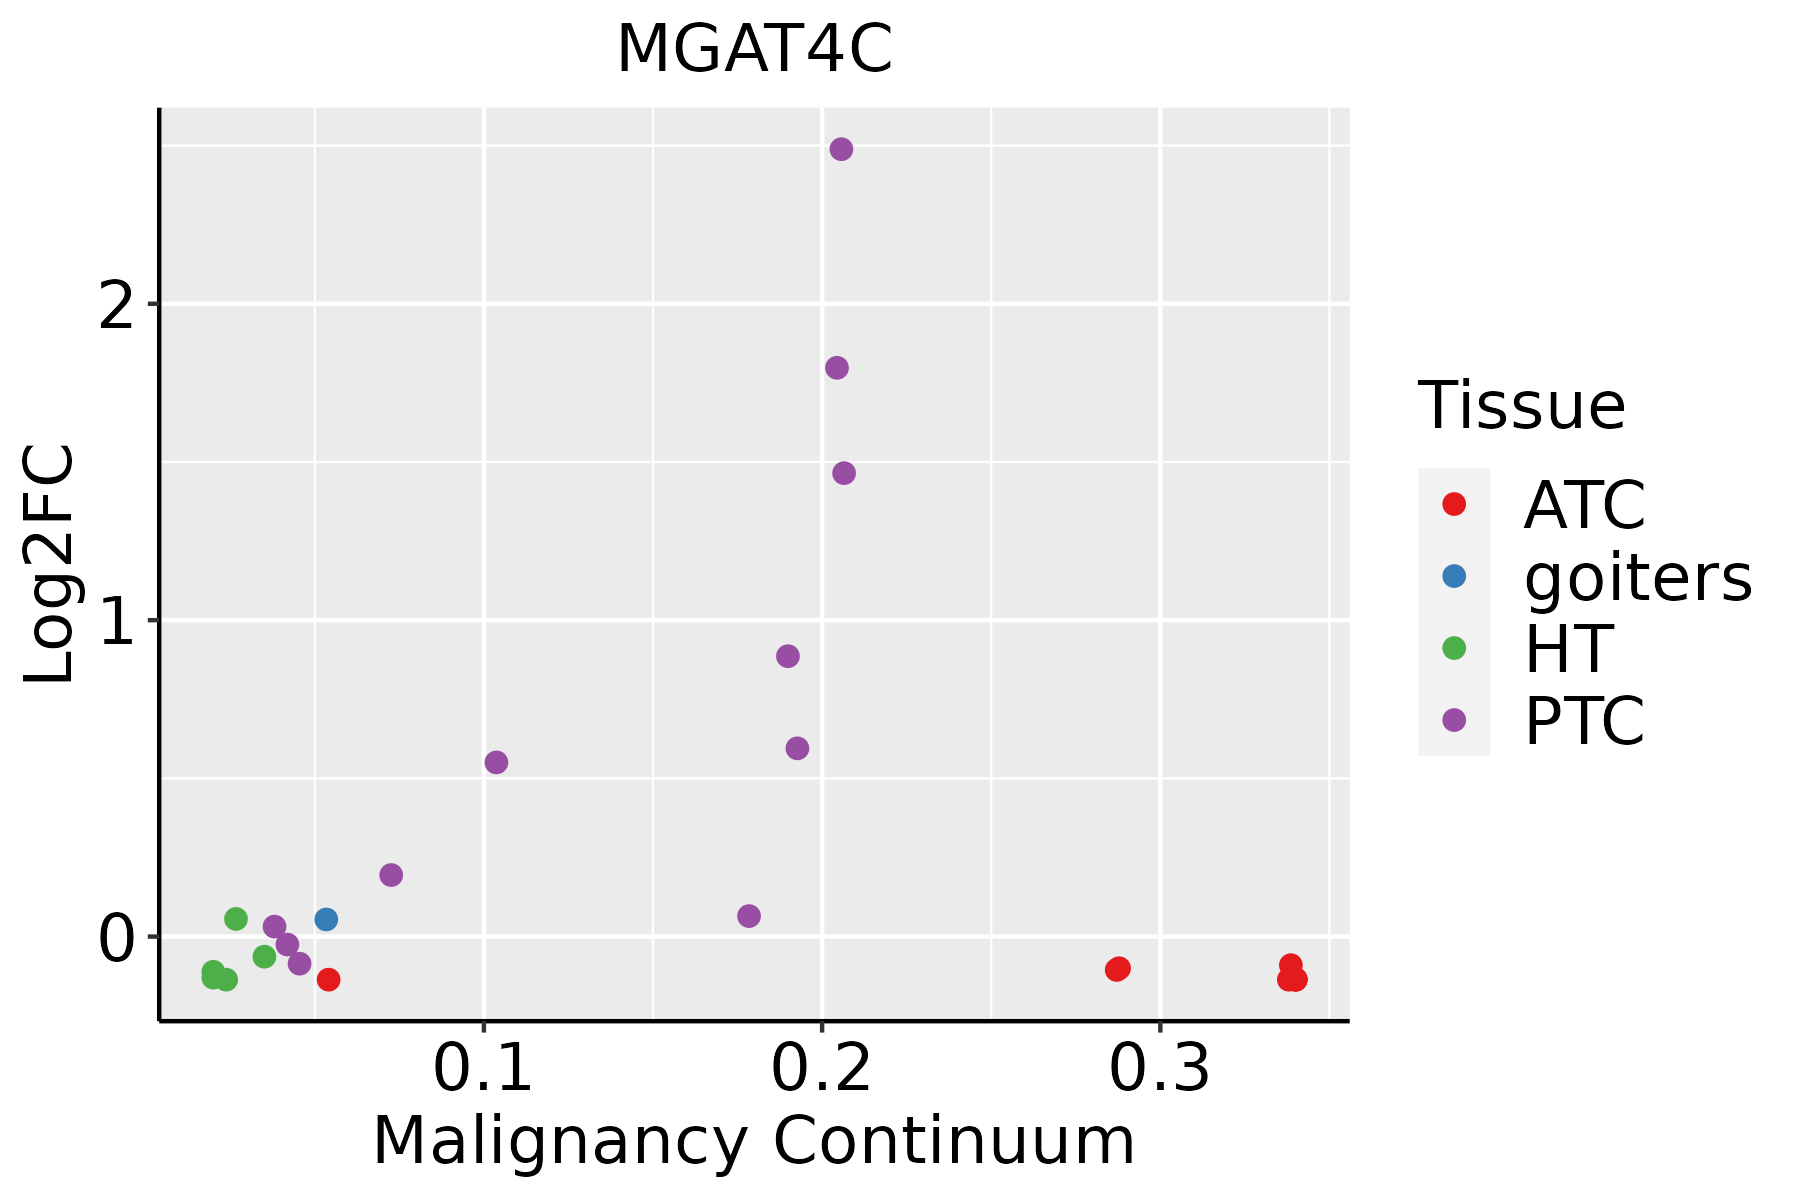 | ATC: Anaplastic thyroid cancer |
| HT: Hashimoto's thyroiditis | ||
| PTC: Papillary thyroid cancer |
| ∗log2FC in expression of this searched gene in stem-like cells from each diseased tissue sample relative to stem-like cells in normal samples in each tissue plotted against the malignancy continuum. Samples are colored based on if they are from different disease stage. |
Top |
Malignant transformation related pathway analysis |
| Find out the enriched GO biological processes and KEGG pathways involved in transition from healthy to precancer to cancer |
| Tissue | Disease Stage | Enriched GO biological Processes |
| Colorectum | AD |  |
| Colorectum | SER |  |
| Colorectum | MSS |  |
| Colorectum | MSI-H |  |
| Colorectum | FAP |  |
| ∗Top 15 enriched GO BP terms are showed in the bar plot of each disease state in each tissue. Each row represents a significant GO biological process which is colored according to the -log10(p.adjust). |
| Page: 1 2 3 4 5 6 7 8 9 |
| GO ID | Tissue | Disease Stage | Description | Gene Ratio | Bg Ratio | pvalue | p.adjust | Count |
| GO:0016032113 | Thyroid | PTC | viral process | 236/5968 | 415/18723 | 2.48e-26 | 8.24e-24 | 236 |
| GO:0019080110 | Thyroid | PTC | viral gene expression | 65/5968 | 94/18723 | 1.25e-13 | 6.69e-12 | 65 |
| GO:00064878 | Thyroid | PTC | protein N-linked glycosylation | 38/5968 | 65/18723 | 8.71e-06 | 9.94e-05 | 38 |
| GO:00190827 | Thyroid | PTC | viral protein processing | 18/5968 | 29/18723 | 7.83e-04 | 4.86e-03 | 18 |
| GO:00064866 | Thyroid | PTC | protein glycosylation | 94/5968 | 226/18723 | 1.25e-03 | 7.13e-03 | 94 |
| GO:00434136 | Thyroid | PTC | macromolecule glycosylation | 94/5968 | 226/18723 | 1.25e-03 | 7.13e-03 | 94 |
| GO:00700855 | Thyroid | PTC | glycosylation | 96/5968 | 240/18723 | 4.57e-03 | 2.15e-02 | 96 |
| GO:00091013 | Thyroid | PTC | glycoprotein biosynthetic process | 123/5968 | 317/18723 | 5.05e-03 | 2.33e-02 | 123 |
| GO:00091003 | Thyroid | PTC | glycoprotein metabolic process | 147/5968 | 387/18723 | 5.87e-03 | 2.64e-02 | 147 |
| Page: 1 |
| Pathway ID | Tissue | Disease Stage | Description | Gene Ratio | Bg Ratio | pvalue | p.adjust | qvalue | Count |
| Page: 1 |
Top |
Cell-cell communication analysis |
| Identification of potential cell-cell interactions between two cell types and their ligand-receptor pairs for different disease states |
| Ligand | Receptor | LRpair | Pathway | Tissue | Disease Stage |
| Page: 1 |
Top |
Single-cell gene regulatory network inference analysis |
| Find out the significant the regulons (TFs) and the target genes of each regulon across cell types for different disease states |
| TF | Cell Type | Tissue | Disease Stage | Target Gene | RSS | Regulon Activity |
| ∗The dot plots of a searched regulon are shown for all cell subpopulations in each disease state of each tissue based on the regulon specific score inferred using pySCENIC and by calculating the average expression. |
| Page: 1 |
Top |
Somatic mutation of malignant transformation related genes |
| Annotation of somatic variants for genes involved in malignant transformation |
| Hugo Symbol | Variant Class | Variant Classification | dbSNP RS | HGVSc | HGVSp | HGVSp Short | SWISSPROT | BIOTYPE | SIFT | PolyPhen | Tumor Sample Barcode | Tissue | Histology | Sex | Age | Stage | Therapy Types | Drugs | Outcome |
| MGAT4C | SNV | Missense_Mutation | c.811N>T | p.Arg271Cys | p.R271C | Q9UBM8 | protein_coding | tolerated(0.1) | probably_damaging(0.97) | TCGA-AN-A0FJ-01 | Breast | breast invasive carcinoma | Female | <65 | III/IV | Unknown | Unknown | SD | |
| MGAT4C | SNV | Missense_Mutation | c.301C>G | p.Leu101Val | p.L101V | Q9UBM8 | protein_coding | deleterious(0) | probably_damaging(0.999) | TCGA-B6-A0RQ-01 | Breast | breast invasive carcinoma | Female | >=65 | I/II | Unknown | Unknown | SD | |
| MGAT4C | SNV | Missense_Mutation | c.43N>C | p.Asp15His | p.D15H | Q9UBM8 | protein_coding | deleterious_low_confidence(0.04) | possibly_damaging(0.688) | TCGA-BH-A0HP-01 | Breast | breast invasive carcinoma | Female | >=65 | III/IV | Chemotherapy | doxorubicin | SD | |
| MGAT4C | SNV | Missense_Mutation | c.1300G>A | p.Glu434Lys | p.E434K | Q9UBM8 | protein_coding | tolerated(0.81) | benign(0.052) | TCGA-C5-A1MK-01 | Cervix | cervical & endocervical cancer | Female | >=65 | III/IV | Chemotherapy | carboplatin | PD | |
| MGAT4C | SNV | Missense_Mutation | c.867G>T | p.Leu289Phe | p.L289F | Q9UBM8 | protein_coding | deleterious(0.03) | probably_damaging(0.996) | TCGA-C5-A1MK-01 | Cervix | cervical & endocervical cancer | Female | >=65 | III/IV | Chemotherapy | carboplatin | PD | |
| MGAT4C | SNV | Missense_Mutation | c.584N>C | p.Arg195Thr | p.R195T | Q9UBM8 | protein_coding | deleterious(0) | probably_damaging(0.983) | TCGA-IR-A3LK-01 | Cervix | cervical & endocervical cancer | Female | >=65 | I/II | Chemotherapy | cisplatin | PD | |
| MGAT4C | SNV | Missense_Mutation | c.400G>A | p.Glu134Lys | p.E134K | Q9UBM8 | protein_coding | tolerated(0.09) | benign(0.207) | TCGA-VS-A8QA-01 | Cervix | cervical & endocervical cancer | Female | <65 | I/II | Unknown | Unknown | SD | |
| MGAT4C | SNV | Missense_Mutation | rs199811466 | c.728C>T | p.Ser243Phe | p.S243F | Q9UBM8 | protein_coding | deleterious(0) | probably_damaging(0.979) | TCGA-VS-A9UI-01 | Cervix | cervical & endocervical cancer | Female | >=65 | I/II | Unknown | Unknown | SD |
| MGAT4C | insertion | Frame_Shift_Ins | novel | c.827_828insT | p.Leu276PhefsTer11 | p.L276Ffs*11 | Q9UBM8 | protein_coding | TCGA-2W-A8YY-01 | Cervix | cervical & endocervical cancer | Female | <65 | I/II | Chemotherapy | cisplatin | CR | ||
| MGAT4C | SNV | Missense_Mutation | rs749402312 | c.878N>A | p.Arg293His | p.R293H | Q9UBM8 | protein_coding | tolerated(0.17) | probably_damaging(0.993) | TCGA-5M-AAT6-01 | Colorectum | colon adenocarcinoma | Female | <65 | III/IV | Unknown | Unknown | PD |
| Page: 1 2 3 4 5 6 7 8 9 10 11 |
Top |
Related drugs of malignant transformation related genes |
| Identification of chemicals and drugs interact with genes involved in malignant transfromation |
| (DGIdb 4.0) |
| Entrez ID | Symbol | Category | Interaction Types | Drug Claim Name | Drug Name | PMIDs |
| Page: 1 |

Copyright 2023-Present -The University of Texas Health Science Center at Houston |