
|
|||||
|
 | |
| |
| |
| |
| |
| |
|
Gene: MGAT4B |
Gene summary for MGAT4B |
| Gene information | Species | Human | Gene symbol | MGAT4B | Gene ID | 11282 |
| Gene name | alpha-1,3-mannosyl-glycoprotein 4-beta-N-acetylglucosaminyltransferase B | |
| Gene Alias | GNT-IV | |
| Cytomap | 5q35.3 | |
| Gene Type | protein-coding | GO ID | GO:0006464 | UniProtAcc | Q9UQ53 |
Top |
Malignant transformation analysis |
| Identification of the aberrant gene expression in precancerous and cancerous lesions by comparing the gene expression of stem-like cells in diseased tissues with normal stem cells |
| Entrez ID | Symbol | Replicates | Species | Organ | Tissue | Adj P-value | Log2FC | Malignancy |
| 11282 | MGAT4B | HTA11_3410_2000001011 | Human | Colorectum | AD | 1.23e-11 | 3.26e-01 | 0.0155 |
| 11282 | MGAT4B | HTA11_2487_2000001011 | Human | Colorectum | SER | 7.23e-31 | 1.03e+00 | -0.1808 |
| 11282 | MGAT4B | HTA11_2951_2000001011 | Human | Colorectum | AD | 8.67e-03 | 4.86e-01 | 0.0216 |
| 11282 | MGAT4B | HTA11_1938_2000001011 | Human | Colorectum | AD | 2.00e-18 | 8.85e-01 | -0.0811 |
| 11282 | MGAT4B | HTA11_78_2000001011 | Human | Colorectum | AD | 2.37e-26 | 1.02e+00 | -0.1088 |
| 11282 | MGAT4B | HTA11_347_2000001011 | Human | Colorectum | AD | 1.25e-69 | 1.38e+00 | -0.1954 |
| 11282 | MGAT4B | HTA11_411_2000001011 | Human | Colorectum | SER | 1.94e-17 | 1.54e+00 | -0.2602 |
| 11282 | MGAT4B | HTA11_2112_2000001011 | Human | Colorectum | SER | 9.89e-10 | 1.08e+00 | -0.2196 |
| 11282 | MGAT4B | HTA11_3361_2000001011 | Human | Colorectum | AD | 2.54e-19 | 7.95e-01 | -0.1207 |
| 11282 | MGAT4B | HTA11_83_2000001011 | Human | Colorectum | SER | 2.62e-26 | 1.15e+00 | -0.1526 |
| 11282 | MGAT4B | HTA11_696_2000001011 | Human | Colorectum | AD | 5.89e-41 | 9.52e-01 | -0.1464 |
| 11282 | MGAT4B | HTA11_866_2000001011 | Human | Colorectum | AD | 1.28e-17 | 6.51e-01 | -0.1001 |
| 11282 | MGAT4B | HTA11_1391_2000001011 | Human | Colorectum | AD | 1.23e-35 | 1.08e+00 | -0.059 |
| 11282 | MGAT4B | HTA11_2992_2000001011 | Human | Colorectum | SER | 3.49e-17 | 1.36e+00 | -0.1706 |
| 11282 | MGAT4B | HTA11_5212_2000001011 | Human | Colorectum | AD | 1.22e-16 | 1.26e+00 | -0.2061 |
| 11282 | MGAT4B | HTA11_5216_2000001011 | Human | Colorectum | SER | 8.32e-10 | 8.51e-01 | -0.1462 |
| 11282 | MGAT4B | HTA11_546_2000001011 | Human | Colorectum | AD | 7.05e-12 | 6.83e-01 | -0.0842 |
| 11282 | MGAT4B | HTA11_9341_2000001011 | Human | Colorectum | SER | 2.14e-08 | 8.33e-01 | -0.00410000000000005 |
| 11282 | MGAT4B | HTA11_7862_2000001011 | Human | Colorectum | AD | 2.12e-10 | 6.89e-01 | -0.0179 |
| 11282 | MGAT4B | HTA11_866_3004761011 | Human | Colorectum | AD | 1.23e-35 | 9.22e-01 | 0.096 |
| Page: 1 2 3 4 5 6 7 8 |
| Tissue | Expression Dynamics | Abbreviation |
| Colorectum (GSE201348) |  | FAP: Familial adenomatous polyposis |
| CRC: Colorectal cancer | ||
| Colorectum (HTA11) |  | AD: Adenomas |
| SER: Sessile serrated lesions | ||
| MSI-H: Microsatellite-high colorectal cancer | ||
| MSS: Microsatellite stable colorectal cancer | ||
| Esophagus | 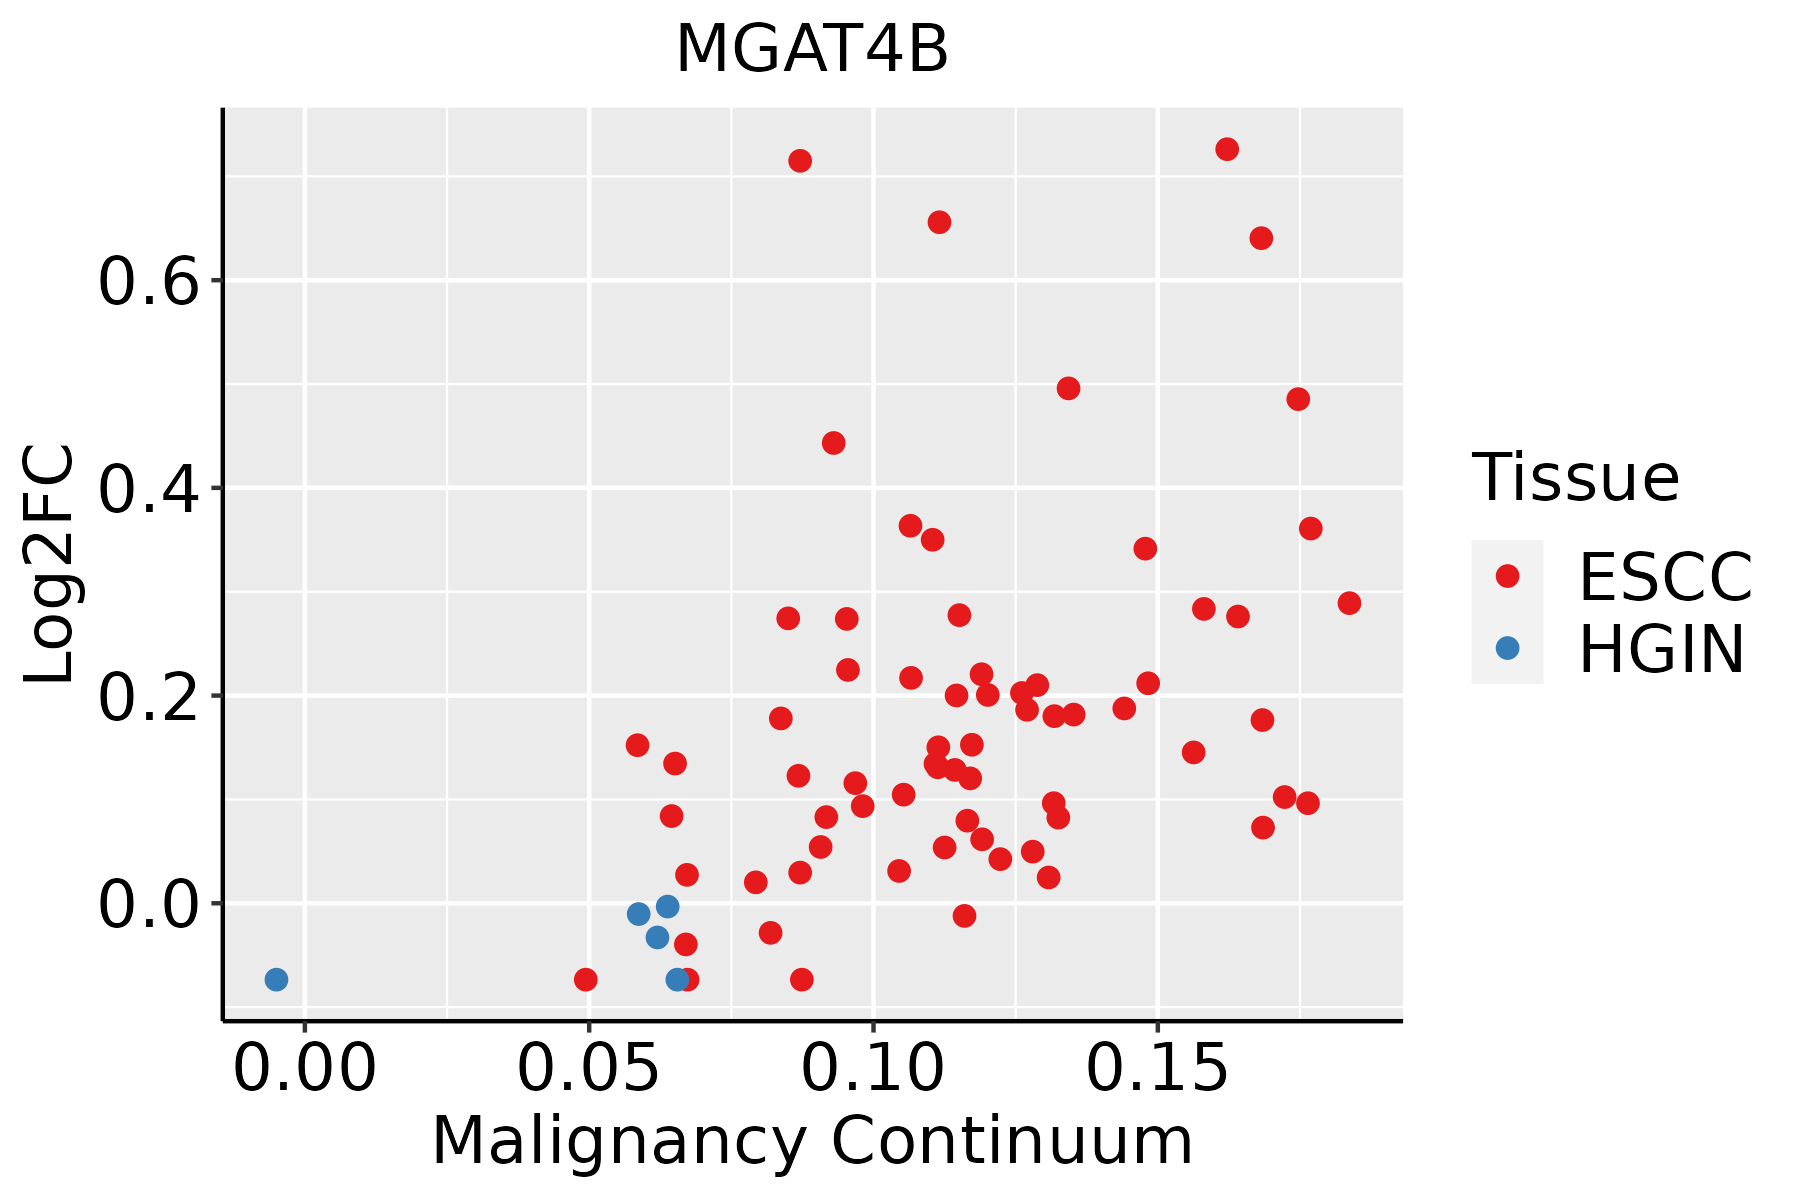 | ESCC: Esophageal squamous cell carcinoma |
| HGIN: High-grade intraepithelial neoplasias | ||
| LGIN: Low-grade intraepithelial neoplasias | ||
| Liver | 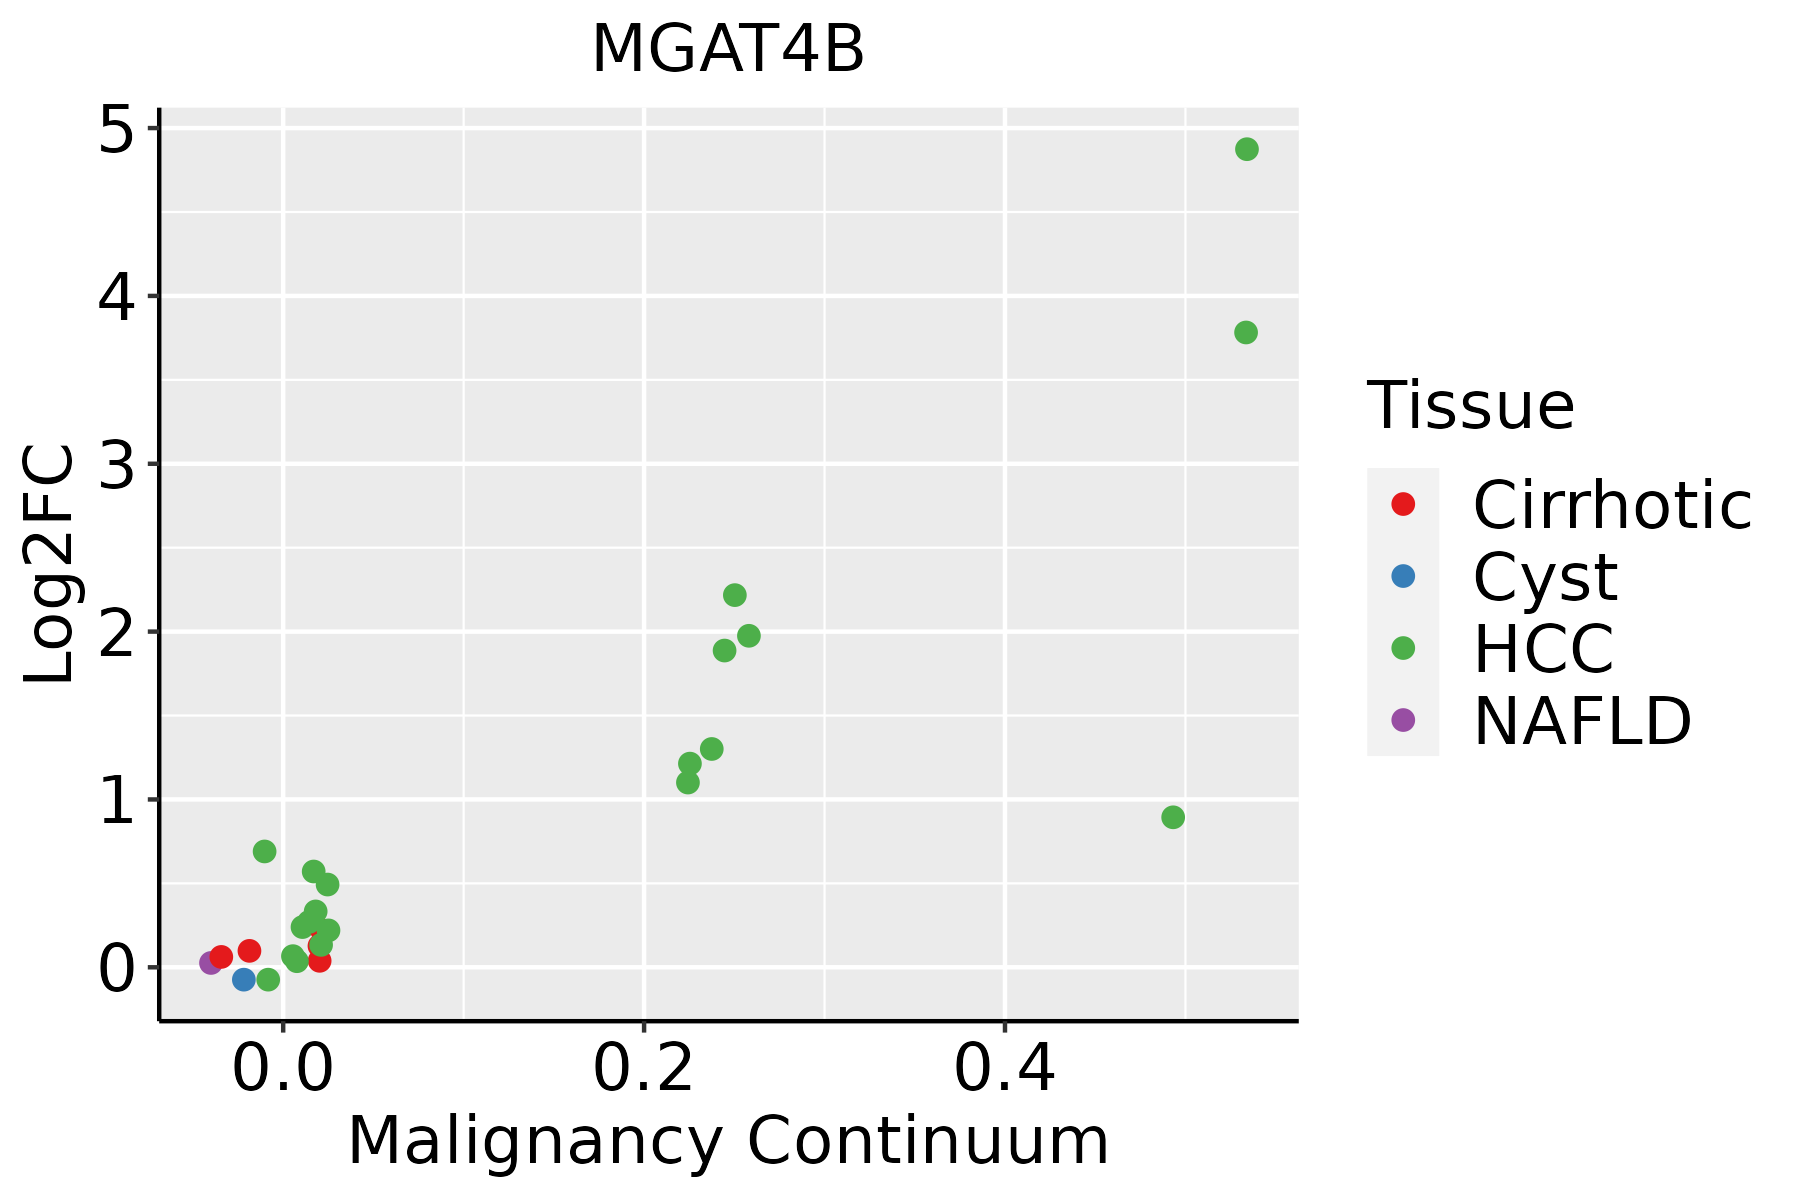 | HCC: Hepatocellular carcinoma |
| NAFLD: Non-alcoholic fatty liver disease | ||
| Oral Cavity | 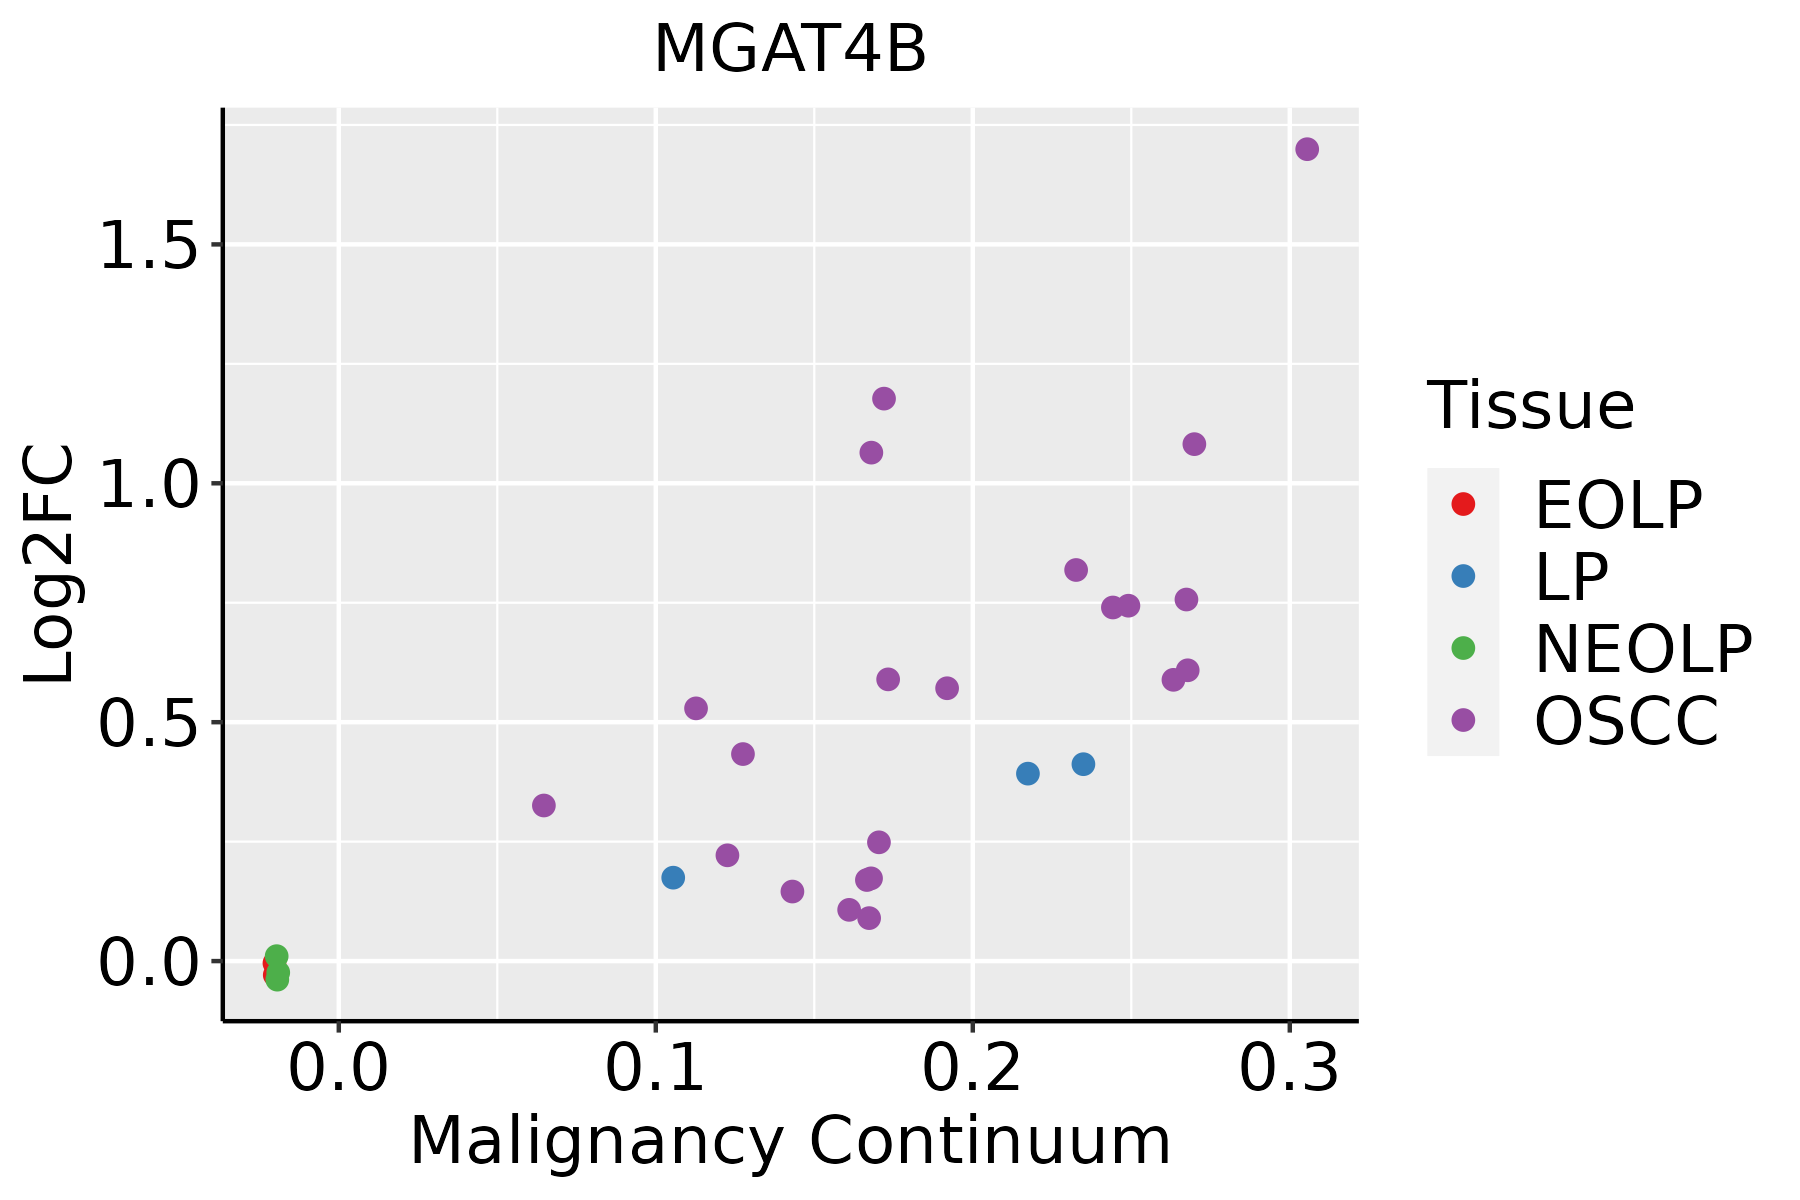 | EOLP: Erosive Oral lichen planus |
| LP: leukoplakia | ||
| NEOLP: Non-erosive oral lichen planus | ||
| OSCC: Oral squamous cell carcinoma | ||
| Prostate | 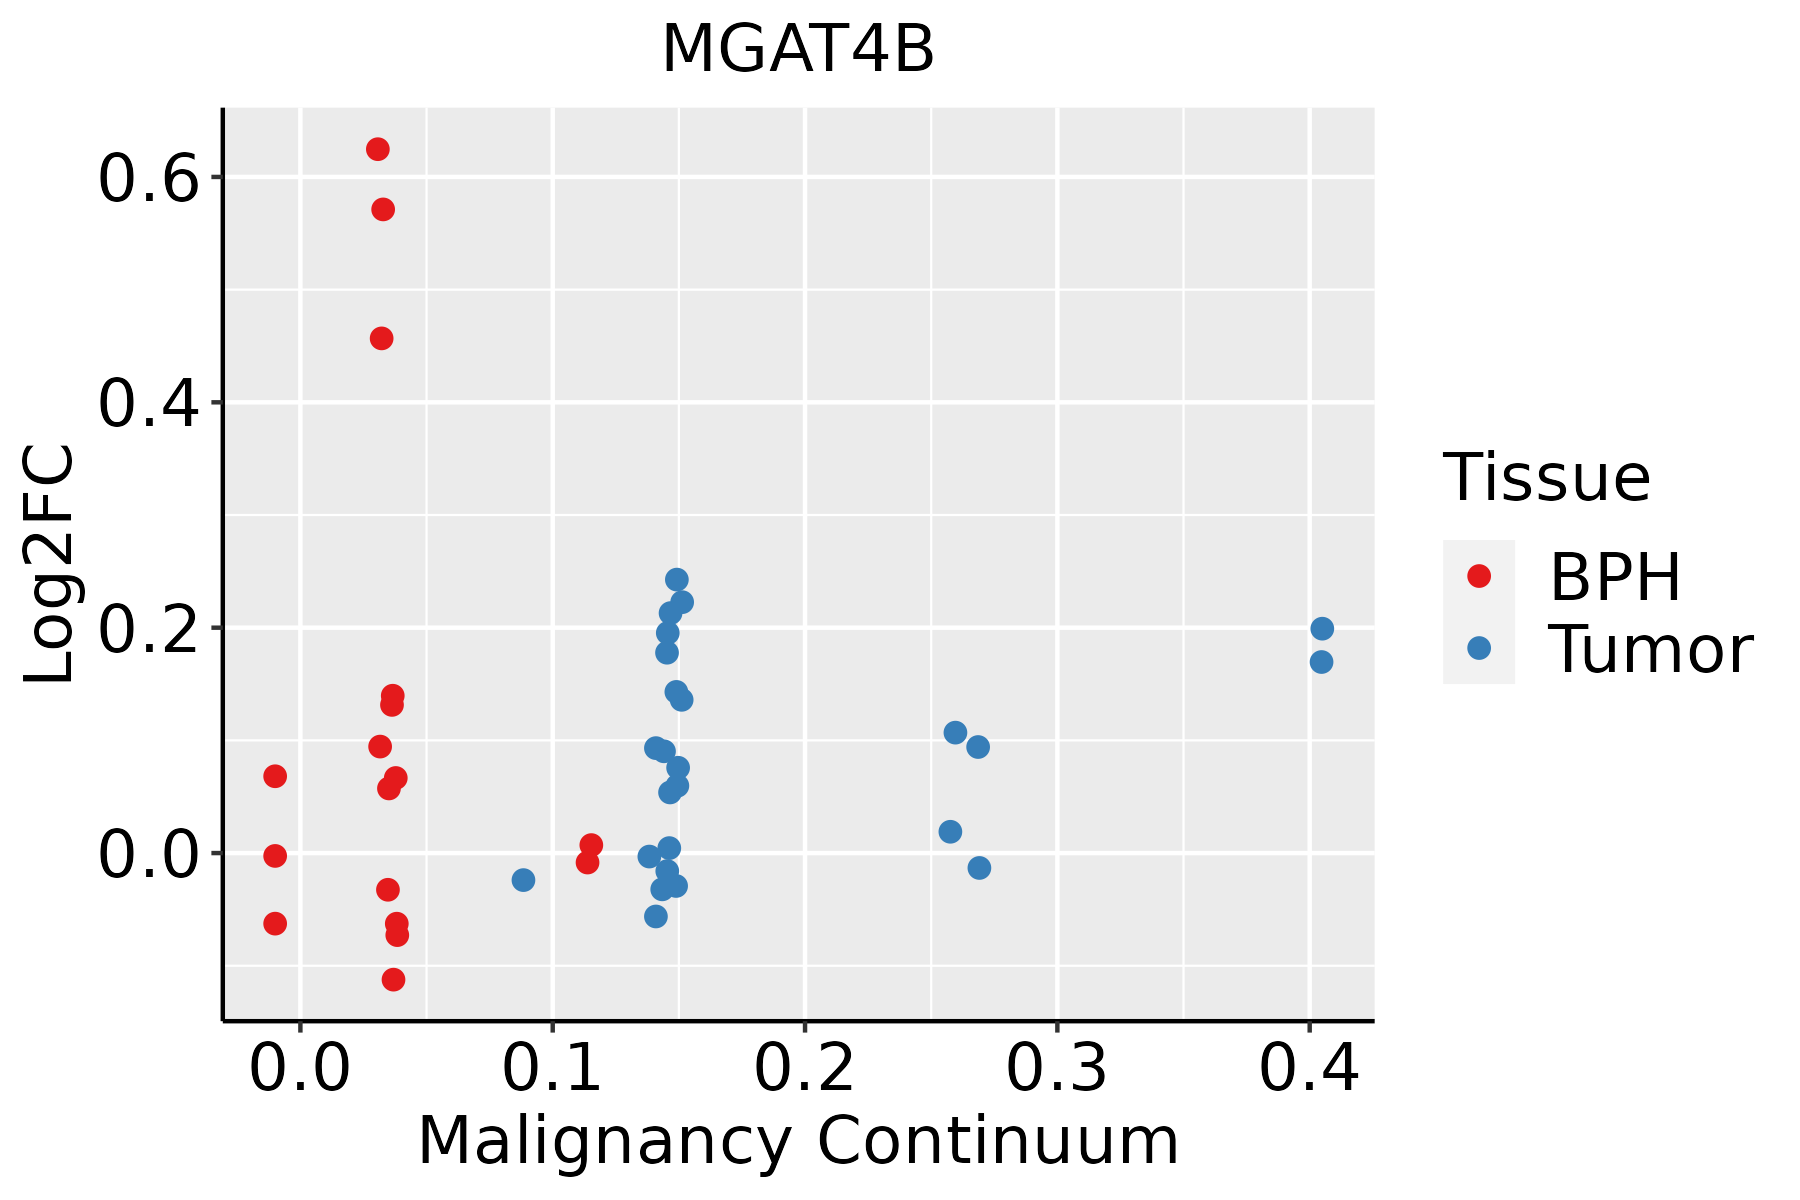 | BPH: Benign Prostatic Hyperplasia |
| Thyroid |  | ATC: Anaplastic thyroid cancer |
| HT: Hashimoto's thyroiditis | ||
| PTC: Papillary thyroid cancer |
| ∗log2FC in expression of this searched gene in stem-like cells from each diseased tissue sample relative to stem-like cells in normal samples in each tissue plotted against the malignancy continuum. Samples are colored based on if they are from different disease stage. |
Top |
Malignant transformation related pathway analysis |
| Find out the enriched GO biological processes and KEGG pathways involved in transition from healthy to precancer to cancer |
| Tissue | Disease Stage | Enriched GO biological Processes |
| Colorectum | AD |  |
| Colorectum | SER |  |
| Colorectum | MSS |  |
| Colorectum | MSI-H |  |
| Colorectum | FAP |  |
| ∗Top 15 enriched GO BP terms are showed in the bar plot of each disease state in each tissue. Each row represents a significant GO biological process which is colored according to the -log10(p.adjust). |
| Page: 1 2 3 4 5 6 7 8 9 |
| GO ID | Tissue | Disease Stage | Description | Gene Ratio | Bg Ratio | pvalue | p.adjust | Count |
| GO:0016032 | Colorectum | AD | viral process | 168/3918 | 415/18723 | 4.67e-20 | 3.66e-17 | 168 |
| GO:0019080 | Colorectum | AD | viral gene expression | 42/3918 | 94/18723 | 1.90e-07 | 8.02e-06 | 42 |
| GO:0019082 | Colorectum | AD | viral protein processing | 17/3918 | 29/18723 | 1.04e-05 | 2.40e-04 | 17 |
| GO:0006487 | Colorectum | AD | protein N-linked glycosylation | 25/3918 | 65/18723 | 9.12e-04 | 8.71e-03 | 25 |
| GO:0006486 | Colorectum | AD | protein glycosylation | 64/3918 | 226/18723 | 4.86e-03 | 3.27e-02 | 64 |
| GO:0043413 | Colorectum | AD | macromolecule glycosylation | 64/3918 | 226/18723 | 4.86e-03 | 3.27e-02 | 64 |
| GO:0070085 | Colorectum | AD | glycosylation | 67/3918 | 240/18723 | 5.78e-03 | 3.67e-02 | 67 |
| GO:00160321 | Colorectum | SER | viral process | 118/2897 | 415/18723 | 8.36e-12 | 1.65e-09 | 118 |
| GO:00190801 | Colorectum | SER | viral gene expression | 29/2897 | 94/18723 | 1.32e-04 | 2.66e-03 | 29 |
| GO:00160322 | Colorectum | MSS | viral process | 157/3467 | 415/18723 | 7.94e-21 | 6.19e-18 | 157 |
| GO:00190802 | Colorectum | MSS | viral gene expression | 41/3467 | 94/18723 | 1.74e-08 | 9.85e-07 | 41 |
| GO:00190821 | Colorectum | MSS | viral protein processing | 17/3467 | 29/18723 | 1.81e-06 | 5.70e-05 | 17 |
| GO:00064871 | Colorectum | MSS | protein N-linked glycosylation | 23/3467 | 65/18723 | 9.47e-04 | 9.54e-03 | 23 |
| GO:00160324 | Colorectum | FAP | viral process | 114/2622 | 415/18723 | 3.00e-13 | 2.63e-10 | 114 |
| GO:00190804 | Colorectum | FAP | viral gene expression | 29/2622 | 94/18723 | 2.07e-05 | 5.05e-04 | 29 |
| GO:00190822 | Colorectum | FAP | viral protein processing | 11/2622 | 29/18723 | 1.20e-03 | 1.14e-02 | 11 |
| GO:00064861 | Colorectum | FAP | protein glycosylation | 48/2622 | 226/18723 | 1.85e-03 | 1.57e-02 | 48 |
| GO:00434131 | Colorectum | FAP | macromolecule glycosylation | 48/2622 | 226/18723 | 1.85e-03 | 1.57e-02 | 48 |
| GO:00700851 | Colorectum | FAP | glycosylation | 50/2622 | 240/18723 | 2.30e-03 | 1.85e-02 | 50 |
| GO:0009101 | Colorectum | FAP | glycoprotein biosynthetic process | 63/2622 | 317/18723 | 2.31e-03 | 1.86e-02 | 63 |
| Page: 1 2 3 4 |
| Pathway ID | Tissue | Disease Stage | Description | Gene Ratio | Bg Ratio | pvalue | p.adjust | qvalue | Count |
| hsa00510 | Colorectum | AD | N-Glycan biosynthesis | 21/2092 | 53/8465 | 1.15e-02 | 4.24e-02 | 2.71e-02 | 21 |
| hsa005101 | Colorectum | AD | N-Glycan biosynthesis | 21/2092 | 53/8465 | 1.15e-02 | 4.24e-02 | 2.71e-02 | 21 |
| hsa005102 | Colorectum | MSS | N-Glycan biosynthesis | 20/1875 | 53/8465 | 7.17e-03 | 2.83e-02 | 1.73e-02 | 20 |
| hsa00513 | Colorectum | MSS | Various types of N-glycan biosynthesis | 16/1875 | 42/8465 | 1.39e-02 | 4.53e-02 | 2.77e-02 | 16 |
| hsa005103 | Colorectum | MSS | N-Glycan biosynthesis | 20/1875 | 53/8465 | 7.17e-03 | 2.83e-02 | 1.73e-02 | 20 |
| hsa005131 | Colorectum | MSS | Various types of N-glycan biosynthesis | 16/1875 | 42/8465 | 1.39e-02 | 4.53e-02 | 2.77e-02 | 16 |
| hsa005105 | Oral cavity | OSCC | N-Glycan biosynthesis | 39/3704 | 53/8465 | 9.77e-06 | 4.36e-05 | 2.22e-05 | 39 |
| hsa005135 | Oral cavity | OSCC | Various types of N-glycan biosynthesis | 29/3704 | 42/8465 | 8.03e-04 | 2.32e-03 | 1.18e-03 | 29 |
| hsa0051012 | Oral cavity | OSCC | N-Glycan biosynthesis | 39/3704 | 53/8465 | 9.77e-06 | 4.36e-05 | 2.22e-05 | 39 |
| hsa0051312 | Oral cavity | OSCC | Various types of N-glycan biosynthesis | 29/3704 | 42/8465 | 8.03e-04 | 2.32e-03 | 1.18e-03 | 29 |
| Page: 1 |
Top |
Cell-cell communication analysis |
| Identification of potential cell-cell interactions between two cell types and their ligand-receptor pairs for different disease states |
| Ligand | Receptor | LRpair | Pathway | Tissue | Disease Stage |
| Page: 1 |
Top |
Single-cell gene regulatory network inference analysis |
| Find out the significant the regulons (TFs) and the target genes of each regulon across cell types for different disease states |
| TF | Cell Type | Tissue | Disease Stage | Target Gene | RSS | Regulon Activity |
| ∗The dot plots of a searched regulon are shown for all cell subpopulations in each disease state of each tissue based on the regulon specific score inferred using pySCENIC and by calculating the average expression. |
| Page: 1 |
Top |
Somatic mutation of malignant transformation related genes |
| Annotation of somatic variants for genes involved in malignant transformation |
| Hugo Symbol | Variant Class | Variant Classification | dbSNP RS | HGVSc | HGVSp | HGVSp Short | SWISSPROT | BIOTYPE | SIFT | PolyPhen | Tumor Sample Barcode | Tissue | Histology | Sex | Age | Stage | Therapy Types | Drugs | Outcome |
| MGAT4B | SNV | Missense_Mutation | c.1159N>T | p.His387Tyr | p.H387Y | Q9UQ53 | protein_coding | tolerated(0.14) | benign(0.047) | TCGA-AC-A23H-01 | Breast | breast invasive carcinoma | Female | >=65 | I/II | Unknown | Unknown | PD | |
| MGAT4B | SNV | Missense_Mutation | c.1621N>T | p.Arg541Cys | p.R541C | Q9UQ53 | protein_coding | deleterious(0) | benign(0.019) | TCGA-AN-A0FZ-01 | Breast | breast invasive carcinoma | Female | <65 | III/IV | Unknown | Unknown | SD | |
| MGAT4B | SNV | Missense_Mutation | c.1100G>A | p.Arg367Gln | p.R367Q | Q9UQ53 | protein_coding | tolerated(0.21) | possibly_damaging(0.784) | TCGA-D8-A1XV-01 | Breast | breast invasive carcinoma | Female | >=65 | I/II | Unknown | Unknown | SD | |
| MGAT4B | insertion | Frame_Shift_Ins | novel | c.293_294insAGCTCAACCTGGTGCTGGACGAGATCAAGAGGGCCGTGTCAGAAAGGCAGGCGCTGCGAGA | p.Asp98GlufsTer99 | p.D98Efs*99 | Q9UQ53 | protein_coding | TCGA-A2-A4S1-01 | Breast | breast invasive carcinoma | Female | >=65 | I/II | Unknown | Unknown | SD | ||
| MGAT4B | SNV | Missense_Mutation | novel | c.598G>A | p.Ala200Thr | p.A200T | Q9UQ53 | protein_coding | deleterious(0) | possibly_damaging(0.851) | TCGA-2W-A8YY-01 | Cervix | cervical & endocervical cancer | Female | <65 | I/II | Chemotherapy | cisplatin | CR |
| MGAT4B | SNV | Missense_Mutation | rs146867088 | c.1355G>A | p.Arg452His | p.R452H | Q9UQ53 | protein_coding | tolerated(0.12) | possibly_damaging(0.549) | TCGA-AA-3864-01 | Colorectum | colon adenocarcinoma | Male | >=65 | I/II | Unknown | Unknown | SD |
| MGAT4B | SNV | Missense_Mutation | rs773945740 | c.623N>T | p.Ser208Leu | p.S208L | Q9UQ53 | protein_coding | tolerated(0.21) | benign(0.022) | TCGA-AZ-4313-01 | Colorectum | colon adenocarcinoma | Female | <65 | I/II | Unknown | Unknown | SD |
| MGAT4B | SNV | Missense_Mutation | rs781520422 | c.724N>T | p.Arg242Cys | p.R242C | Q9UQ53 | protein_coding | deleterious(0.01) | possibly_damaging(0.828) | TCGA-AZ-4682-01 | Colorectum | colon adenocarcinoma | Male | <65 | I/II | Chemotherapy | camptosar | PD |
| MGAT4B | SNV | Missense_Mutation | c.731N>A | p.Arg244Gln | p.R244Q | Q9UQ53 | protein_coding | tolerated(0.05) | benign(0.207) | TCGA-CA-5255-01 | Colorectum | colon adenocarcinoma | Male | <65 | I/II | Chemotherapy | oxaliplatin | CR | |
| MGAT4B | SNV | Missense_Mutation | novel | c.1487N>G | p.Glu496Gly | p.E496G | Q9UQ53 | protein_coding | tolerated(0.07) | probably_damaging(0.979) | TCGA-CA-6717-01 | Colorectum | colon adenocarcinoma | Male | <65 | I/II | Chemotherapy | oxaliplatin | CR |
| Page: 1 2 3 4 5 6 |
Top |
Related drugs of malignant transformation related genes |
| Identification of chemicals and drugs interact with genes involved in malignant transfromation |
| (DGIdb 4.0) |
| Entrez ID | Symbol | Category | Interaction Types | Drug Claim Name | Drug Name | PMIDs |
| Page: 1 |

Copyright 2023-Present -The University of Texas Health Science Center at Houston |