
|
|||||
|
 | |
| |
| |
| |
| |
| |
|
Gene: MGA |
Gene summary for MGA |
| Gene information | Species | Human | Gene symbol | MGA | Gene ID | 23269 |
| Gene name | MAX dimerization protein MGA | |
| Gene Alias | MAD5 | |
| Cytomap | 15q15.1 | |
| Gene Type | protein-coding | GO ID | GO:0001708 | UniProtAcc | B9EGR5 |
Top |
Malignant transformation analysis |
| Identification of the aberrant gene expression in precancerous and cancerous lesions by comparing the gene expression of stem-like cells in diseased tissues with normal stem cells |
| Entrez ID | Symbol | Replicates | Species | Organ | Tissue | Adj P-value | Log2FC | Malignancy |
| 23269 | MGA | CCI_2 | Human | Cervix | CC | 6.89e-19 | 1.56e+00 | 0.5249 |
| 23269 | MGA | CCI_3 | Human | Cervix | CC | 9.22e-05 | 6.23e-01 | 0.516 |
| 23269 | MGA | LZE4T | Human | Esophagus | ESCC | 2.75e-09 | 2.77e-01 | 0.0811 |
| 23269 | MGA | LZE7T | Human | Esophagus | ESCC | 1.98e-10 | 6.15e-01 | 0.0667 |
| 23269 | MGA | LZE8T | Human | Esophagus | ESCC | 3.34e-02 | 6.30e-02 | 0.067 |
| 23269 | MGA | LZE24T | Human | Esophagus | ESCC | 1.35e-13 | 2.65e-01 | 0.0596 |
| 23269 | MGA | LZE6T | Human | Esophagus | ESCC | 4.02e-04 | 1.30e-01 | 0.0845 |
| 23269 | MGA | P1T-E | Human | Esophagus | ESCC | 9.75e-07 | 3.57e-01 | 0.0875 |
| 23269 | MGA | P2T-E | Human | Esophagus | ESCC | 1.63e-21 | 2.74e-01 | 0.1177 |
| 23269 | MGA | P4T-E | Human | Esophagus | ESCC | 4.87e-05 | 1.58e-01 | 0.1323 |
| 23269 | MGA | P5T-E | Human | Esophagus | ESCC | 2.19e-12 | 1.42e-01 | 0.1327 |
| 23269 | MGA | P8T-E | Human | Esophagus | ESCC | 1.83e-26 | 4.24e-01 | 0.0889 |
| 23269 | MGA | P9T-E | Human | Esophagus | ESCC | 2.53e-08 | 2.07e-01 | 0.1131 |
| 23269 | MGA | P10T-E | Human | Esophagus | ESCC | 1.71e-31 | 5.82e-01 | 0.116 |
| 23269 | MGA | P11T-E | Human | Esophagus | ESCC | 5.49e-07 | 2.50e-01 | 0.1426 |
| 23269 | MGA | P12T-E | Human | Esophagus | ESCC | 3.21e-20 | 3.60e-01 | 0.1122 |
| 23269 | MGA | P15T-E | Human | Esophagus | ESCC | 2.19e-19 | 4.18e-01 | 0.1149 |
| 23269 | MGA | P16T-E | Human | Esophagus | ESCC | 7.43e-17 | 2.57e-01 | 0.1153 |
| 23269 | MGA | P19T-E | Human | Esophagus | ESCC | 6.57e-03 | 1.92e-01 | 0.1662 |
| 23269 | MGA | P20T-E | Human | Esophagus | ESCC | 1.11e-09 | 1.13e-01 | 0.1124 |
| Page: 1 2 3 4 5 |
| Tissue | Expression Dynamics | Abbreviation |
| Cervix |  | CC: Cervix cancer |
| HSIL_HPV: HPV-infected high-grade squamous intraepithelial lesions | ||
| N_HPV: HPV-infected normal cervix | ||
| Esophagus |  | ESCC: Esophageal squamous cell carcinoma |
| HGIN: High-grade intraepithelial neoplasias | ||
| LGIN: Low-grade intraepithelial neoplasias | ||
| Liver | 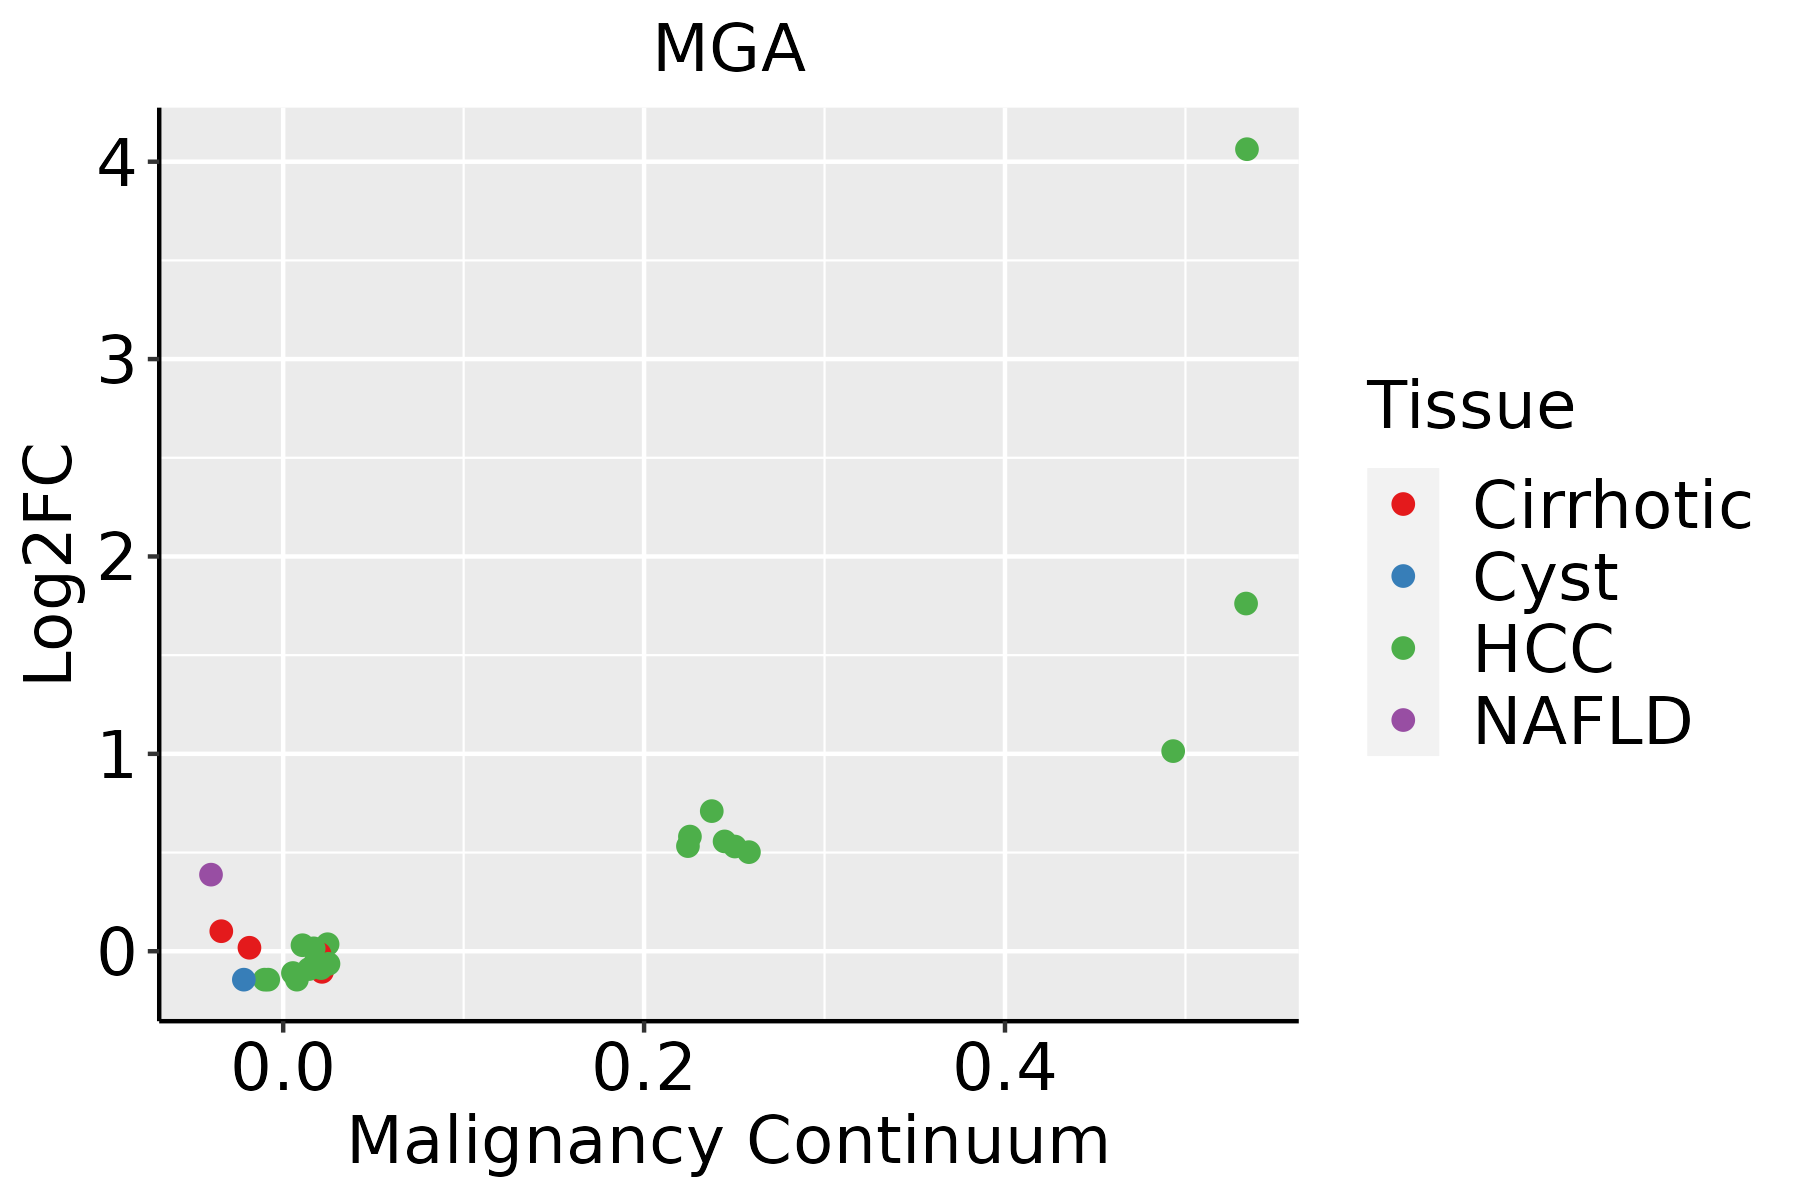 | HCC: Hepatocellular carcinoma |
| NAFLD: Non-alcoholic fatty liver disease | ||
| Prostate | 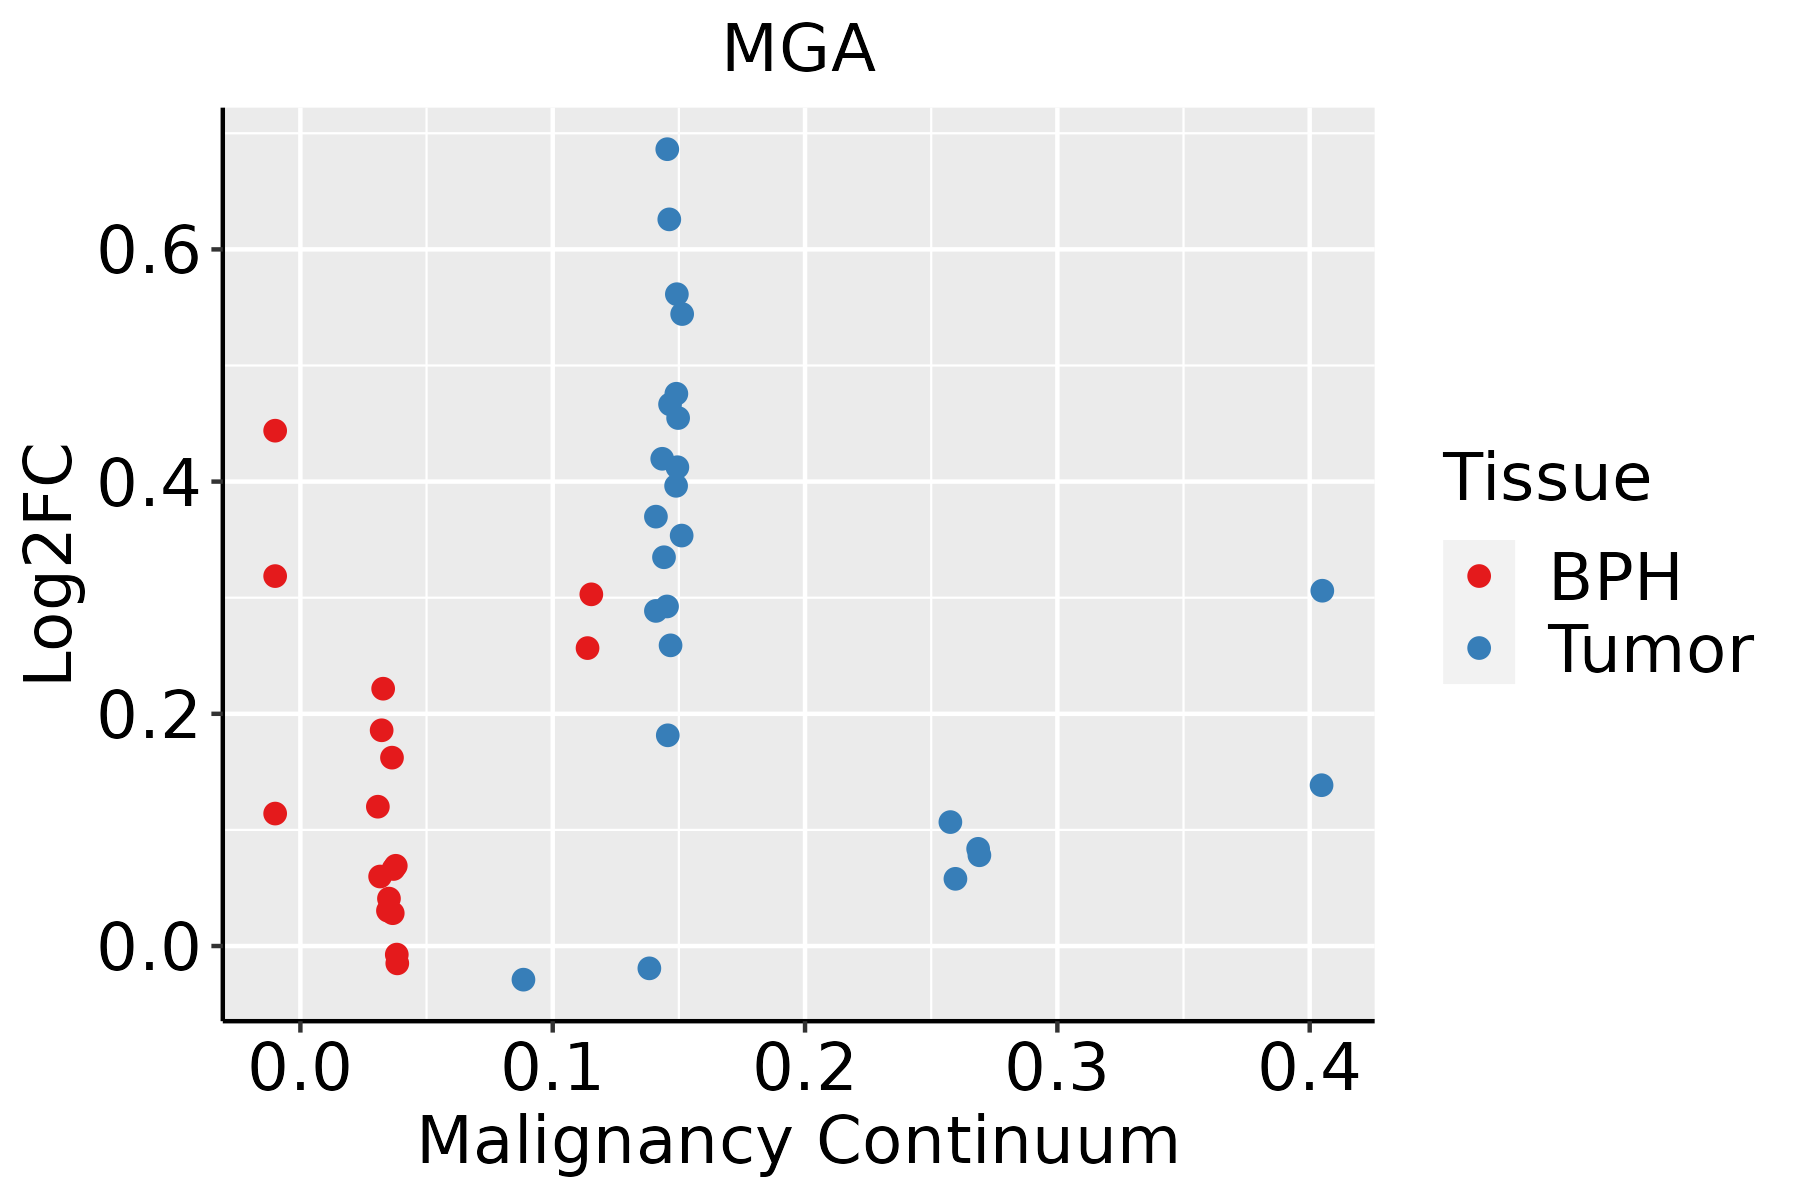 | BPH: Benign Prostatic Hyperplasia |
| Thyroid |  | ATC: Anaplastic thyroid cancer |
| HT: Hashimoto's thyroiditis | ||
| PTC: Papillary thyroid cancer |
| ∗log2FC in expression of this searched gene in stem-like cells from each diseased tissue sample relative to stem-like cells in normal samples in each tissue plotted against the malignancy continuum. Samples are colored based on if they are from different disease stage. |
Top |
Malignant transformation related pathway analysis |
| Find out the enriched GO biological processes and KEGG pathways involved in transition from healthy to precancer to cancer |
| Tissue | Disease Stage | Enriched GO biological Processes |
| Colorectum | AD |  |
| Colorectum | SER |  |
| Colorectum | MSS |  |
| Colorectum | MSI-H |  |
| Colorectum | FAP |  |
| ∗Top 15 enriched GO BP terms are showed in the bar plot of each disease state in each tissue. Each row represents a significant GO biological process which is colored according to the -log10(p.adjust). |
| Page: 1 2 3 4 5 6 7 8 9 |
| GO ID | Tissue | Disease Stage | Description | Gene Ratio | Bg Ratio | pvalue | p.adjust | Count |
| GO:00075688 | Breast | Precancer | aging | 41/1080 | 339/18723 | 5.95e-06 | 1.71e-04 | 41 |
| GO:00224119 | Breast | Precancer | cellular component disassembly | 44/1080 | 443/18723 | 3.17e-04 | 4.51e-03 | 44 |
| GO:00329865 | Breast | Precancer | protein-DNA complex disassembly | 6/1080 | 20/18723 | 6.99e-04 | 8.43e-03 | 6 |
| GO:00075694 | Breast | Precancer | cell aging | 17/1080 | 132/18723 | 1.55e-03 | 1.59e-02 | 17 |
| GO:00903423 | Breast | Precancer | regulation of cell aging | 10/1080 | 61/18723 | 2.40e-03 | 2.21e-02 | 10 |
| GO:000756813 | Breast | IDC | aging | 52/1434 | 339/18723 | 1.14e-06 | 5.10e-05 | 52 |
| GO:00096157 | Breast | IDC | response to virus | 47/1434 | 367/18723 | 3.53e-04 | 5.16e-03 | 47 |
| GO:003298612 | Breast | IDC | protein-DNA complex disassembly | 6/1434 | 20/18723 | 3.03e-03 | 2.60e-02 | 6 |
| GO:000756912 | Breast | IDC | cell aging | 19/1434 | 132/18723 | 5.63e-03 | 4.08e-02 | 19 |
| GO:00903421 | Breast | IDC | regulation of cell aging | 11/1434 | 61/18723 | 6.10e-03 | 4.36e-02 | 11 |
| GO:000756823 | Breast | DCIS | aging | 50/1390 | 339/18723 | 2.38e-06 | 8.46e-05 | 50 |
| GO:000961512 | Breast | DCIS | response to virus | 45/1390 | 367/18723 | 6.16e-04 | 7.82e-03 | 45 |
| GO:003298621 | Breast | DCIS | protein-DNA complex disassembly | 6/1390 | 20/18723 | 2.59e-03 | 2.30e-02 | 6 |
| GO:000756921 | Breast | DCIS | cell aging | 19/1390 | 132/18723 | 4.03e-03 | 3.20e-02 | 19 |
| GO:00903422 | Breast | DCIS | regulation of cell aging | 11/1390 | 61/18723 | 4.84e-03 | 3.67e-02 | 11 |
| GO:002241113 | Breast | DCIS | cellular component disassembly | 48/1390 | 443/18723 | 5.35e-03 | 3.92e-02 | 48 |
| GO:001603210 | Cervix | CC | viral process | 109/2311 | 415/18723 | 5.40e-15 | 6.46e-12 | 109 |
| GO:00513469 | Cervix | CC | negative regulation of hydrolase activity | 81/2311 | 379/18723 | 4.27e-07 | 1.67e-05 | 81 |
| GO:004593610 | Cervix | CC | negative regulation of phosphate metabolic process | 88/2311 | 441/18723 | 2.92e-06 | 8.27e-05 | 88 |
| GO:001056310 | Cervix | CC | negative regulation of phosphorus metabolic process | 88/2311 | 442/18723 | 3.21e-06 | 8.77e-05 | 88 |
| Page: 1 2 3 4 5 6 7 8 9 10 11 12 13 14 15 16 17 18 19 20 21 22 23 24 25 26 27 28 29 30 31 32 33 34 35 36 37 38 39 40 41 42 43 44 45 46 47 48 49 50 51 52 53 54 55 56 57 58 59 60 61 62 63 64 65 |
| Pathway ID | Tissue | Disease Stage | Description | Gene Ratio | Bg Ratio | pvalue | p.adjust | qvalue | Count |
| Page: 1 |
Top |
Cell-cell communication analysis |
| Identification of potential cell-cell interactions between two cell types and their ligand-receptor pairs for different disease states |
| Ligand | Receptor | LRpair | Pathway | Tissue | Disease Stage |
| Page: 1 |
Top |
Single-cell gene regulatory network inference analysis |
| Find out the significant the regulons (TFs) and the target genes of each regulon across cell types for different disease states |
| TF | Cell Type | Tissue | Disease Stage | Target Gene | RSS | Regulon Activity |
| MGA | CD8TEFF | Breast | ADJ | NUP107,TUBGCP2,HIST2H2AC, etc. | 1.77e-01 |  |
| MGA | CD8TEXINT | Breast | DCIS | NUP107,TUBGCP2,HIST2H2AC, etc. | 1.50e-01 |  |
| MGA | CD8TEFF | Breast | DCIS | NUP107,TUBGCP2,HIST2H2AC, etc. | 1.27e-01 | |
| MGA | CD8TEFF | Breast | Healthy | NUP107,TUBGCP2,HIST2H2AC, etc. | 6.35e-02 |  |
| MGA | CD8TEFF | Breast | IDC | NUP107,TUBGCP2,HIST2H2AC, etc. | 9.26e-02 |  |
| MGA | TH1 | Colorectum | MSI-H | PARP9,WDFY1,MRPS9, etc. | 2.42e-02 |  |
| MGA | PERI | Colorectum | MSI-H | ERO1B,POLG,RFC3, etc. | 2.53e-01 | |
| MGA | CD8TEFF | Lung | AAH | HEXIM1,ST8SIA6,PTPRA, etc. | 1.97e-01 |  |
| MGA | NEUT | Lung | AIS | AC010260.1,LNX2,AP002762.2, etc. | 1.80e-02 |  |
| MGA | CD8TEXP | Oral cavity | EOLP | TYW1B,MBNL3,ZNF266, etc. | 1.80e-01 |  |
| ∗The dot plots of a searched regulon are shown for all cell subpopulations in each disease state of each tissue based on the regulon specific score inferred using pySCENIC and by calculating the average expression. |
| Page: 1 2 |
Top |
Somatic mutation of malignant transformation related genes |
| Annotation of somatic variants for genes involved in malignant transformation |
| Hugo Symbol | Variant Class | Variant Classification | dbSNP RS | HGVSc | HGVSp | HGVSp Short | SWISSPROT | BIOTYPE | SIFT | PolyPhen | Tumor Sample Barcode | Tissue | Histology | Sex | Age | Stage | Therapy Types | Drugs | Outcome |
| MGA | SNV | Missense_Mutation | c.7534N>G | p.Lys2512Glu | p.K2512E | Q8IWI9 | protein_coding | deleterious(0) | probably_damaging(0.995) | TCGA-A1-A0SE-01 | Breast | breast invasive carcinoma | Female | <65 | I/II | Unknown | Unknown | SD | |
| MGA | SNV | Missense_Mutation | rs367727094 | c.4180N>T | p.Arg1394Cys | p.R1394C | Q8IWI9 | protein_coding | deleterious(0) | probably_damaging(0.996) | TCGA-A1-A0SN-01 | Breast | breast invasive carcinoma | Female | <65 | I/II | Chemotherapy | ac | SD |
| MGA | SNV | Missense_Mutation | novel | c.7933T>G | p.Leu2645Val | p.L2645V | Q8IWI9 | protein_coding | tolerated(0.16) | possibly_damaging(0.76) | TCGA-A7-A5ZX-01 | Breast | breast invasive carcinoma | Female | <65 | III/IV | Chemotherapy | doxorubicin | CR |
| MGA | SNV | Missense_Mutation | c.1279C>G | p.Leu427Val | p.L427V | Q8IWI9 | protein_coding | deleterious(0.03) | probably_damaging(0.94) | TCGA-A8-A082-01 | Breast | breast invasive carcinoma | Female | <65 | I/II | Chemotherapy | 5-fluorouracil | CR | |
| MGA | SNV | Missense_Mutation | novel | c.4252N>C | p.Asp1418His | p.D1418H | Q8IWI9 | protein_coding | deleterious(0) | probably_damaging(0.921) | TCGA-A8-A08L-01 | Breast | breast invasive carcinoma | Female | >=65 | III/IV | Unknown | Unknown | SD |
| MGA | SNV | Missense_Mutation | rs773922303 | c.2789C>G | p.Ser930Cys | p.S930C | Q8IWI9 | protein_coding | deleterious(0) | benign(0.009) | TCGA-A8-A09I-01 | Breast | breast invasive carcinoma | Female | >=65 | I/II | Hormone Therapy | anastrozole | SD |
| MGA | SNV | Missense_Mutation | c.7384C>G | p.Leu2462Val | p.L2462V | Q8IWI9 | protein_coding | deleterious(0.04) | benign(0.366) | TCGA-AC-A23H-01 | Breast | breast invasive carcinoma | Female | >=65 | I/II | Unknown | Unknown | PD | |
| MGA | SNV | Missense_Mutation | novel | c.1663G>A | p.Asp555Asn | p.D555N | Q8IWI9 | protein_coding | tolerated_low_confidence(0.62) | benign(0.046) | TCGA-AC-A5XS-01 | Breast | breast invasive carcinoma | Female | >=65 | I/II | Hormone Therapy | femara | SD |
| MGA | SNV | Missense_Mutation | novel | c.7330G>A | p.Glu2444Lys | p.E2444K | Q8IWI9 | protein_coding | deleterious(0.04) | probably_damaging(0.98) | TCGA-AC-A5XS-01 | Breast | breast invasive carcinoma | Female | >=65 | I/II | Hormone Therapy | femara | SD |
| MGA | SNV | Missense_Mutation | novel | c.383C>A | p.Ser128Tyr | p.S128Y | Q8IWI9 | protein_coding | deleterious(0) | probably_damaging(0.988) | TCGA-AN-A046-01 | Breast | breast invasive carcinoma | Female | >=65 | I/II | Unknown | Unknown | SD |
| Page: 1 2 3 4 5 6 7 8 9 10 11 12 13 14 15 16 17 18 19 20 21 22 23 24 25 26 27 28 29 30 31 |
Top |
Related drugs of malignant transformation related genes |
| Identification of chemicals and drugs interact with genes involved in malignant transfromation |
| (DGIdb 4.0) |
| Entrez ID | Symbol | Category | Interaction Types | Drug Claim Name | Drug Name | PMIDs |
| 23269 | MGA | TRANSCRIPTION FACTOR | inhibitor | CHEMBL1561 | MIGLITOL | |
| 23269 | MGA | TRANSCRIPTION FACTOR | inhibitor | CHEMBL1566 | ACARBOSE |
| Page: 1 |

Copyright 2023-Present -The University of Texas Health Science Center at Houston |