
|
|||||
|
 | |
| |
| |
| |
| |
| |
|
Gene: MFSD8 |
Gene summary for MFSD8 |
| Gene information | Species | Human | Gene symbol | MFSD8 | Gene ID | 256471 |
| Gene name | major facilitator superfamily domain containing 8 | |
| Gene Alias | CCMD | |
| Cytomap | 4q28.2 | |
| Gene Type | protein-coding | GO ID | GO:0006807 | UniProtAcc | Q8NHS3 |
Top |
Malignant transformation analysis |
| Identification of the aberrant gene expression in precancerous and cancerous lesions by comparing the gene expression of stem-like cells in diseased tissues with normal stem cells |
| Entrez ID | Symbol | Replicates | Species | Organ | Tissue | Adj P-value | Log2FC | Malignancy |
| 256471 | MFSD8 | LZE4T | Human | Esophagus | ESCC | 2.29e-02 | 9.04e-02 | 0.0811 |
| 256471 | MFSD8 | LZE20T | Human | Esophagus | ESCC | 2.69e-04 | 1.56e-01 | 0.0662 |
| 256471 | MFSD8 | P1T-E | Human | Esophagus | ESCC | 4.53e-02 | 2.11e-01 | 0.0875 |
| 256471 | MFSD8 | P2T-E | Human | Esophagus | ESCC | 3.89e-13 | 2.13e-01 | 0.1177 |
| 256471 | MFSD8 | P4T-E | Human | Esophagus | ESCC | 1.35e-10 | 2.61e-01 | 0.1323 |
| 256471 | MFSD8 | P5T-E | Human | Esophagus | ESCC | 2.53e-04 | 5.98e-02 | 0.1327 |
| 256471 | MFSD8 | P8T-E | Human | Esophagus | ESCC | 1.24e-10 | 1.16e-01 | 0.0889 |
| 256471 | MFSD8 | P9T-E | Human | Esophagus | ESCC | 5.35e-04 | 7.06e-02 | 0.1131 |
| 256471 | MFSD8 | P10T-E | Human | Esophagus | ESCC | 4.27e-08 | 1.04e-01 | 0.116 |
| 256471 | MFSD8 | P11T-E | Human | Esophagus | ESCC | 2.21e-03 | 2.07e-01 | 0.1426 |
| 256471 | MFSD8 | P12T-E | Human | Esophagus | ESCC | 1.06e-30 | 6.03e-01 | 0.1122 |
| 256471 | MFSD8 | P15T-E | Human | Esophagus | ESCC | 1.81e-08 | 2.27e-01 | 0.1149 |
| 256471 | MFSD8 | P16T-E | Human | Esophagus | ESCC | 1.08e-21 | 2.08e-01 | 0.1153 |
| 256471 | MFSD8 | P20T-E | Human | Esophagus | ESCC | 8.96e-10 | 1.22e-01 | 0.1124 |
| 256471 | MFSD8 | P21T-E | Human | Esophagus | ESCC | 5.98e-14 | 8.82e-02 | 0.1617 |
| 256471 | MFSD8 | P22T-E | Human | Esophagus | ESCC | 2.09e-09 | 1.79e-01 | 0.1236 |
| 256471 | MFSD8 | P23T-E | Human | Esophagus | ESCC | 4.23e-05 | 1.18e-01 | 0.108 |
| 256471 | MFSD8 | P24T-E | Human | Esophagus | ESCC | 9.66e-08 | 8.90e-02 | 0.1287 |
| 256471 | MFSD8 | P26T-E | Human | Esophagus | ESCC | 2.28e-10 | 1.96e-01 | 0.1276 |
| 256471 | MFSD8 | P27T-E | Human | Esophagus | ESCC | 2.81e-08 | 1.68e-01 | 0.1055 |
| Page: 1 2 3 |
| Tissue | Expression Dynamics | Abbreviation |
| Esophagus | 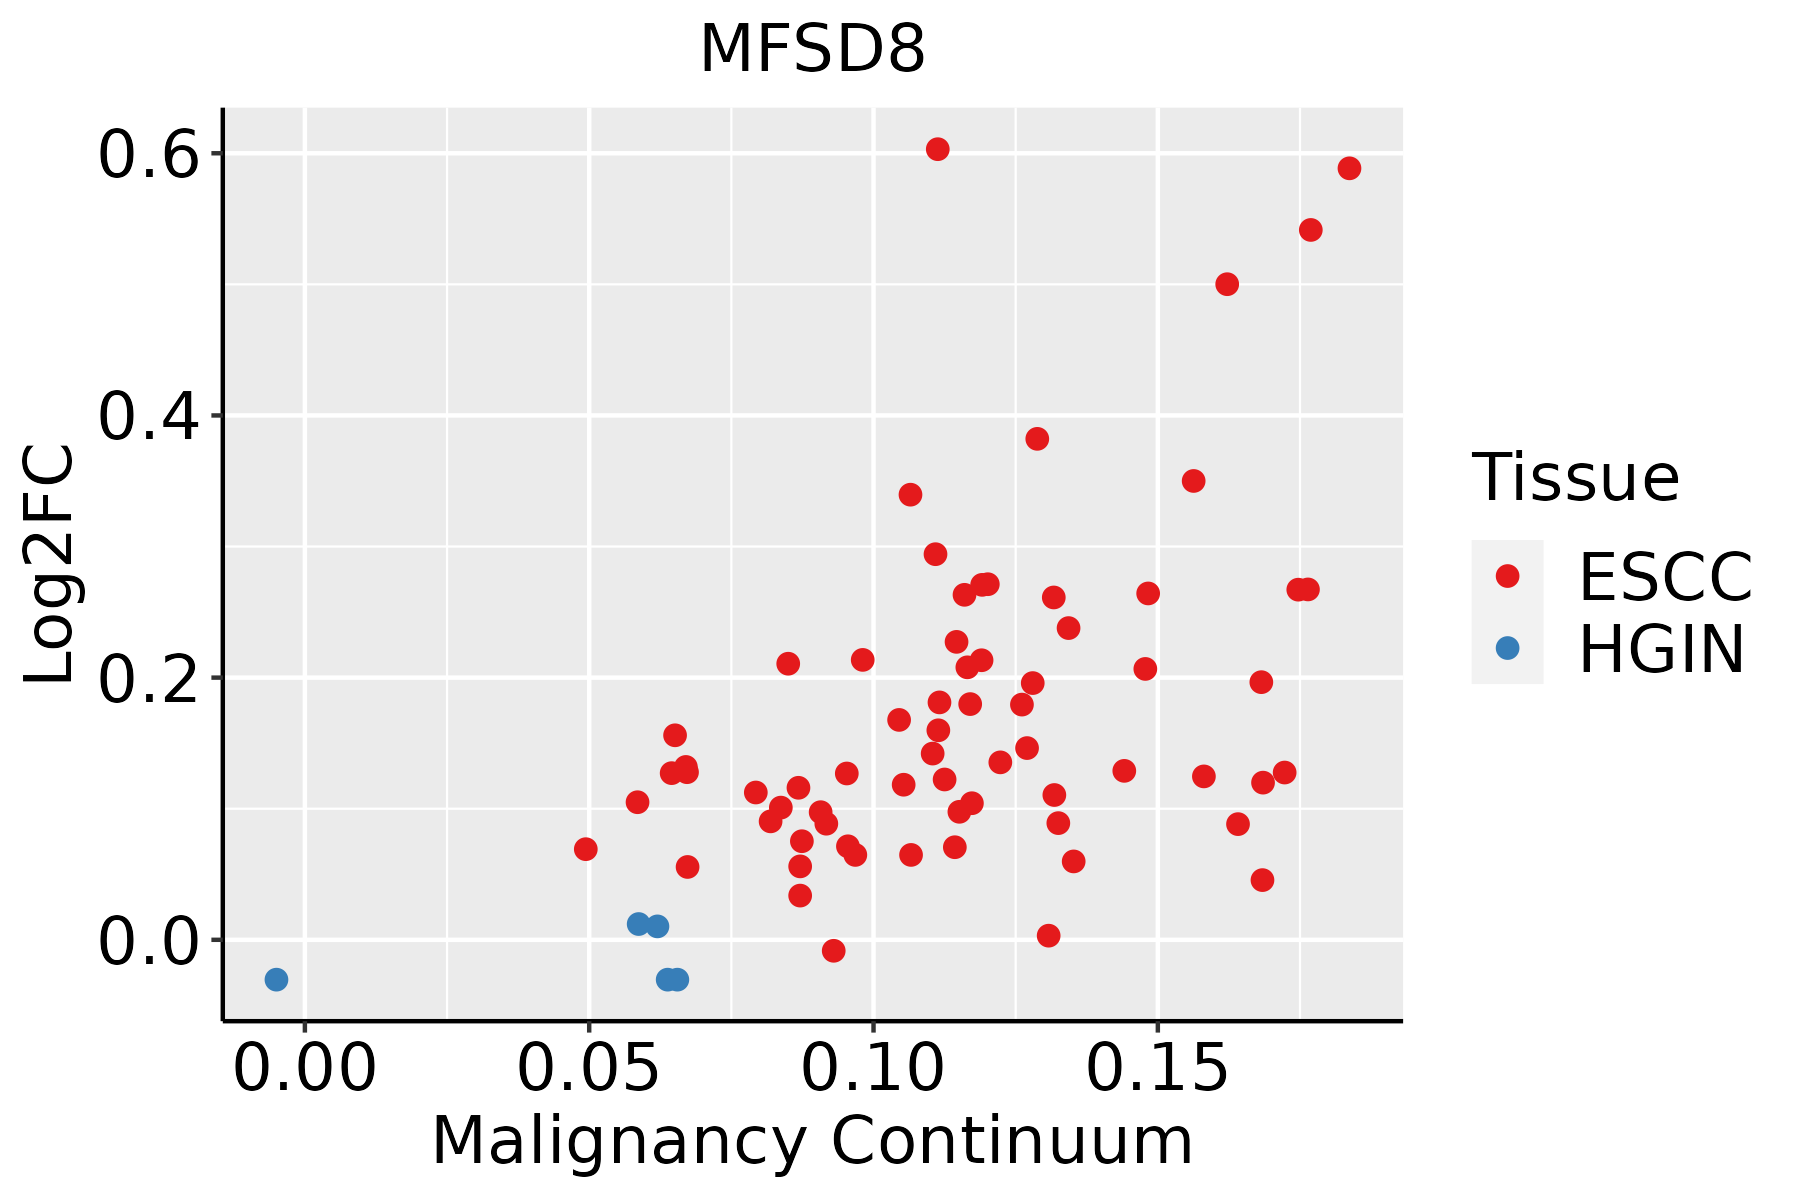 | ESCC: Esophageal squamous cell carcinoma |
| HGIN: High-grade intraepithelial neoplasias | ||
| LGIN: Low-grade intraepithelial neoplasias |
| ∗log2FC in expression of this searched gene in stem-like cells from each diseased tissue sample relative to stem-like cells in normal samples in each tissue plotted against the malignancy continuum. Samples are colored based on if they are from different disease stage. |
Top |
Malignant transformation related pathway analysis |
| Find out the enriched GO biological processes and KEGG pathways involved in transition from healthy to precancer to cancer |
| Tissue | Disease Stage | Enriched GO biological Processes |
| Colorectum | AD |  |
| Colorectum | SER |  |
| Colorectum | MSS |  |
| Colorectum | MSI-H |  |
| Colorectum | FAP |  |
| ∗Top 15 enriched GO BP terms are showed in the bar plot of each disease state in each tissue. Each row represents a significant GO biological process which is colored according to the -log10(p.adjust). |
| Page: 1 2 3 4 5 6 7 8 9 |
| GO ID | Tissue | Disease Stage | Description | Gene Ratio | Bg Ratio | pvalue | p.adjust | Count |
| GO:0042176111 | Esophagus | ESCC | regulation of protein catabolic process | 280/8552 | 391/18723 | 8.65e-26 | 2.39e-23 | 280 |
| GO:001623617 | Esophagus | ESCC | macroautophagy | 216/8552 | 291/18723 | 1.94e-23 | 4.57e-21 | 216 |
| GO:0022411111 | Esophagus | ESCC | cellular component disassembly | 305/8552 | 443/18723 | 1.94e-23 | 4.57e-21 | 305 |
| GO:1903362111 | Esophagus | ESCC | regulation of cellular protein catabolic process | 188/8552 | 255/18723 | 5.12e-20 | 6.62e-18 | 188 |
| GO:001050617 | Esophagus | ESCC | regulation of autophagy | 220/8552 | 317/18723 | 6.72e-18 | 6.36e-16 | 220 |
| GO:000703314 | Esophagus | ESCC | vacuole organization | 127/8552 | 180/18723 | 1.04e-11 | 3.85e-10 | 127 |
| GO:003298416 | Esophagus | ESCC | protein-containing complex disassembly | 151/8552 | 224/18723 | 3.45e-11 | 1.15e-09 | 151 |
| GO:00070403 | Esophagus | ESCC | lysosome organization | 53/8552 | 74/18723 | 5.34e-06 | 5.57e-05 | 53 |
| GO:00801713 | Esophagus | ESCC | lytic vacuole organization | 53/8552 | 74/18723 | 5.34e-06 | 5.57e-05 | 53 |
| GO:00973523 | Esophagus | ESCC | autophagosome maturation | 31/8552 | 40/18723 | 4.04e-05 | 3.26e-04 | 31 |
| GO:00319294 | Esophagus | ESCC | TOR signaling | 79/8552 | 126/18723 | 8.57e-05 | 6.21e-04 | 79 |
| GO:00070393 | Esophagus | ESCC | protein catabolic process in the vacuole | 16/8552 | 19/18723 | 6.45e-04 | 3.43e-03 | 16 |
| GO:19051463 | Esophagus | ESCC | lysosomal protein catabolic process | 13/8552 | 15/18723 | 1.31e-03 | 6.26e-03 | 13 |
| Page: 1 |
| Pathway ID | Tissue | Disease Stage | Description | Gene Ratio | Bg Ratio | pvalue | p.adjust | qvalue | Count |
| hsa0414222 | Esophagus | ESCC | Lysosome | 102/4205 | 132/8465 | 5.11e-11 | 7.13e-10 | 3.65e-10 | 102 |
| hsa0414232 | Esophagus | ESCC | Lysosome | 102/4205 | 132/8465 | 5.11e-11 | 7.13e-10 | 3.65e-10 | 102 |
| Page: 1 |
Top |
Cell-cell communication analysis |
| Identification of potential cell-cell interactions between two cell types and their ligand-receptor pairs for different disease states |
| Ligand | Receptor | LRpair | Pathway | Tissue | Disease Stage |
| Page: 1 |
Top |
Single-cell gene regulatory network inference analysis |
| Find out the significant the regulons (TFs) and the target genes of each regulon across cell types for different disease states |
| TF | Cell Type | Tissue | Disease Stage | Target Gene | RSS | Regulon Activity |
| ∗The dot plots of a searched regulon are shown for all cell subpopulations in each disease state of each tissue based on the regulon specific score inferred using pySCENIC and by calculating the average expression. |
| Page: 1 |
Top |
Somatic mutation of malignant transformation related genes |
| Annotation of somatic variants for genes involved in malignant transformation |
| Hugo Symbol | Variant Class | Variant Classification | dbSNP RS | HGVSc | HGVSp | HGVSp Short | SWISSPROT | BIOTYPE | SIFT | PolyPhen | Tumor Sample Barcode | Tissue | Histology | Sex | Age | Stage | Therapy Types | Drugs | Outcome |
| MFSD8 | SNV | Missense_Mutation | novel | c.828T>G | p.Phe276Leu | p.F276L | Q8NHS3 | protein_coding | deleterious(0) | probably_damaging(0.995) | TCGA-AN-A046-01 | Breast | breast invasive carcinoma | Female | >=65 | I/II | Unknown | Unknown | SD |
| MFSD8 | SNV | Missense_Mutation | c.1156N>T | p.Leu386Phe | p.L386F | Q8NHS3 | protein_coding | tolerated(0.69) | benign(0) | TCGA-AO-A03P-01 | Breast | breast invasive carcinoma | Female | <65 | I/II | Hormone Therapy | letrozole | PD | |
| MFSD8 | SNV | Missense_Mutation | rs778448039 | c.821N>C | p.Val274Ala | p.V274A | Q8NHS3 | protein_coding | tolerated(0.09) | benign(0.015) | TCGA-BH-A1EU-01 | Breast | breast invasive carcinoma | Female | >=65 | I/II | Unknown | Unknown | SD |
| MFSD8 | SNV | Missense_Mutation | c.1027N>A | p.Gly343Arg | p.G343R | Q8NHS3 | protein_coding | deleterious(0) | probably_damaging(0.999) | TCGA-BH-A1F0-01 | Breast | breast invasive carcinoma | Female | >=65 | I/II | Unknown | Unknown | PD | |
| MFSD8 | SNV | Missense_Mutation | c.1333C>G | p.Leu445Val | p.L445V | Q8NHS3 | protein_coding | deleterious(0.02) | possibly_damaging(0.683) | TCGA-D8-A27G-01 | Breast | breast invasive carcinoma | Female | >=65 | I/II | Unknown | Unknown | SD | |
| MFSD8 | SNV | Missense_Mutation | novel | c.1303N>A | p.Leu435Ile | p.L435I | Q8NHS3 | protein_coding | tolerated(0.06) | benign(0.006) | TCGA-E2-A1LE-01 | Breast | breast invasive carcinoma | Female | >=65 | III/IV | Chemotherapy | herceptin | PD |
| MFSD8 | deletion | Frame_Shift_Del | novel | c.1352delN | p.Gly451ValfsTer7 | p.G451Vfs*7 | Q8NHS3 | protein_coding | TCGA-D8-A27V-01 | Breast | breast invasive carcinoma | Female | <65 | I/II | Hormone Therapy | tamoxiphen | SD | ||
| MFSD8 | SNV | Missense_Mutation | rs149683848 | c.1480C>T | p.Leu494Phe | p.L494F | Q8NHS3 | protein_coding | tolerated(0.09) | benign(0.015) | TCGA-2W-A8YY-01 | Cervix | cervical & endocervical cancer | Female | <65 | I/II | Chemotherapy | cisplatin | CR |
| MFSD8 | SNV | Missense_Mutation | c.244T>C | p.Ser82Pro | p.S82P | Q8NHS3 | protein_coding | deleterious(0.01) | possibly_damaging(0.664) | TCGA-LP-A4AV-01 | Cervix | cervical & endocervical cancer | Female | <65 | I/II | Unknown | Unknown | SD | |
| MFSD8 | SNV | Missense_Mutation | novel | c.19G>C | p.Glu7Gln | p.E7Q | Q8NHS3 | protein_coding | tolerated(0.34) | benign(0.003) | TCGA-VS-A8QC-01 | Cervix | cervical & endocervical cancer | Female | <65 | I/II | Chemotherapy | paclitaxel | PD |
| Page: 1 2 3 4 5 6 7 8 |
Top |
Related drugs of malignant transformation related genes |
| Identification of chemicals and drugs interact with genes involved in malignant transfromation |
| (DGIdb 4.0) |
| Entrez ID | Symbol | Category | Interaction Types | Drug Claim Name | Drug Name | PMIDs |
| Page: 1 |

Copyright 2023-Present -The University of Texas Health Science Center at Houston |