| Tissue | Expression Dynamics | Abbreviation |
| Esophagus | 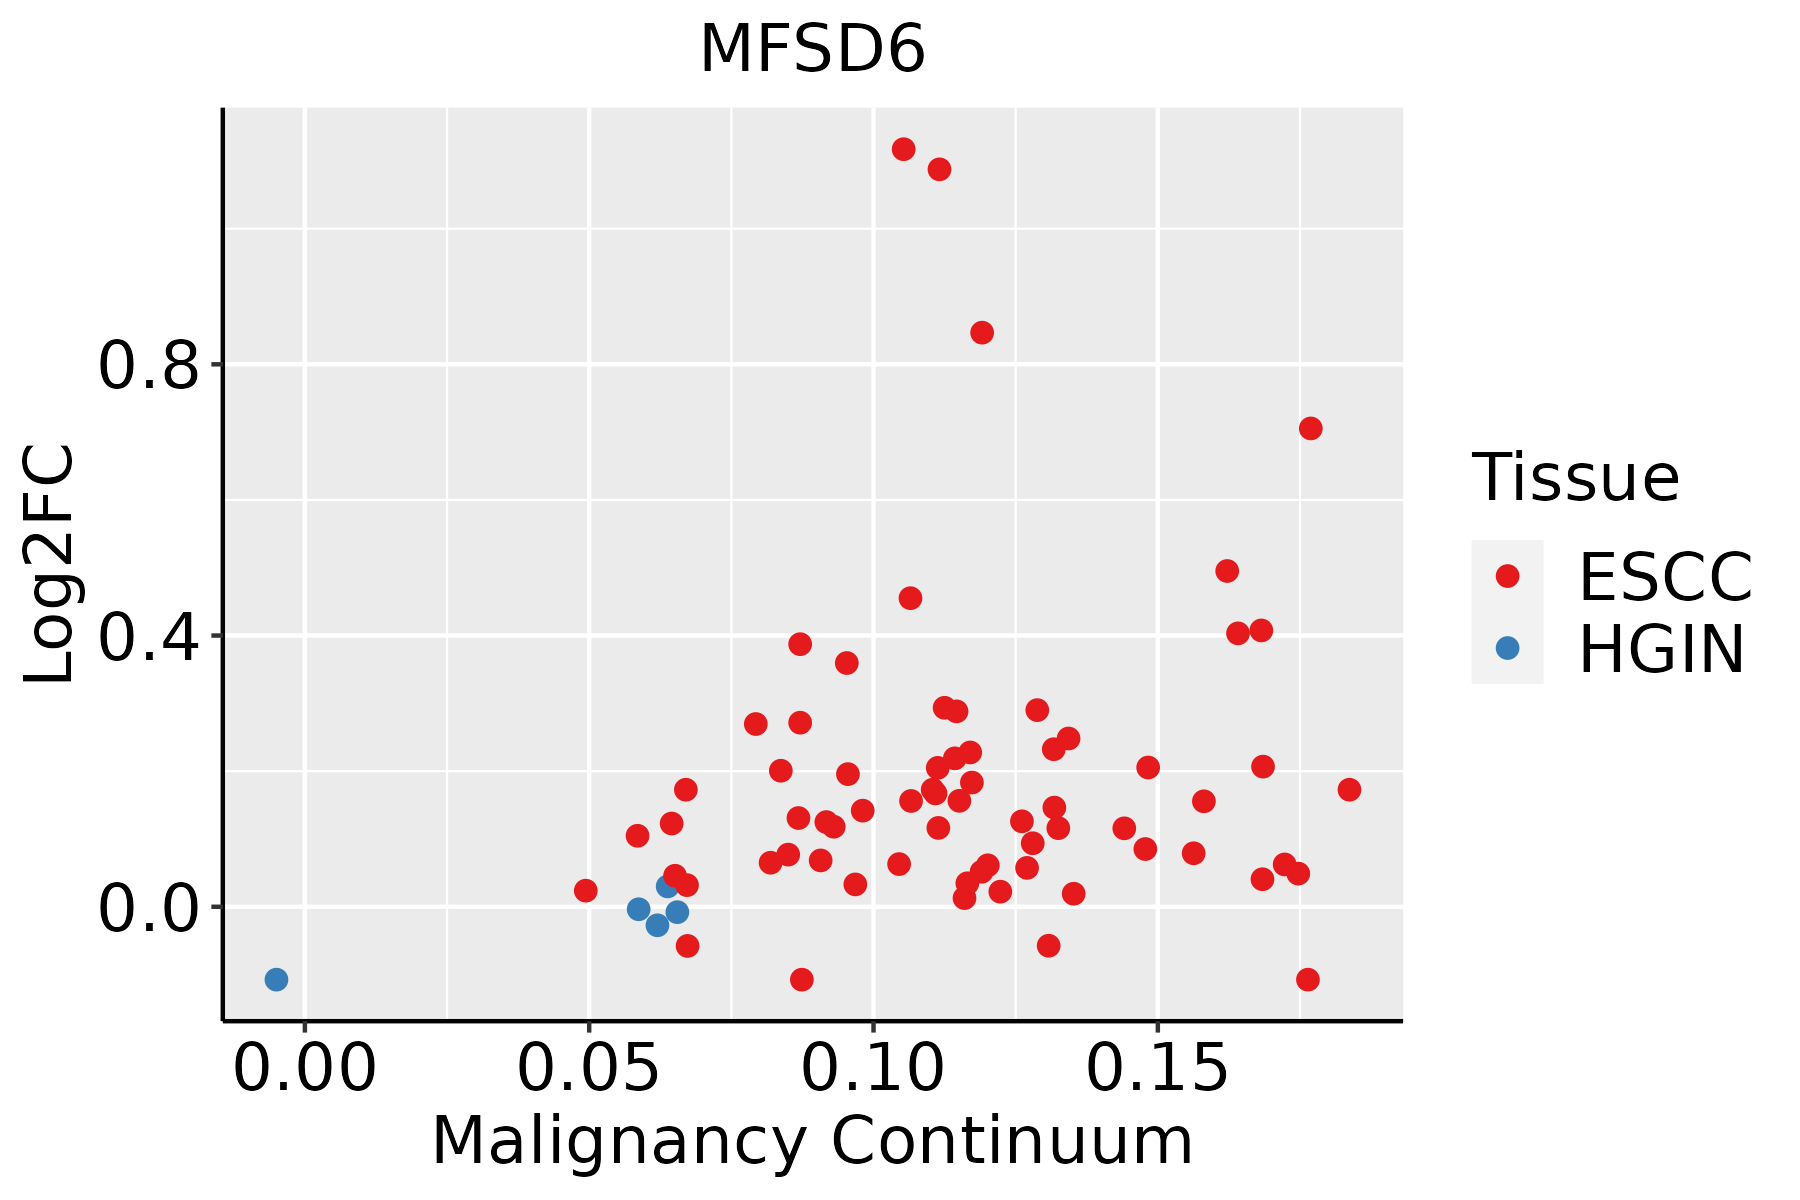 | ESCC: Esophageal squamous cell carcinoma |
| HGIN: High-grade intraepithelial neoplasias |
| LGIN: Low-grade intraepithelial neoplasias |
| Oral Cavity | 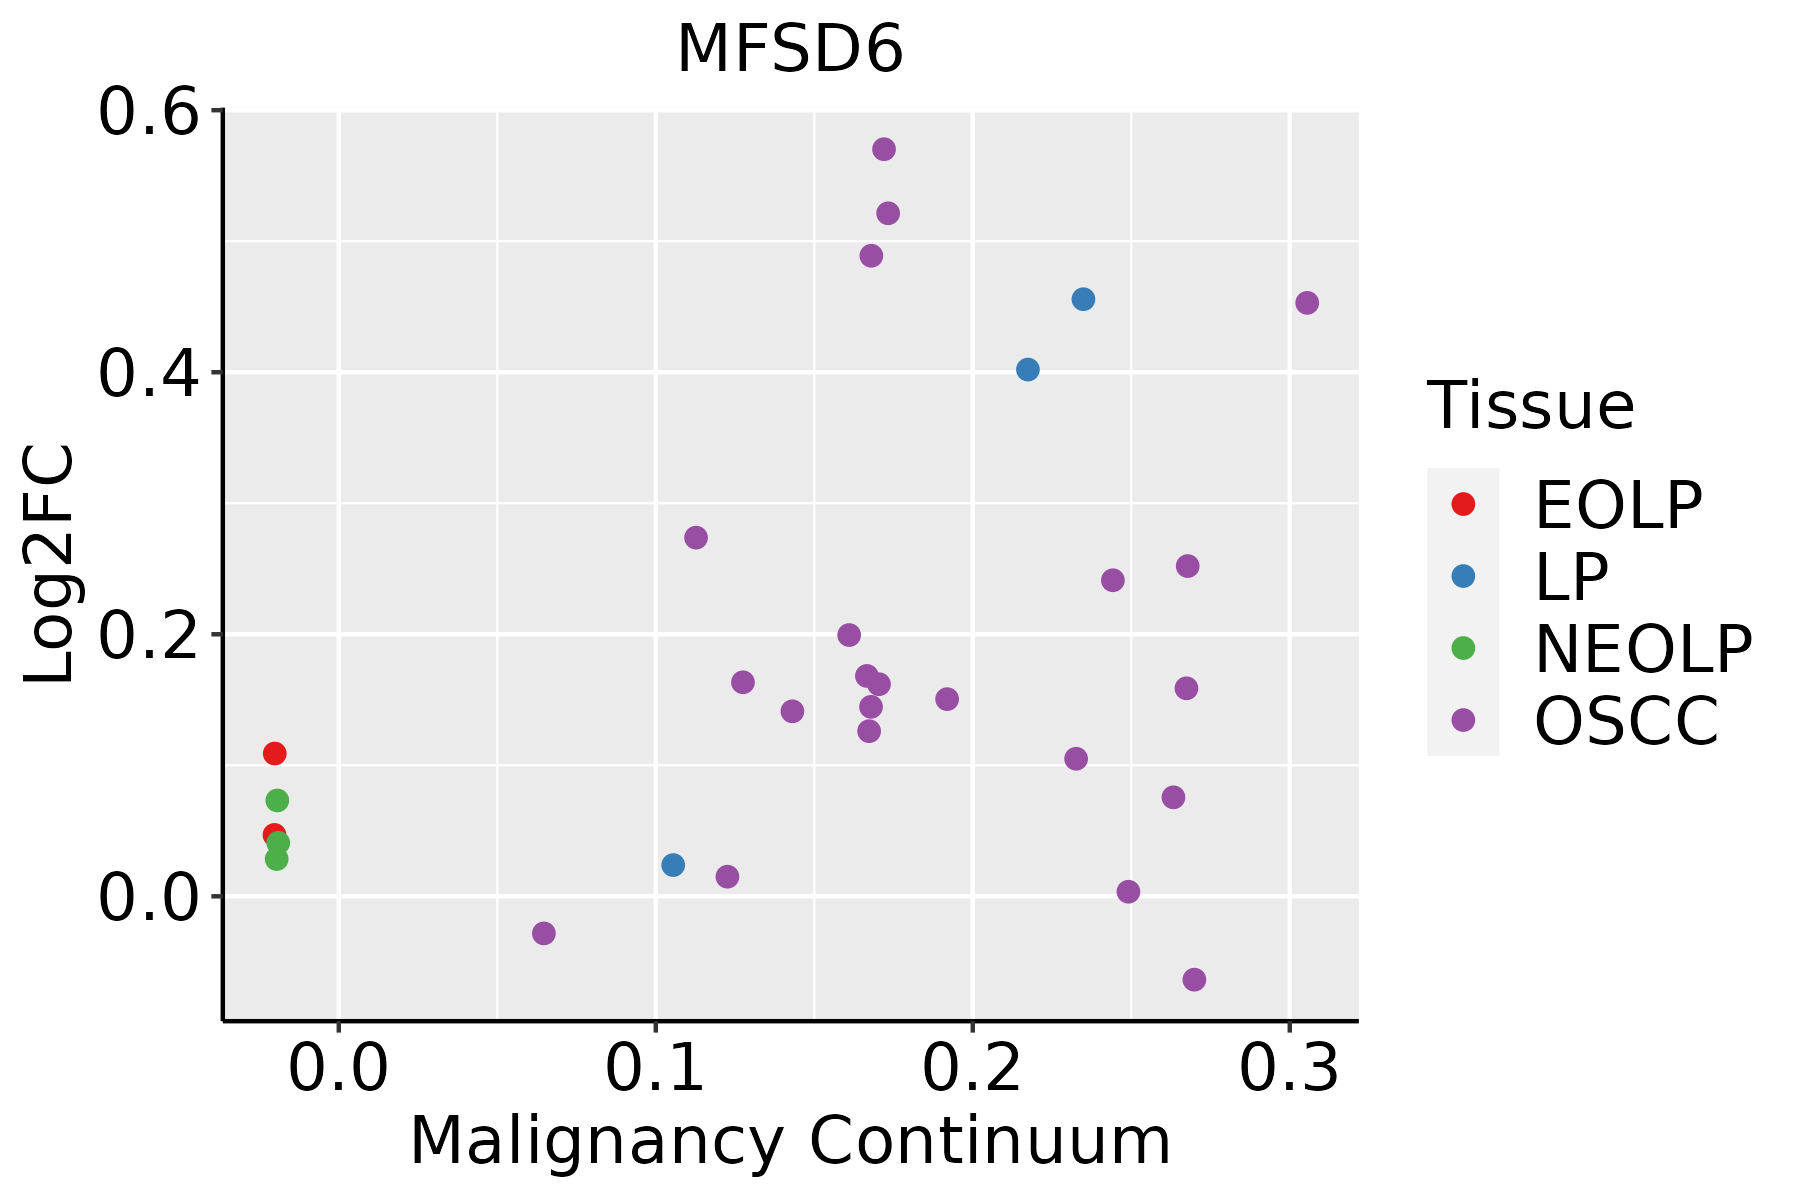 | EOLP: Erosive Oral lichen planus |
| LP: leukoplakia |
| NEOLP: Non-erosive oral lichen planus |
| OSCC: Oral squamous cell carcinoma |
| Thyroid | 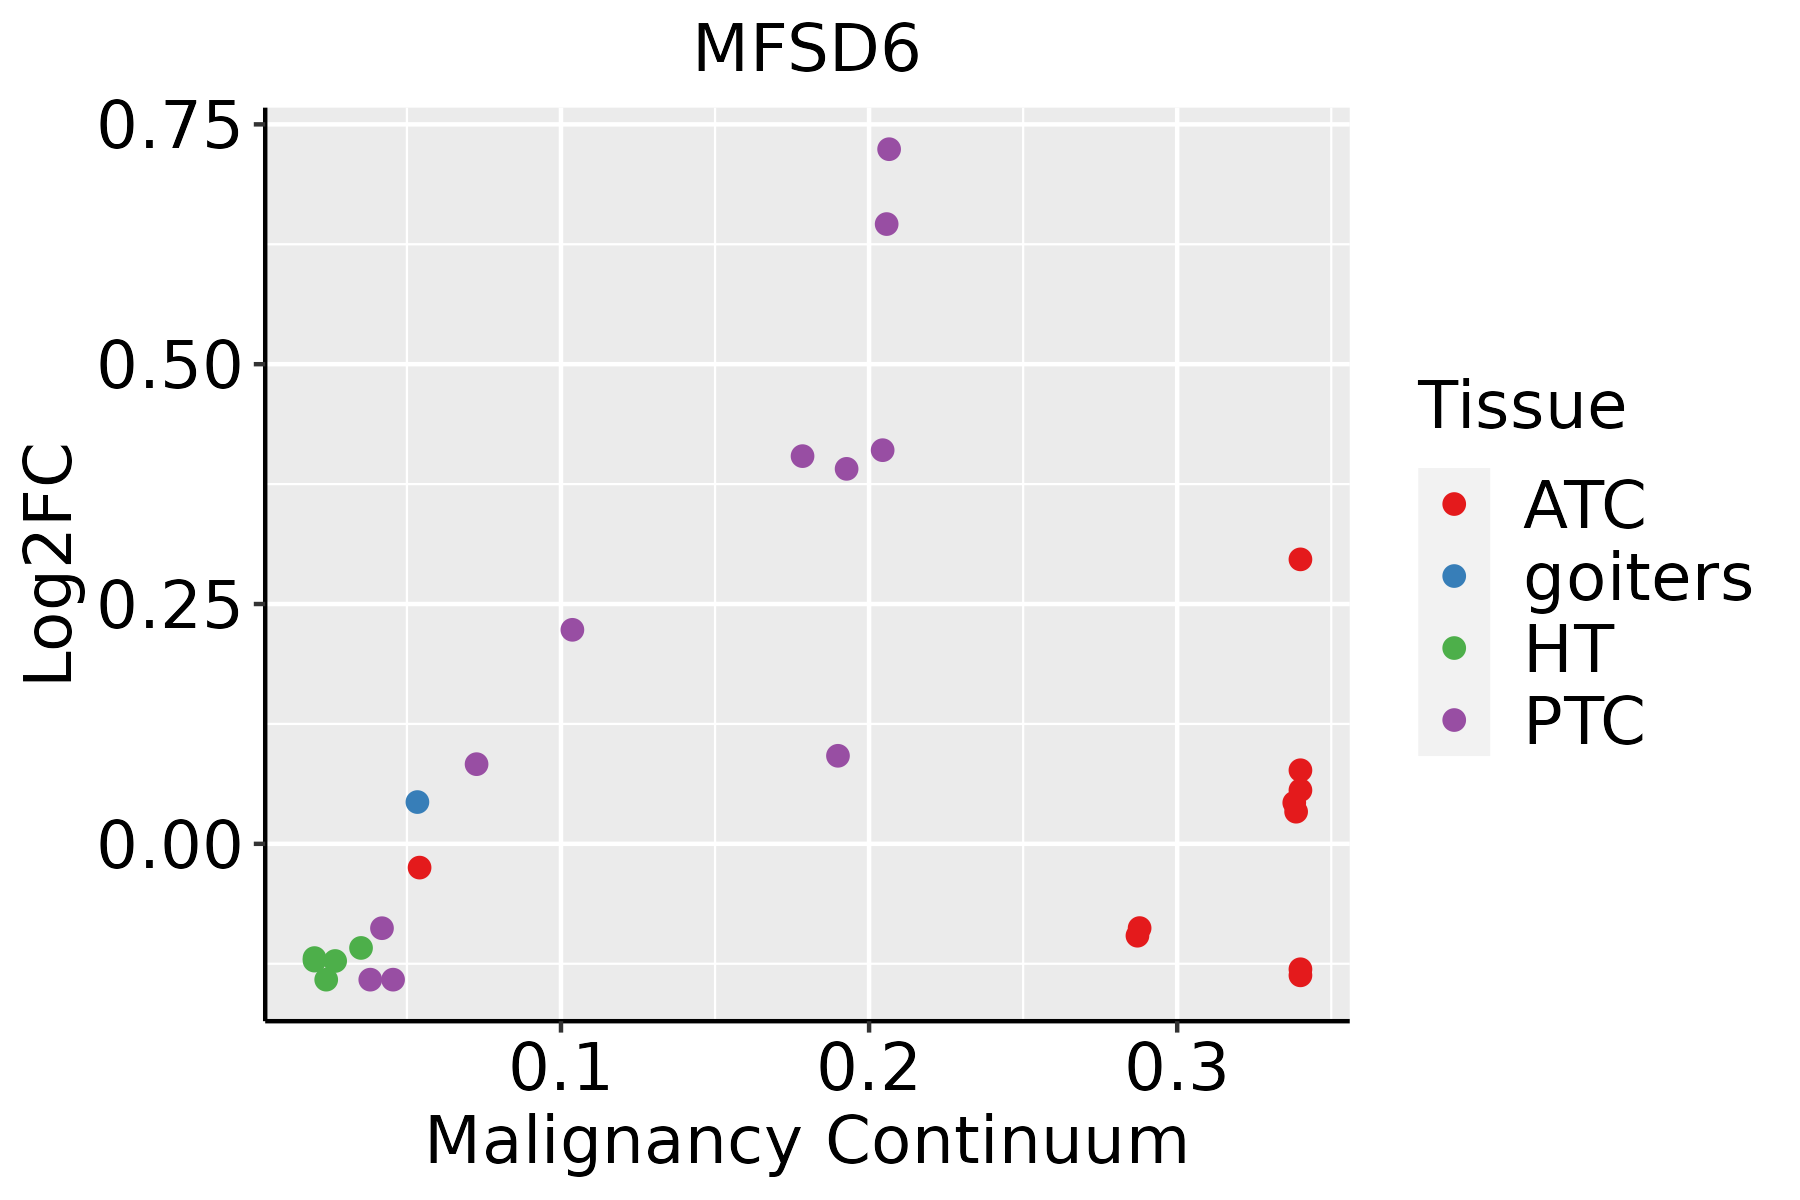 | ATC: Anaplastic thyroid cancer |
| HT: Hashimoto's thyroiditis |
| PTC: Papillary thyroid cancer |
| GO ID | Tissue | Disease Stage | Description | Gene Ratio | Bg Ratio | pvalue | p.adjust | Count |
| GO:004800220 | Esophagus | ESCC | antigen processing and presentation of peptide antigen | 44/8552 | 62/18723 | 4.81e-05 | 3.78e-04 | 44 |
| GO:000247820 | Esophagus | ESCC | antigen processing and presentation of exogenous peptide antigen | 29/8552 | 38/18723 | 1.18e-04 | 8.13e-04 | 29 |
| GO:001988225 | Esophagus | ESCC | antigen processing and presentation | 67/8552 | 106/18723 | 2.03e-04 | 1.28e-03 | 67 |
| GO:000247418 | Esophagus | ESCC | antigen processing and presentation of peptide antigen via MHC class I | 22/8552 | 28/18723 | 3.95e-04 | 2.26e-03 | 22 |
| GO:001988420 | Esophagus | ESCC | antigen processing and presentation of exogenous antigen | 33/8552 | 47/18723 | 5.77e-04 | 3.14e-03 | 33 |
| GO:001988220 | Oral cavity | OSCC | antigen processing and presentation | 65/7305 | 106/18723 | 2.69e-06 | 3.32e-05 | 65 |
| GO:004800219 | Oral cavity | OSCC | antigen processing and presentation of peptide antigen | 40/7305 | 62/18723 | 4.20e-05 | 3.63e-04 | 40 |
| GO:000247416 | Oral cavity | OSCC | antigen processing and presentation of peptide antigen via MHC class I | 21/7305 | 28/18723 | 1.19e-04 | 8.54e-04 | 21 |
| GO:000247819 | Oral cavity | OSCC | antigen processing and presentation of exogenous peptide antigen | 26/7305 | 38/18723 | 2.29e-04 | 1.49e-03 | 26 |
| GO:001988419 | Oral cavity | OSCC | antigen processing and presentation of exogenous antigen | 30/7305 | 47/18723 | 4.96e-04 | 2.92e-03 | 30 |
| GO:0019882110 | Oral cavity | LP | antigen processing and presentation | 48/4623 | 106/18723 | 2.96e-06 | 6.44e-05 | 48 |
| GO:0048002110 | Oral cavity | LP | antigen processing and presentation of peptide antigen | 30/4623 | 62/18723 | 4.46e-05 | 6.35e-04 | 30 |
| GO:0002478110 | Oral cavity | LP | antigen processing and presentation of exogenous peptide antigen | 20/4623 | 38/18723 | 1.95e-04 | 2.15e-03 | 20 |
| GO:000247417 | Oral cavity | LP | antigen processing and presentation of peptide antigen via MHC class I | 16/4623 | 28/18723 | 2.46e-04 | 2.60e-03 | 16 |
| GO:0019884110 | Oral cavity | LP | antigen processing and presentation of exogenous antigen | 22/4623 | 47/18723 | 8.02e-04 | 7.05e-03 | 22 |
| GO:0019882112 | Thyroid | PTC | antigen processing and presentation | 57/5968 | 106/18723 | 2.40e-06 | 3.17e-05 | 57 |
| GO:0002478112 | Thyroid | PTC | antigen processing and presentation of exogenous peptide antigen | 25/5968 | 38/18723 | 1.80e-05 | 1.86e-04 | 25 |
| GO:0048002112 | Thyroid | PTC | antigen processing and presentation of peptide antigen | 36/5968 | 62/18723 | 1.84e-05 | 1.89e-04 | 36 |
| GO:0019884112 | Thyroid | PTC | antigen processing and presentation of exogenous antigen | 29/5968 | 47/18723 | 2.44e-05 | 2.40e-04 | 29 |
| GO:0002474110 | Thyroid | PTC | antigen processing and presentation of peptide antigen via MHC class I | 19/5968 | 28/18723 | 9.95e-05 | 8.15e-04 | 19 |
| Hugo Symbol | Variant Class | Variant Classification | dbSNP RS | HGVSc | HGVSp | HGVSp Short | SWISSPROT | BIOTYPE | SIFT | PolyPhen | Tumor Sample Barcode | Tissue | Histology | Sex | Age | Stage | Therapy Types | Drugs | Outcome |
| MFSD6 | SNV | Missense_Mutation | | c.1153N>T | p.Val385Phe | p.V385F | Q6ZSS7 | protein_coding | deleterious(0) | probably_damaging(0.985) | TCGA-A7-A0CE-01 | Breast | breast invasive carcinoma | Female | <65 | I/II | Chemotherapy | adriamycin | SD |
| MFSD6 | SNV | Missense_Mutation | novel | c.1712N>G | p.Gln571Arg | p.Q571R | Q6ZSS7 | protein_coding | deleterious(0) | probably_damaging(0.955) | TCGA-A8-A08L-01 | Breast | breast invasive carcinoma | Female | >=65 | III/IV | Unknown | Unknown | SD |
| MFSD6 | SNV | Missense_Mutation | rs202101969 | c.1054N>A | p.Glu352Lys | p.E352K | Q6ZSS7 | protein_coding | tolerated(0.62) | benign(0.017) | TCGA-AN-A046-01 | Breast | breast invasive carcinoma | Female | >=65 | I/II | Unknown | Unknown | SD |
| MFSD6 | insertion | Nonsense_Mutation | novel | c.1155_1156insTAAATTTTACTTTACA | p.Ala386Ter | p.A386* | Q6ZSS7 | protein_coding | | | TCGA-A7-A0CE-01 | Breast | breast invasive carcinoma | Female | <65 | I/II | Chemotherapy | adriamycin | SD |
| MFSD6 | SNV | Missense_Mutation | | c.560N>G | p.Ser187Cys | p.S187C | Q6ZSS7 | protein_coding | deleterious(0.03) | benign(0.161) | TCGA-BI-A0VS-01 | Cervix | cervical & endocervical cancer | Female | <65 | I/II | Unknown | Unknown | SD |
| MFSD6 | SNV | Missense_Mutation | novel | c.2240C>G | p.Ser747Cys | p.S747C | Q6ZSS7 | protein_coding | deleterious_low_confidence(0.03) | benign(0.159) | TCGA-HM-A4S6-01 | Cervix | cervical & endocervical cancer | Female | <65 | III/IV | Chemotherapy | cisplatin | CR |
| MFSD6 | SNV | Missense_Mutation | rs760269189 | c.1090G>A | p.Glu364Lys | p.E364K | Q6ZSS7 | protein_coding | tolerated(0.11) | benign(0.318) | TCGA-AA-3947-01 | Colorectum | colon adenocarcinoma | Female | <65 | I/II | Unknown | Unknown | SD |
| MFSD6 | SNV | Missense_Mutation | novel | c.642G>T | p.Leu214Phe | p.L214F | Q6ZSS7 | protein_coding | tolerated(0.85) | benign(0) | TCGA-AA-3949-01 | Colorectum | colon adenocarcinoma | Female | >=65 | III/IV | Unknown | Unknown | SD |
| MFSD6 | SNV | Missense_Mutation | | c.586C>T | p.Arg196Cys | p.R196C | Q6ZSS7 | protein_coding | deleterious(0.01) | possibly_damaging(0.614) | TCGA-AZ-4616-01 | Colorectum | colon adenocarcinoma | Female | >=65 | III/IV | Chemotherapy | xeloda | PD |
| MFSD6 | SNV | Missense_Mutation | novel | c.2198N>A | p.Ser733Tyr | p.S733Y | Q6ZSS7 | protein_coding | deleterious_low_confidence(0.01) | benign(0.003) | TCGA-CA-6717-01 | Colorectum | colon adenocarcinoma | Male | <65 | I/II | Chemotherapy | oxaliplatin | CR |


