
|
|||||
|
 | |
| |
| |
| |
| |
| |
|
Gene: MFSD5 |
Gene summary for MFSD5 |
| Gene information | Species | Human | Gene symbol | MFSD5 | Gene ID | 84975 |
| Gene name | major facilitator superfamily domain containing 5 | |
| Gene Alias | SLC61A1 | |
| Cytomap | 12q13.13 | |
| Gene Type | protein-coding | GO ID | GO:0006810 | UniProtAcc | Q6N075 |
Top |
Malignant transformation analysis |
| Identification of the aberrant gene expression in precancerous and cancerous lesions by comparing the gene expression of stem-like cells in diseased tissues with normal stem cells |
| Entrez ID | Symbol | Replicates | Species | Organ | Tissue | Adj P-value | Log2FC | Malignancy |
| 84975 | MFSD5 | HTA11_3410_2000001011 | Human | Colorectum | AD | 4.69e-05 | 1.15e-01 | 0.0155 |
| 84975 | MFSD5 | HTA11_2487_2000001011 | Human | Colorectum | SER | 9.67e-08 | 3.16e-01 | -0.1808 |
| 84975 | MFSD5 | HTA11_1938_2000001011 | Human | Colorectum | AD | 1.82e-10 | 3.48e-01 | -0.0811 |
| 84975 | MFSD5 | HTA11_347_2000001011 | Human | Colorectum | AD | 6.40e-18 | 3.25e-01 | -0.1954 |
| 84975 | MFSD5 | HTA11_411_2000001011 | Human | Colorectum | SER | 6.15e-07 | 7.77e-01 | -0.2602 |
| 84975 | MFSD5 | HTA11_3361_2000001011 | Human | Colorectum | AD | 8.04e-10 | 4.14e-01 | -0.1207 |
| 84975 | MFSD5 | HTA11_83_2000001011 | Human | Colorectum | SER | 1.83e-04 | 2.47e-01 | -0.1526 |
| 84975 | MFSD5 | HTA11_696_2000001011 | Human | Colorectum | AD | 5.56e-08 | 2.99e-01 | -0.1464 |
| 84975 | MFSD5 | HTA11_866_2000001011 | Human | Colorectum | AD | 1.29e-07 | 2.51e-01 | -0.1001 |
| 84975 | MFSD5 | HTA11_1391_2000001011 | Human | Colorectum | AD | 6.02e-11 | 3.86e-01 | -0.059 |
| 84975 | MFSD5 | HTA11_5212_2000001011 | Human | Colorectum | AD | 7.04e-06 | 3.39e-01 | -0.2061 |
| 84975 | MFSD5 | HTA11_546_2000001011 | Human | Colorectum | AD | 1.06e-03 | 2.06e-01 | -0.0842 |
| 84975 | MFSD5 | HTA11_7862_2000001011 | Human | Colorectum | AD | 2.43e-06 | 3.15e-01 | -0.0179 |
| 84975 | MFSD5 | HTA11_866_3004761011 | Human | Colorectum | AD | 6.45e-10 | 3.27e-01 | 0.096 |
| 84975 | MFSD5 | HTA11_10711_2000001011 | Human | Colorectum | AD | 2.80e-02 | 1.31e-01 | 0.0338 |
| 84975 | MFSD5 | HTA11_7696_3000711011 | Human | Colorectum | AD | 8.32e-06 | 1.89e-01 | 0.0674 |
| 84975 | MFSD5 | HTA11_6818_2000001021 | Human | Colorectum | AD | 1.84e-08 | 2.30e-01 | 0.0588 |
| 84975 | MFSD5 | HTA11_99999970781_79442 | Human | Colorectum | MSS | 1.40e-04 | 2.27e-01 | 0.294 |
| 84975 | MFSD5 | HTA11_99999971662_82457 | Human | Colorectum | MSS | 3.82e-14 | 3.92e-01 | 0.3859 |
| 84975 | MFSD5 | HTA11_99999974143_84620 | Human | Colorectum | MSS | 3.14e-05 | 1.98e-01 | 0.3005 |
| Page: 1 2 3 4 5 6 |
| Tissue | Expression Dynamics | Abbreviation |
| Colorectum (GSE201348) |  | FAP: Familial adenomatous polyposis |
| CRC: Colorectal cancer | ||
| Colorectum (HTA11) |  | AD: Adenomas |
| SER: Sessile serrated lesions | ||
| MSI-H: Microsatellite-high colorectal cancer | ||
| MSS: Microsatellite stable colorectal cancer | ||
| Esophagus | 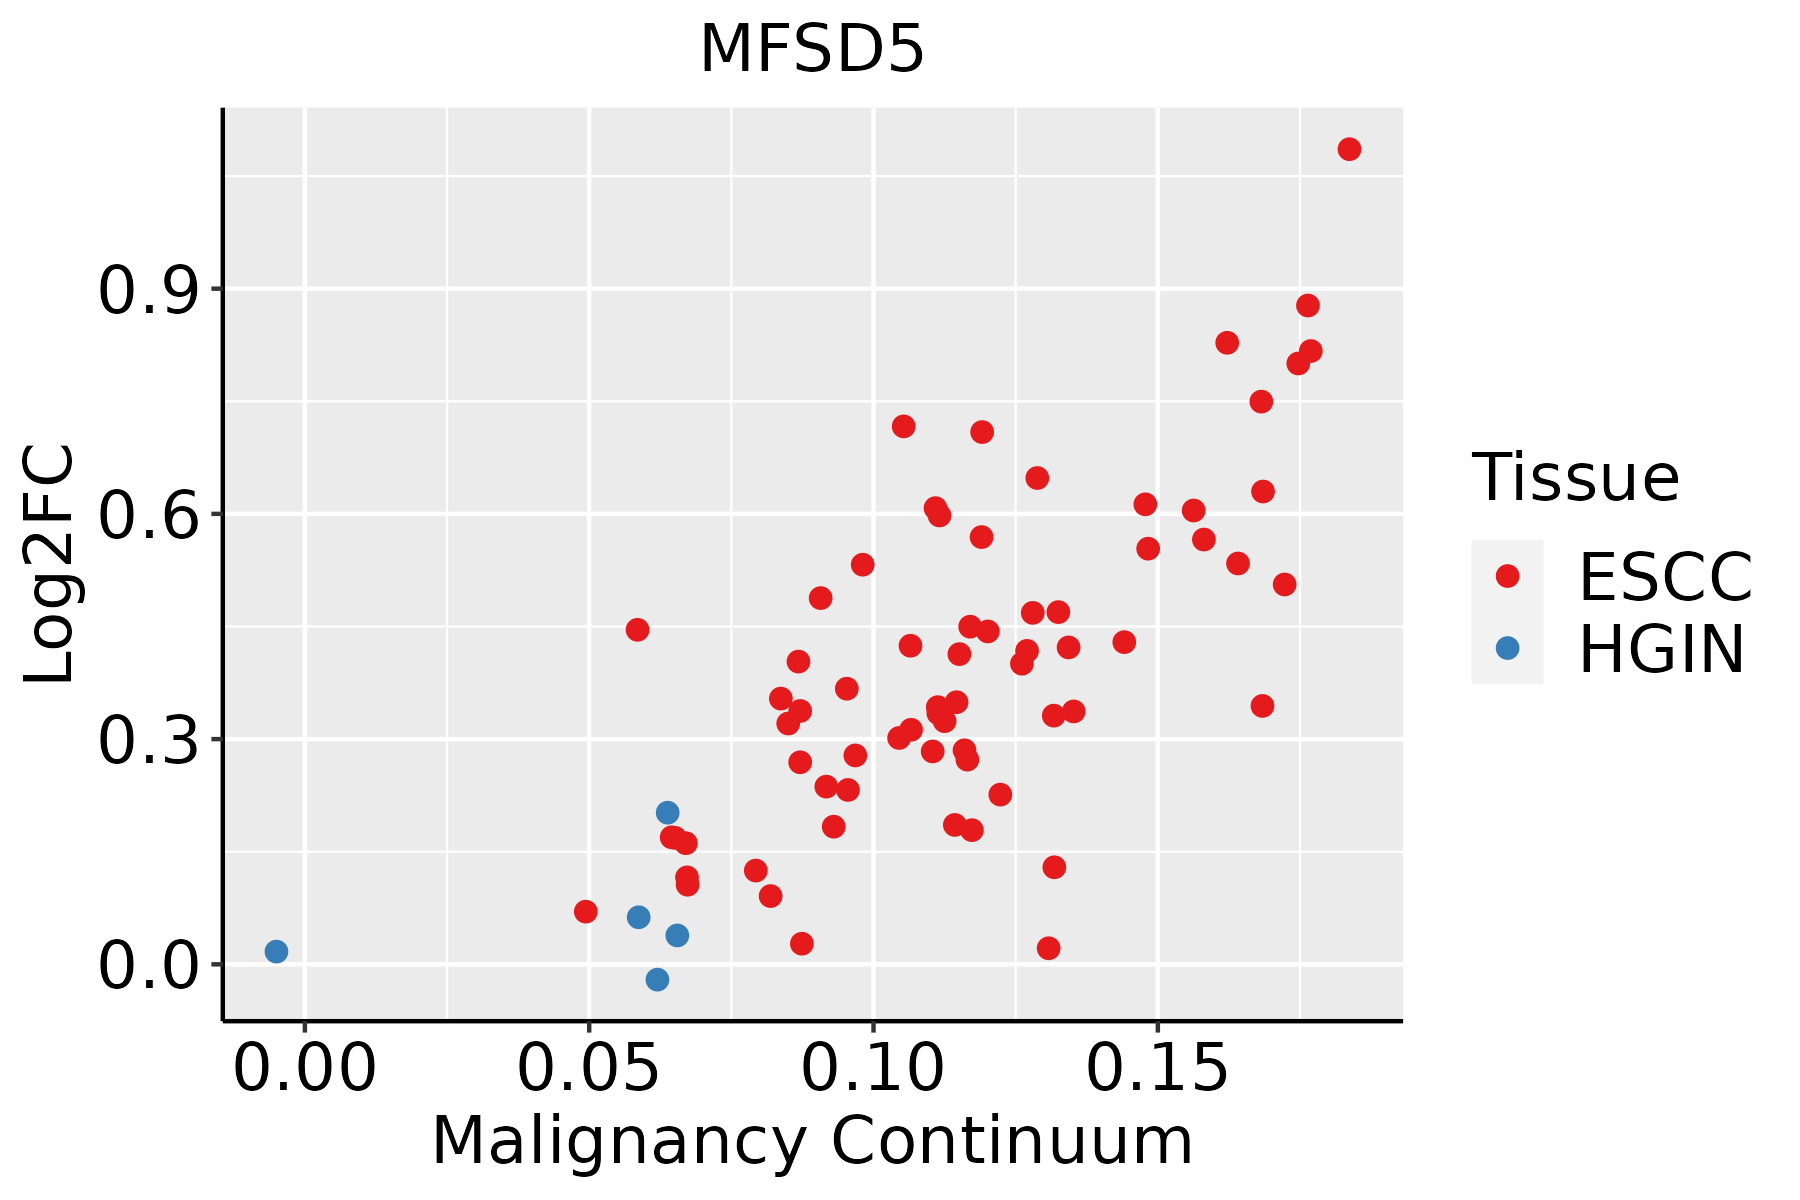 | ESCC: Esophageal squamous cell carcinoma |
| HGIN: High-grade intraepithelial neoplasias | ||
| LGIN: Low-grade intraepithelial neoplasias | ||
| Liver | 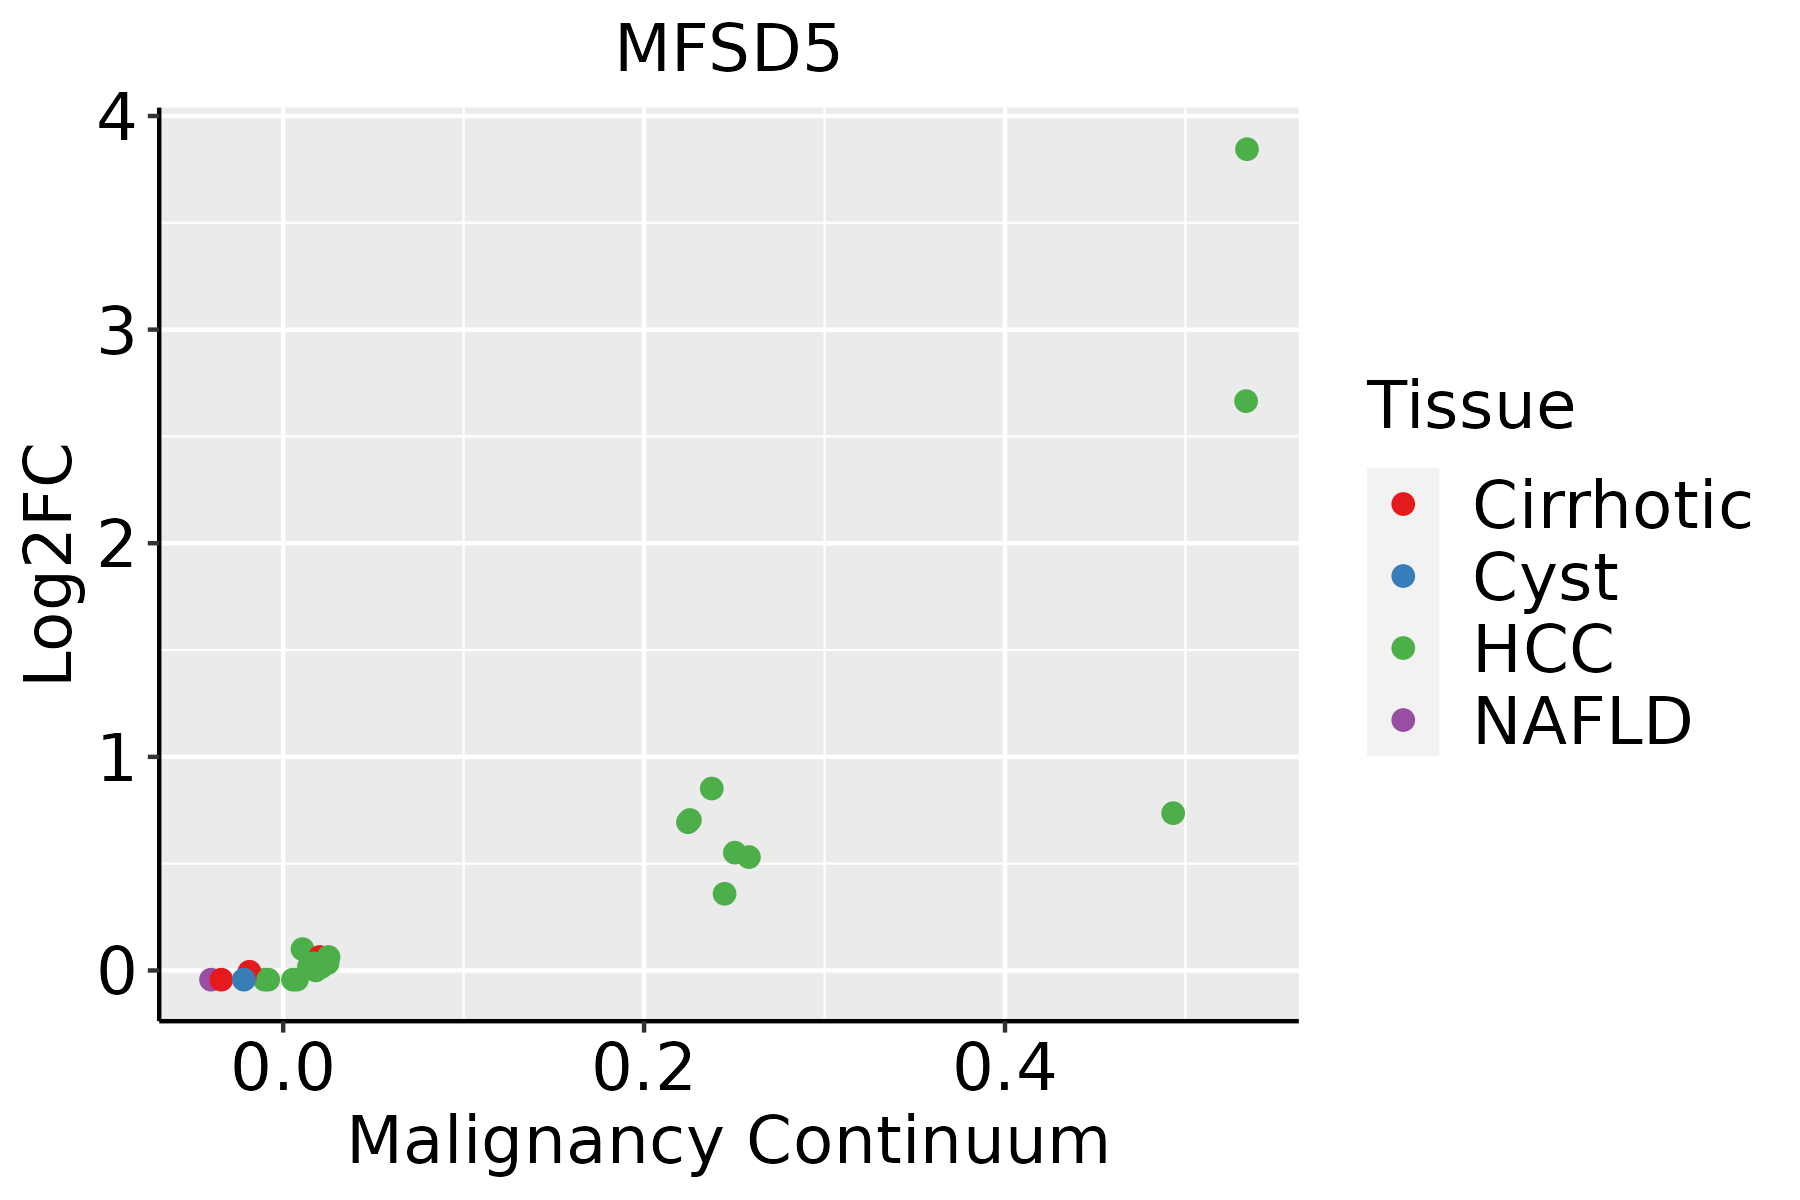 | HCC: Hepatocellular carcinoma |
| NAFLD: Non-alcoholic fatty liver disease | ||
| Oral Cavity | 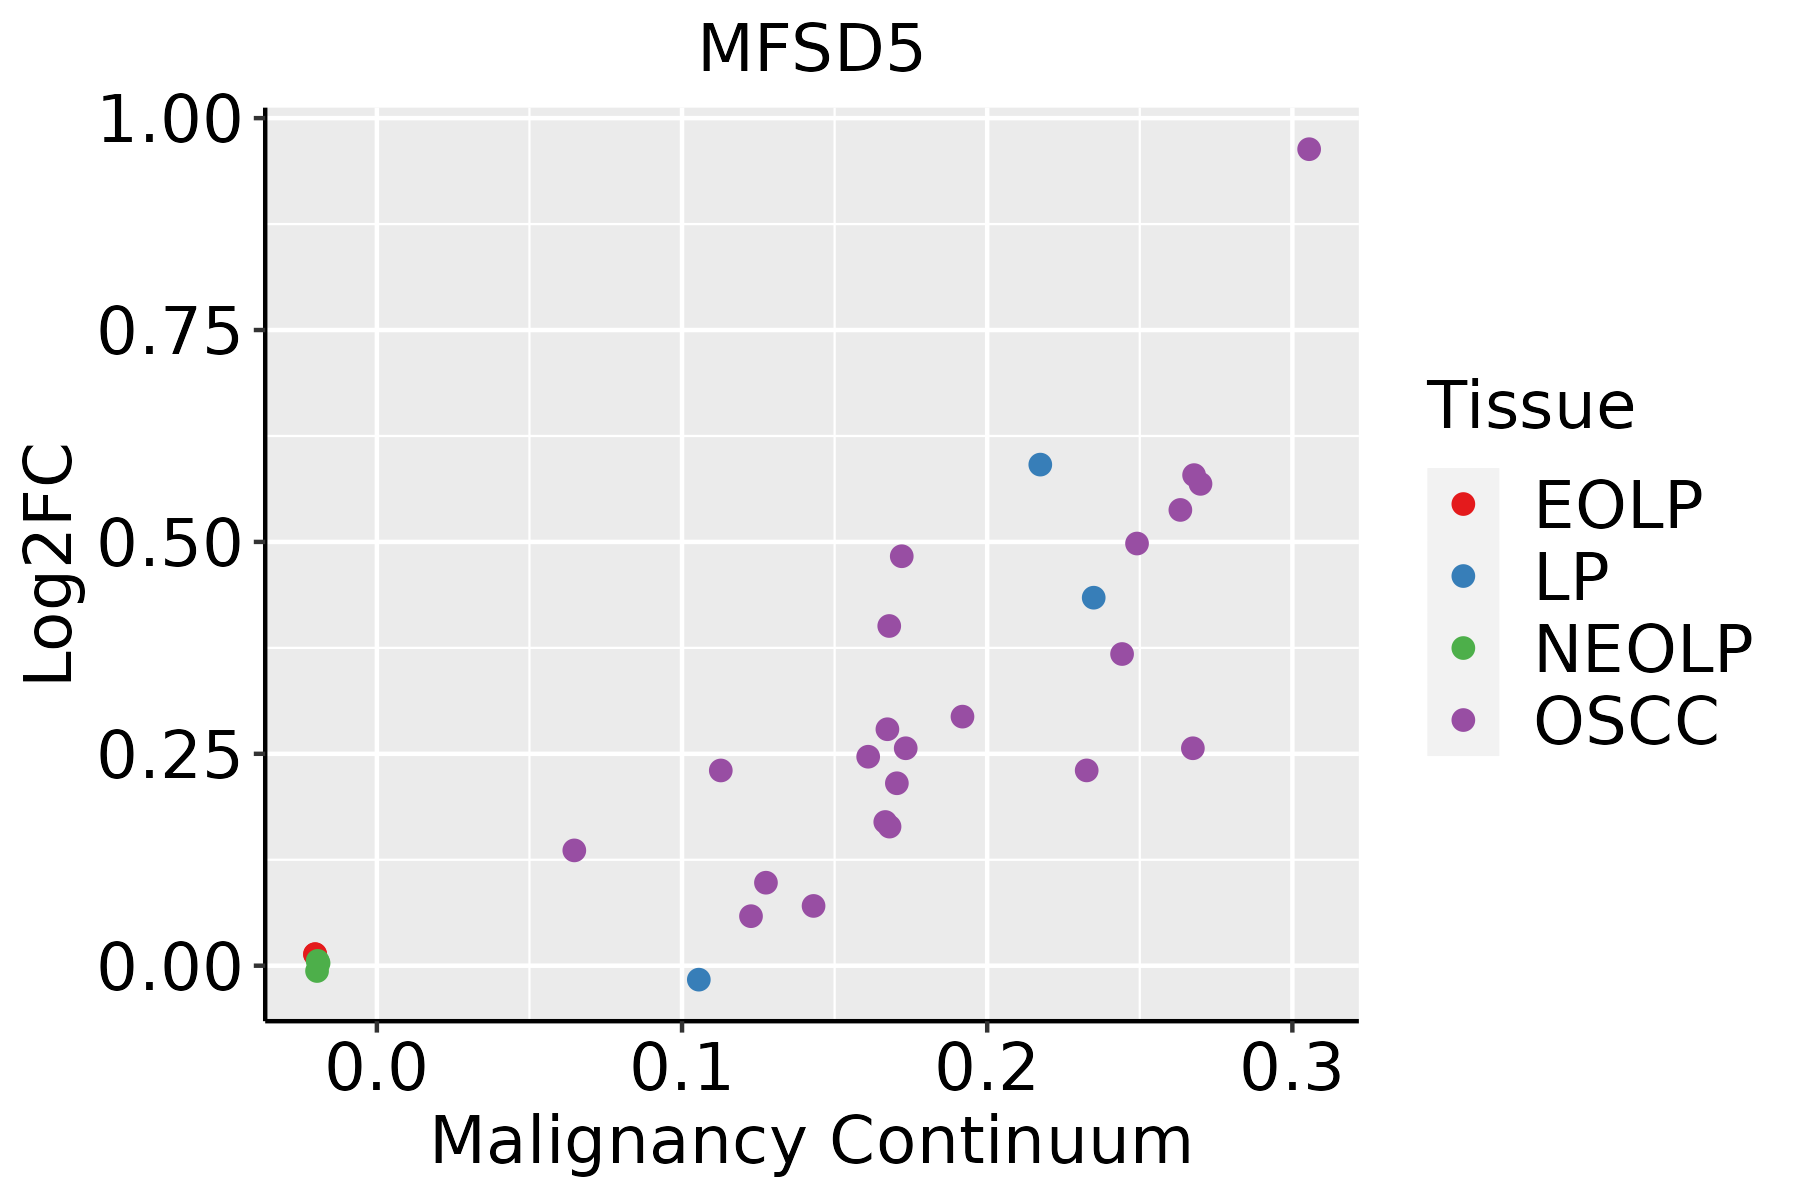 | EOLP: Erosive Oral lichen planus |
| LP: leukoplakia | ||
| NEOLP: Non-erosive oral lichen planus | ||
| OSCC: Oral squamous cell carcinoma |
| ∗log2FC in expression of this searched gene in stem-like cells from each diseased tissue sample relative to stem-like cells in normal samples in each tissue plotted against the malignancy continuum. Samples are colored based on if they are from different disease stage. |
Top |
Malignant transformation related pathway analysis |
| Find out the enriched GO biological processes and KEGG pathways involved in transition from healthy to precancer to cancer |
| Tissue | Disease Stage | Enriched GO biological Processes |
| Colorectum | AD |  |
| Colorectum | SER |  |
| Colorectum | MSS |  |
| Colorectum | MSI-H |  |
| Colorectum | FAP |  |
| ∗Top 15 enriched GO BP terms are showed in the bar plot of each disease state in each tissue. Each row represents a significant GO biological process which is colored according to the -log10(p.adjust). |
| Page: 1 2 3 4 5 6 7 8 9 |
| GO ID | Tissue | Disease Stage | Description | Gene Ratio | Bg Ratio | pvalue | p.adjust | Count |
| GO:0015698 | Colorectum | AD | inorganic anion transport | 52/3918 | 180/18723 | 6.83e-03 | 4.22e-02 | 52 |
| Page: 1 |
| Pathway ID | Tissue | Disease Stage | Description | Gene Ratio | Bg Ratio | pvalue | p.adjust | qvalue | Count |
| Page: 1 |
Top |
Cell-cell communication analysis |
| Identification of potential cell-cell interactions between two cell types and their ligand-receptor pairs for different disease states |
| Ligand | Receptor | LRpair | Pathway | Tissue | Disease Stage |
| Page: 1 |
Top |
Single-cell gene regulatory network inference analysis |
| Find out the significant the regulons (TFs) and the target genes of each regulon across cell types for different disease states |
| TF | Cell Type | Tissue | Disease Stage | Target Gene | RSS | Regulon Activity |
| ∗The dot plots of a searched regulon are shown for all cell subpopulations in each disease state of each tissue based on the regulon specific score inferred using pySCENIC and by calculating the average expression. |
| Page: 1 |
Top |
Somatic mutation of malignant transformation related genes |
| Annotation of somatic variants for genes involved in malignant transformation |
| Hugo Symbol | Variant Class | Variant Classification | dbSNP RS | HGVSc | HGVSp | HGVSp Short | SWISSPROT | BIOTYPE | SIFT | PolyPhen | Tumor Sample Barcode | Tissue | Histology | Sex | Age | Stage | Therapy Types | Drugs | Outcome |
| MFSD5 | SNV | Missense_Mutation | c.487N>C | p.Asp163His | p.D163H | Q6N075 | protein_coding | deleterious(0) | probably_damaging(0.987) | TCGA-UC-A7PF-01 | Cervix | cervical & endocervical cancer | Female | <65 | I/II | Unknown | Unknown | SD | |
| MFSD5 | SNV | Missense_Mutation | novel | c.632G>T | p.Arg211Leu | p.R211L | Q6N075 | protein_coding | deleterious(0) | probably_damaging(0.99) | TCGA-VS-A94Z-01 | Cervix | cervical & endocervical cancer | Female | <65 | I/II | Chemotherapy | cisplatin | CR |
| MFSD5 | SNV | Missense_Mutation | novel | c.1180A>G | p.Ser394Gly | p.S394G | Q6N075 | protein_coding | tolerated(0.13) | benign(0.056) | TCGA-AA-3663-01 | Colorectum | colon adenocarcinoma | Male | <65 | I/II | Unknown | Unknown | SD |
| MFSD5 | SNV | Missense_Mutation | rs370069764 | c.839N>A | p.Arg280Gln | p.R280Q | Q6N075 | protein_coding | tolerated(0.11) | benign(0.185) | TCGA-AA-3715-01 | Colorectum | colon adenocarcinoma | Male | >=65 | I/II | Unknown | Unknown | PD |
| MFSD5 | SNV | Missense_Mutation | rs370069764 | c.839N>A | p.Arg280Gln | p.R280Q | Q6N075 | protein_coding | tolerated(0.11) | benign(0.185) | TCGA-AA-A010-01 | Colorectum | colon adenocarcinoma | Female | <65 | I/II | Chemotherapy | folinic | CR |
| MFSD5 | SNV | Missense_Mutation | rs371060411 | c.1543N>G | p.Met515Val | p.M515V | Q6N075 | protein_coding | tolerated(0.2) | benign(0.013) | TCGA-AA-A022-01 | Colorectum | colon adenocarcinoma | Female | >=65 | I/II | Unknown | Unknown | SD |
| MFSD5 | SNV | Missense_Mutation | rs147930954 | c.1220N>A | p.Arg407His | p.R407H | Q6N075 | protein_coding | deleterious(0.05) | benign(0.028) | TCGA-AU-6004-01 | Colorectum | colon adenocarcinoma | Female | >=65 | I/II | Unknown | Unknown | SD |
| MFSD5 | SNV | Missense_Mutation | c.715G>C | p.Val239Leu | p.V239L | Q6N075 | protein_coding | tolerated(0.47) | benign(0.003) | TCGA-CK-4951-01 | Colorectum | colon adenocarcinoma | Female | >=65 | I/II | Unknown | Unknown | PD | |
| MFSD5 | SNV | Missense_Mutation | rs376685034 | c.1225G>A | p.Ala409Thr | p.A409T | Q6N075 | protein_coding | tolerated(0.48) | benign(0.115) | TCGA-CM-4746-01 | Colorectum | colon adenocarcinoma | Male | <65 | I/II | Unknown | Unknown | SD |
| MFSD5 | SNV | Missense_Mutation | rs781762066 | c.631N>T | p.Arg211Cys | p.R211C | Q6N075 | protein_coding | deleterious(0) | probably_damaging(0.997) | TCGA-AG-3892-01 | Colorectum | rectum adenocarcinoma | Female | <65 | I/II | Unknown | Unknown | SD |
| Page: 1 2 3 4 5 |
Top |
Related drugs of malignant transformation related genes |
| Identification of chemicals and drugs interact with genes involved in malignant transfromation |
| (DGIdb 4.0) |
| Entrez ID | Symbol | Category | Interaction Types | Drug Claim Name | Drug Name | PMIDs |
| Page: 1 |

Copyright 2023-Present -The University of Texas Health Science Center at Houston |