
|
|||||
|
 | |
| |
| |
| |
| |
| |
|
Gene: MFSD4B |
Gene summary for MFSD4B |
| Gene information | Species | Human | Gene symbol | MFSD4B | Gene ID | 91749 |
| Gene name | major facilitator superfamily domain containing 4B | |
| Gene Alias | KIAA1919 | |
| Cytomap | 6q21 | |
| Gene Type | protein-coding | GO ID | GO:0006810 | UniProtAcc | B3KSA1 |
Top |
Malignant transformation analysis |
| Identification of the aberrant gene expression in precancerous and cancerous lesions by comparing the gene expression of stem-like cells in diseased tissues with normal stem cells |
| Entrez ID | Symbol | Replicates | Species | Organ | Tissue | Adj P-value | Log2FC | Malignancy |
| 91749 | MFSD4B | AEH-subject1 | Human | Endometrium | AEH | 4.35e-17 | 3.67e-01 | -0.3059 |
| 91749 | MFSD4B | AEH-subject2 | Human | Endometrium | AEH | 1.01e-10 | 2.76e-01 | -0.2525 |
| 91749 | MFSD4B | AEH-subject3 | Human | Endometrium | AEH | 1.30e-14 | 3.37e-01 | -0.2576 |
| 91749 | MFSD4B | AEH-subject4 | Human | Endometrium | AEH | 7.01e-29 | 6.53e-01 | -0.2657 |
| 91749 | MFSD4B | AEH-subject5 | Human | Endometrium | AEH | 1.26e-32 | 6.08e-01 | -0.2953 |
| 91749 | MFSD4B | EEC-subject1 | Human | Endometrium | EEC | 5.65e-20 | 4.10e-01 | -0.2682 |
| 91749 | MFSD4B | EEC-subject2 | Human | Endometrium | EEC | 1.78e-10 | 2.77e-01 | -0.2607 |
| 91749 | MFSD4B | EEC-subject3 | Human | Endometrium | EEC | 8.77e-08 | 2.31e-01 | -0.2525 |
| 91749 | MFSD4B | EEC-subject4 | Human | Endometrium | EEC | 1.60e-18 | 4.56e-01 | -0.2571 |
| 91749 | MFSD4B | EEC-subject5 | Human | Endometrium | EEC | 1.98e-24 | 4.88e-01 | -0.249 |
| 91749 | MFSD4B | GSM5276935 | Human | Endometrium | EEC | 3.51e-03 | 1.16e-01 | -0.123 |
| 91749 | MFSD4B | HCC1 | Human | Liver | HCC | 1.33e-13 | 3.09e+00 | 0.5336 |
| 91749 | MFSD4B | HCC2 | Human | Liver | HCC | 8.70e-29 | 3.45e+00 | 0.5341 |
| 91749 | MFSD4B | HCC5 | Human | Liver | HCC | 7.05e-15 | 1.90e+00 | 0.4932 |
| 91749 | MFSD4B | S014 | Human | Liver | HCC | 3.71e-02 | 1.77e-01 | 0.2254 |
| 91749 | MFSD4B | S015 | Human | Liver | HCC | 5.50e-06 | 2.87e-01 | 0.2375 |
| 91749 | MFSD4B | S016 | Human | Liver | HCC | 3.33e-08 | 2.62e-01 | 0.2243 |
| 91749 | MFSD4B | S028 | Human | Liver | HCC | 4.08e-04 | 2.50e-01 | 0.2503 |
| 91749 | MFSD4B | S029 | Human | Liver | HCC | 2.93e-07 | 2.77e-01 | 0.2581 |
| 91749 | MFSD4B | HTA12-23-1 | Human | Pancreas | PDAC | 5.60e-10 | 9.16e-01 | 0.3405 |
| Page: 1 2 |
| Tissue | Expression Dynamics | Abbreviation |
| Endometrium |  | AEH: Atypical endometrial hyperplasia |
| EEC: Endometrioid Cancer | ||
| Liver | 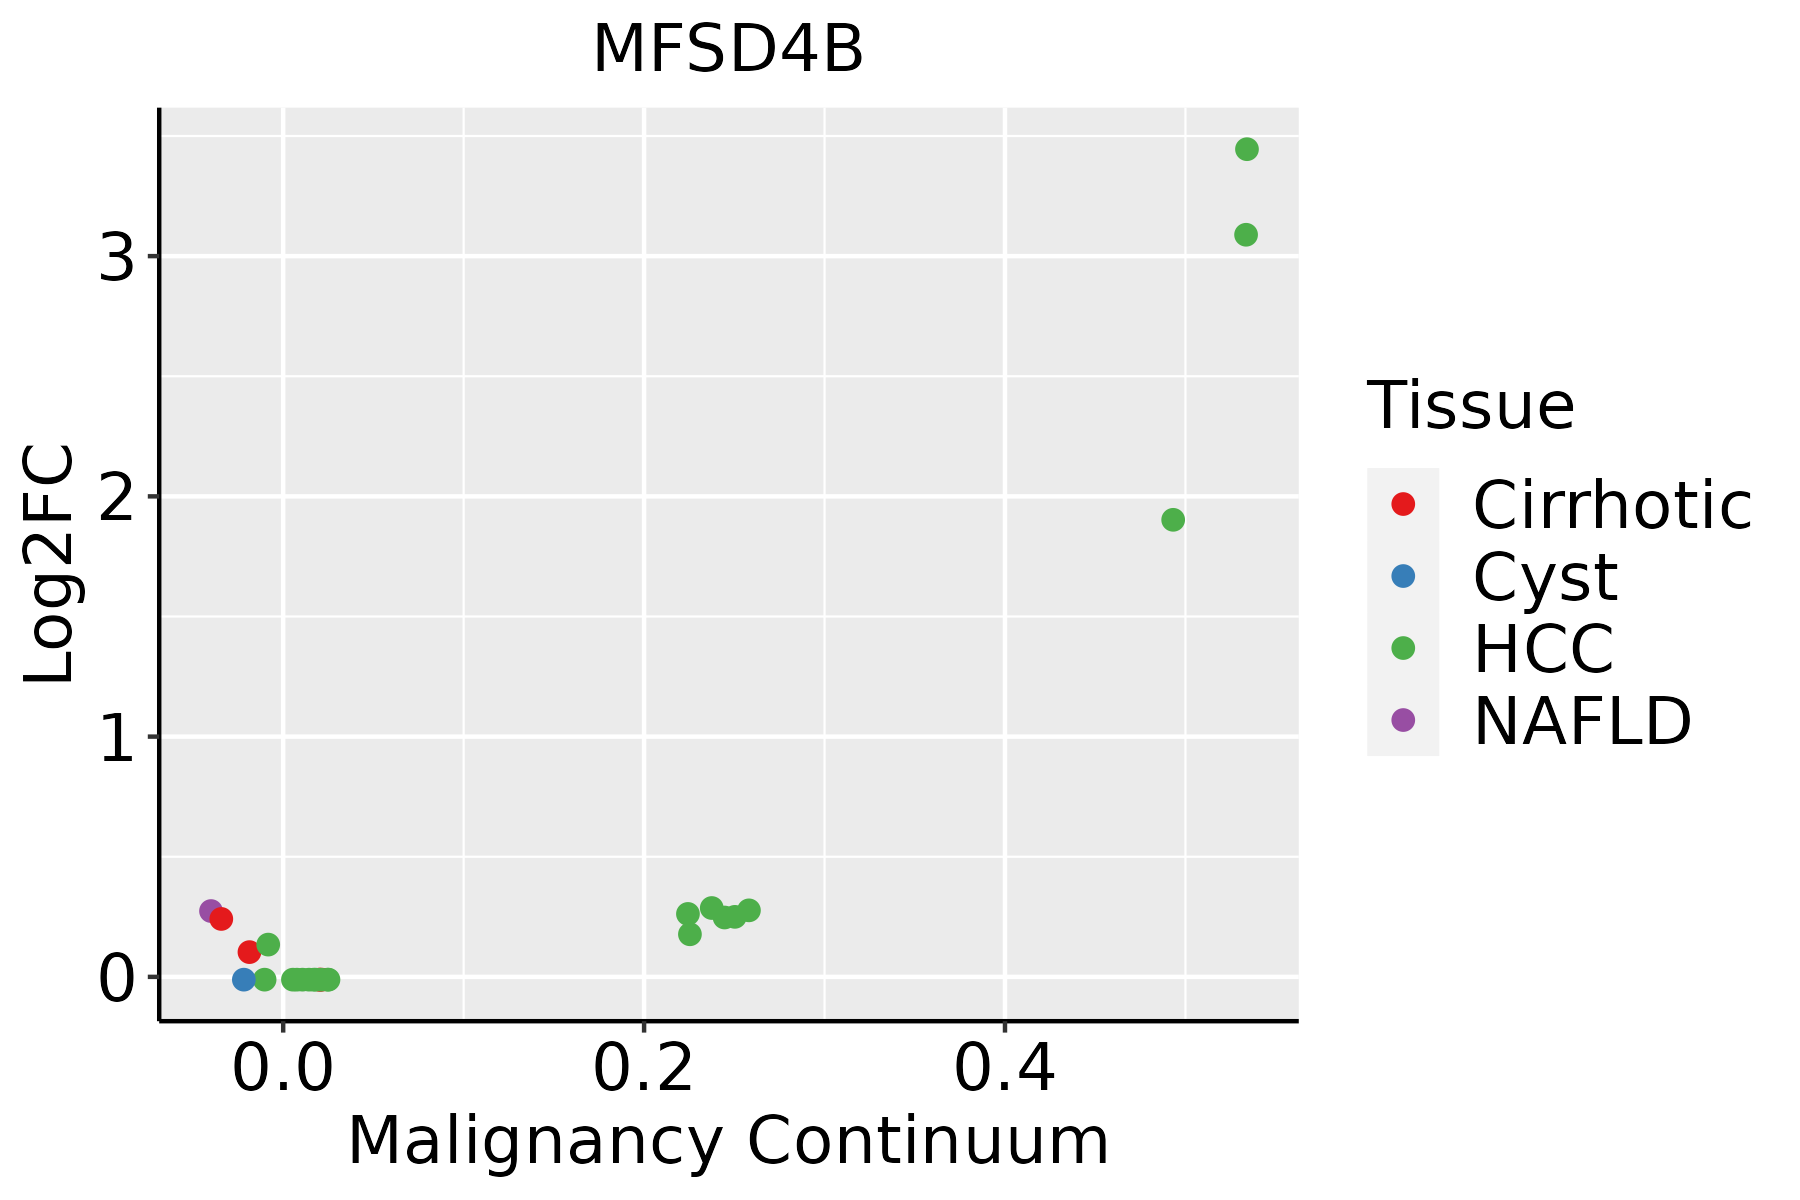 | HCC: Hepatocellular carcinoma |
| NAFLD: Non-alcoholic fatty liver disease | ||
| Thyroid |  | ATC: Anaplastic thyroid cancer |
| HT: Hashimoto's thyroiditis | ||
| PTC: Papillary thyroid cancer |
| ∗log2FC in expression of this searched gene in stem-like cells from each diseased tissue sample relative to stem-like cells in normal samples in each tissue plotted against the malignancy continuum. Samples are colored based on if they are from different disease stage. |
Top |
Malignant transformation related pathway analysis |
| Find out the enriched GO biological processes and KEGG pathways involved in transition from healthy to precancer to cancer |
| Tissue | Disease Stage | Enriched GO biological Processes |
| Colorectum | AD |  |
| Colorectum | SER |  |
| Colorectum | MSS |  |
| Colorectum | MSI-H |  |
| Colorectum | FAP |  |
| ∗Top 15 enriched GO BP terms are showed in the bar plot of each disease state in each tissue. Each row represents a significant GO biological process which is colored according to the -log10(p.adjust). |
| Page: 1 2 3 4 5 6 7 8 9 |
| GO ID | Tissue | Disease Stage | Description | Gene Ratio | Bg Ratio | pvalue | p.adjust | Count |
| GO:0008643 | Liver | HCC | carbohydrate transport | 80/7958 | 152/18723 | 7.34e-03 | 2.92e-02 | 80 |
| Page: 1 |
| Pathway ID | Tissue | Disease Stage | Description | Gene Ratio | Bg Ratio | pvalue | p.adjust | qvalue | Count |
| Page: 1 |
Top |
Cell-cell communication analysis |
| Identification of potential cell-cell interactions between two cell types and their ligand-receptor pairs for different disease states |
| Ligand | Receptor | LRpair | Pathway | Tissue | Disease Stage |
| Page: 1 |
Top |
Single-cell gene regulatory network inference analysis |
| Find out the significant the regulons (TFs) and the target genes of each regulon across cell types for different disease states |
| TF | Cell Type | Tissue | Disease Stage | Target Gene | RSS | Regulon Activity |
| ∗The dot plots of a searched regulon are shown for all cell subpopulations in each disease state of each tissue based on the regulon specific score inferred using pySCENIC and by calculating the average expression. |
| Page: 1 |
Top |
Somatic mutation of malignant transformation related genes |
| Annotation of somatic variants for genes involved in malignant transformation |
| Hugo Symbol | Variant Class | Variant Classification | dbSNP RS | HGVSc | HGVSp | HGVSp Short | SWISSPROT | BIOTYPE | SIFT | PolyPhen | Tumor Sample Barcode | Tissue | Histology | Sex | Age | Stage | Therapy Types | Drugs | Outcome |
| MFSD4B | SNV | Missense_Mutation | c.497C>G | p.Ser166Cys | p.S166C | Q5TF39 | protein_coding | tolerated(0.07) | possibly_damaging(0.855) | TCGA-AC-A23H-01 | Breast | breast invasive carcinoma | Female | >=65 | I/II | Unknown | Unknown | PD | |
| MFSD4B | SNV | Missense_Mutation | c.834T>G | p.Phe278Leu | p.F278L | Q5TF39 | protein_coding | deleterious(0) | probably_damaging(0.98) | TCGA-BH-A0AZ-01 | Breast | breast invasive carcinoma | Female | <65 | III/IV | Chemotherapy | doxorubicin | CR | |
| MFSD4B | insertion | Frame_Shift_Ins | novel | c.988_989insTA | p.Gly330ValfsTer31 | p.G330Vfs*31 | Q5TF39 | protein_coding | TCGA-A2-A0CQ-01 | Breast | breast invasive carcinoma | Female | <65 | I/II | Chemotherapy | adriamycin | SD | ||
| MFSD4B | insertion | Frame_Shift_Ins | novel | c.989_990insCTGGGATTACA | p.Ala331TrpfsTer33 | p.A331Wfs*33 | Q5TF39 | protein_coding | TCGA-A2-A0CQ-01 | Breast | breast invasive carcinoma | Female | <65 | I/II | Chemotherapy | adriamycin | SD | ||
| MFSD4B | insertion | Frame_Shift_Ins | novel | c.1356_1357insA | p.Asp453ArgfsTer3 | p.D453Rfs*3 | Q5TF39 | protein_coding | TCGA-AN-A0FX-01 | Breast | breast invasive carcinoma | Female | <65 | I/II | Unknown | Unknown | SD | ||
| MFSD4B | insertion | In_Frame_Ins | novel | c.1357_1358insCTCAAAGCAAGAAAAAGCAAGAGCATCTGCTGAGAC | p.Asp453delinsAlaGlnSerLysLysLysGlnGluHisLeuLeuArgHis | p.D453delinsAQSKKKQEHLLRH | Q5TF39 | protein_coding | TCGA-AN-A0FX-01 | Breast | breast invasive carcinoma | Female | <65 | I/II | Unknown | Unknown | SD | ||
| MFSD4B | insertion | In_Frame_Ins | novel | c.1380_1381insACCACC | p.Asn460_Asp461insThrThr | p.N460_D461insTT | Q5TF39 | protein_coding | TCGA-BH-A0AY-01 | Breast | breast invasive carcinoma | Female | <65 | I/II | Chemotherapy | SD | |||
| MFSD4B | insertion | Frame_Shift_Ins | novel | c.1381_1382insTTGGTCTTTATCTTGTTCCTTTTTGCAAGACAGCAAT | p.Asp461ValfsTer24 | p.D461Vfs*24 | Q5TF39 | protein_coding | TCGA-BH-A0AY-01 | Breast | breast invasive carcinoma | Female | <65 | I/II | Chemotherapy | SD | |||
| MFSD4B | SNV | Missense_Mutation | rs777974519 | c.443C>T | p.Ala148Val | p.A148V | Q5TF39 | protein_coding | tolerated(0.45) | benign(0.003) | TCGA-VS-A9UI-01 | Cervix | cervical & endocervical cancer | Female | >=65 | I/II | Unknown | Unknown | SD |
| MFSD4B | SNV | Missense_Mutation | novel | c.407N>G | p.Ala136Gly | p.A136G | Q5TF39 | protein_coding | deleterious(0) | probably_damaging(0.948) | TCGA-AZ-4315-01 | Colorectum | colon adenocarcinoma | Male | <65 | I/II | Unknown | Unknown | SD |
| Page: 1 2 3 4 5 6 7 8 9 10 |
Top |
Related drugs of malignant transformation related genes |
| Identification of chemicals and drugs interact with genes involved in malignant transfromation |
| (DGIdb 4.0) |
| Entrez ID | Symbol | Category | Interaction Types | Drug Claim Name | Drug Name | PMIDs |
| Page: 1 |

Copyright 2023-Present -The University of Texas Health Science Center at Houston |