
|
|||||
|
 | |
| |
| |
| |
| |
| |
|
Gene: MFSD3 |
Gene summary for MFSD3 |
| Gene information | Species | Human | Gene symbol | MFSD3 | Gene ID | 113655 |
| Gene name | major facilitator superfamily domain containing 3 | |
| Gene Alias | MFSD3 | |
| Cytomap | 8q24.3 | |
| Gene Type | protein-coding | GO ID | GO:0006810 | UniProtAcc | Q96ES6 |
Top |
Malignant transformation analysis |
| Identification of the aberrant gene expression in precancerous and cancerous lesions by comparing the gene expression of stem-like cells in diseased tissues with normal stem cells |
| Entrez ID | Symbol | Replicates | Species | Organ | Tissue | Adj P-value | Log2FC | Malignancy |
| 113655 | MFSD3 | HTA11_2487_2000001011 | Human | Colorectum | SER | 2.34e-04 | 1.92e-01 | -0.1808 |
| 113655 | MFSD3 | HTA11_1938_2000001011 | Human | Colorectum | AD | 1.01e-04 | 2.44e-01 | -0.0811 |
| 113655 | MFSD3 | HTA11_78_2000001011 | Human | Colorectum | AD | 2.82e-04 | 2.17e-01 | -0.1088 |
| 113655 | MFSD3 | HTA11_347_2000001011 | Human | Colorectum | AD | 2.38e-07 | 1.91e-01 | -0.1954 |
| 113655 | MFSD3 | HTA11_3361_2000001011 | Human | Colorectum | AD | 9.71e-05 | 2.57e-01 | -0.1207 |
| 113655 | MFSD3 | HTA11_83_2000001011 | Human | Colorectum | SER | 1.98e-02 | 1.86e-01 | -0.1526 |
| 113655 | MFSD3 | HTA11_696_2000001011 | Human | Colorectum | AD | 2.31e-07 | 2.37e-01 | -0.1464 |
| 113655 | MFSD3 | HTA11_1391_2000001011 | Human | Colorectum | AD | 9.03e-06 | 2.54e-01 | -0.059 |
| 113655 | MFSD3 | HTA11_7696_3000711011 | Human | Colorectum | AD | 1.21e-03 | 1.67e-01 | 0.0674 |
| 113655 | MFSD3 | HTA11_99999965104_69814 | Human | Colorectum | MSS | 4.40e-02 | 1.37e-01 | 0.281 |
| 113655 | MFSD3 | HTA11_99999971662_82457 | Human | Colorectum | MSS | 9.08e-12 | 3.50e-01 | 0.3859 |
| 113655 | MFSD3 | HTA11_99999974143_84620 | Human | Colorectum | MSS | 1.96e-10 | 3.29e-01 | 0.3005 |
| 113655 | MFSD3 | LZE2T | Human | Esophagus | ESCC | 3.00e-02 | 2.90e-01 | 0.082 |
| 113655 | MFSD3 | LZE4T | Human | Esophagus | ESCC | 6.10e-03 | 1.34e-01 | 0.0811 |
| 113655 | MFSD3 | LZE20T | Human | Esophagus | ESCC | 8.25e-04 | 2.00e-01 | 0.0662 |
| 113655 | MFSD3 | LZE24T | Human | Esophagus | ESCC | 8.21e-13 | 3.18e-01 | 0.0596 |
| 113655 | MFSD3 | P1T-E | Human | Esophagus | ESCC | 2.26e-03 | 1.47e-01 | 0.0875 |
| 113655 | MFSD3 | P2T-E | Human | Esophagus | ESCC | 2.73e-15 | 3.12e-01 | 0.1177 |
| 113655 | MFSD3 | P4T-E | Human | Esophagus | ESCC | 7.89e-20 | 5.05e-01 | 0.1323 |
| 113655 | MFSD3 | P5T-E | Human | Esophagus | ESCC | 4.58e-13 | 3.47e-01 | 0.1327 |
| Page: 1 2 3 4 5 6 |
| Tissue | Expression Dynamics | Abbreviation |
| Colorectum (GSE201348) |  | FAP: Familial adenomatous polyposis |
| CRC: Colorectal cancer | ||
| Colorectum (HTA11) |  | AD: Adenomas |
| SER: Sessile serrated lesions | ||
| MSI-H: Microsatellite-high colorectal cancer | ||
| MSS: Microsatellite stable colorectal cancer | ||
| Esophagus | 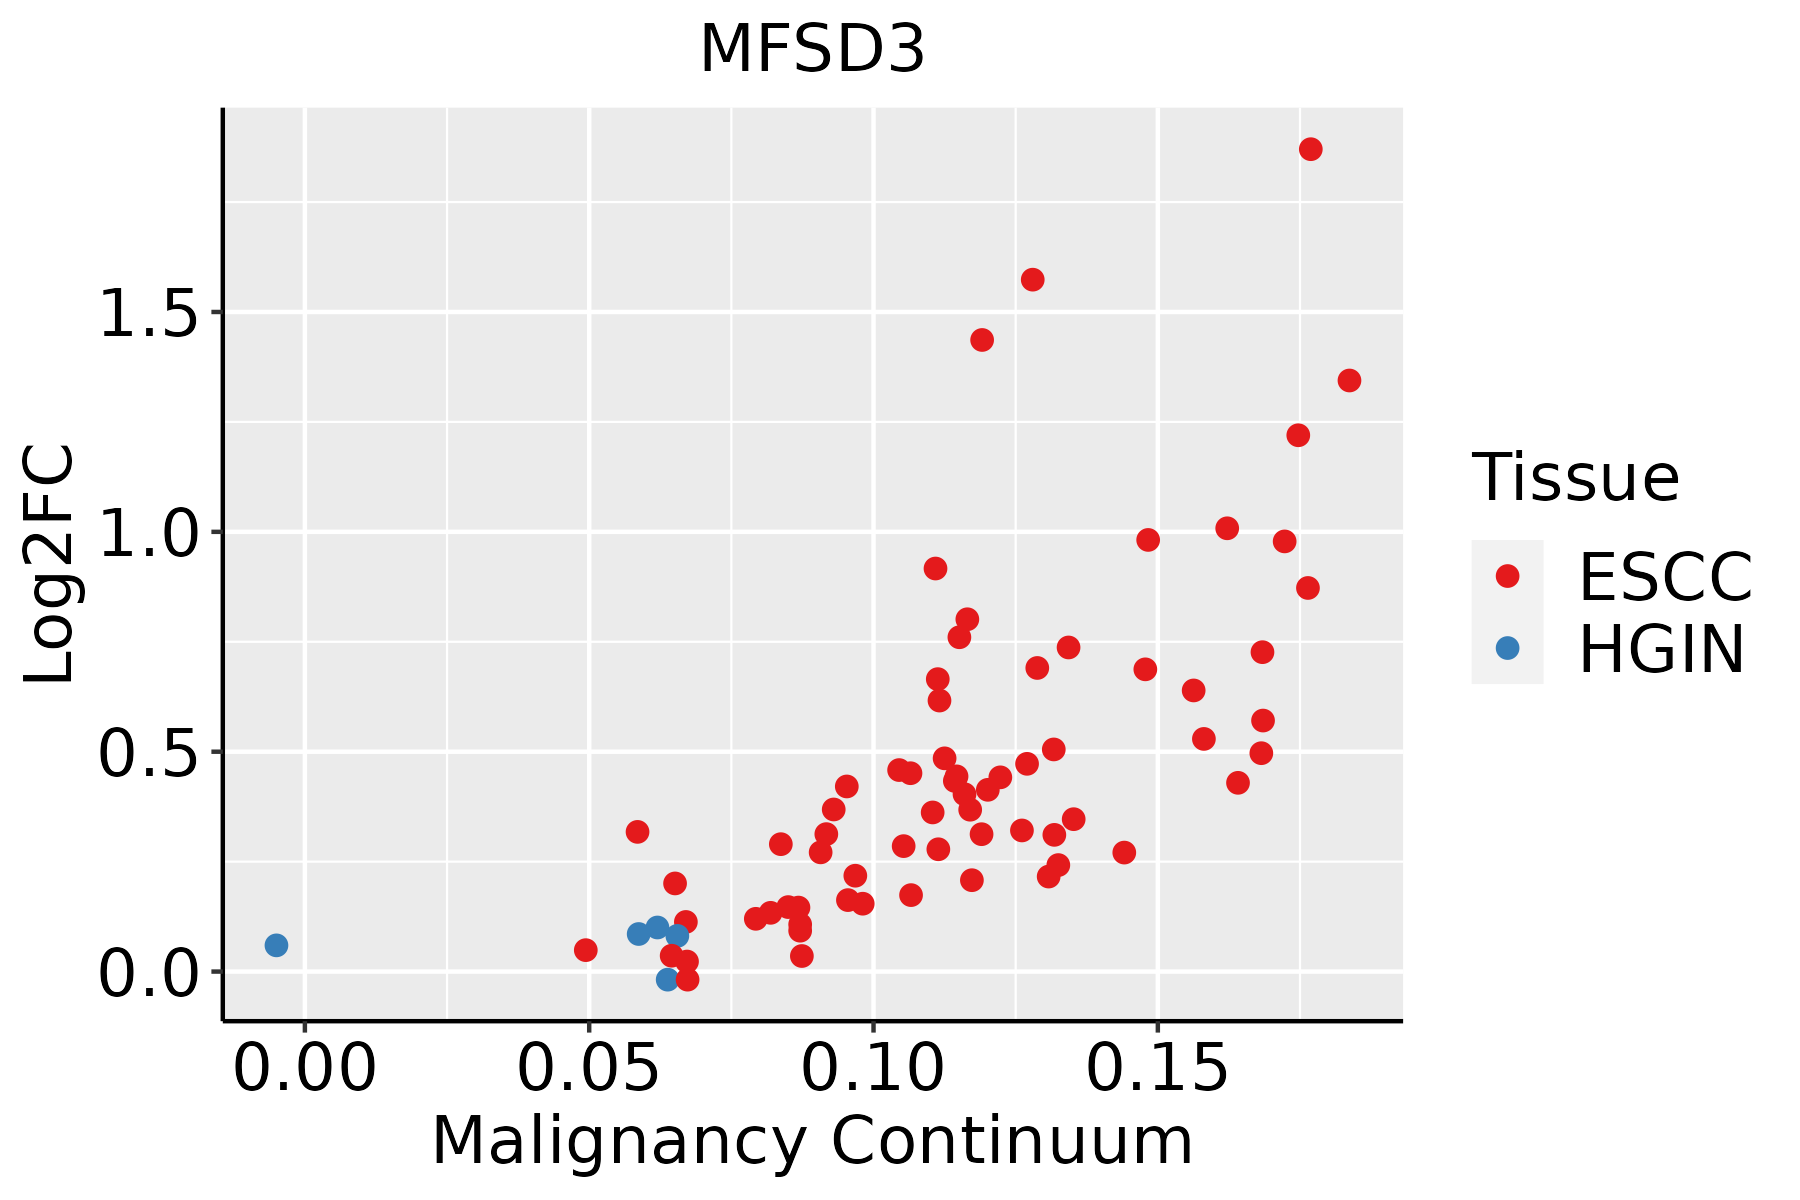 | ESCC: Esophageal squamous cell carcinoma |
| HGIN: High-grade intraepithelial neoplasias | ||
| LGIN: Low-grade intraepithelial neoplasias | ||
| Liver |  | HCC: Hepatocellular carcinoma |
| NAFLD: Non-alcoholic fatty liver disease | ||
| Oral Cavity | 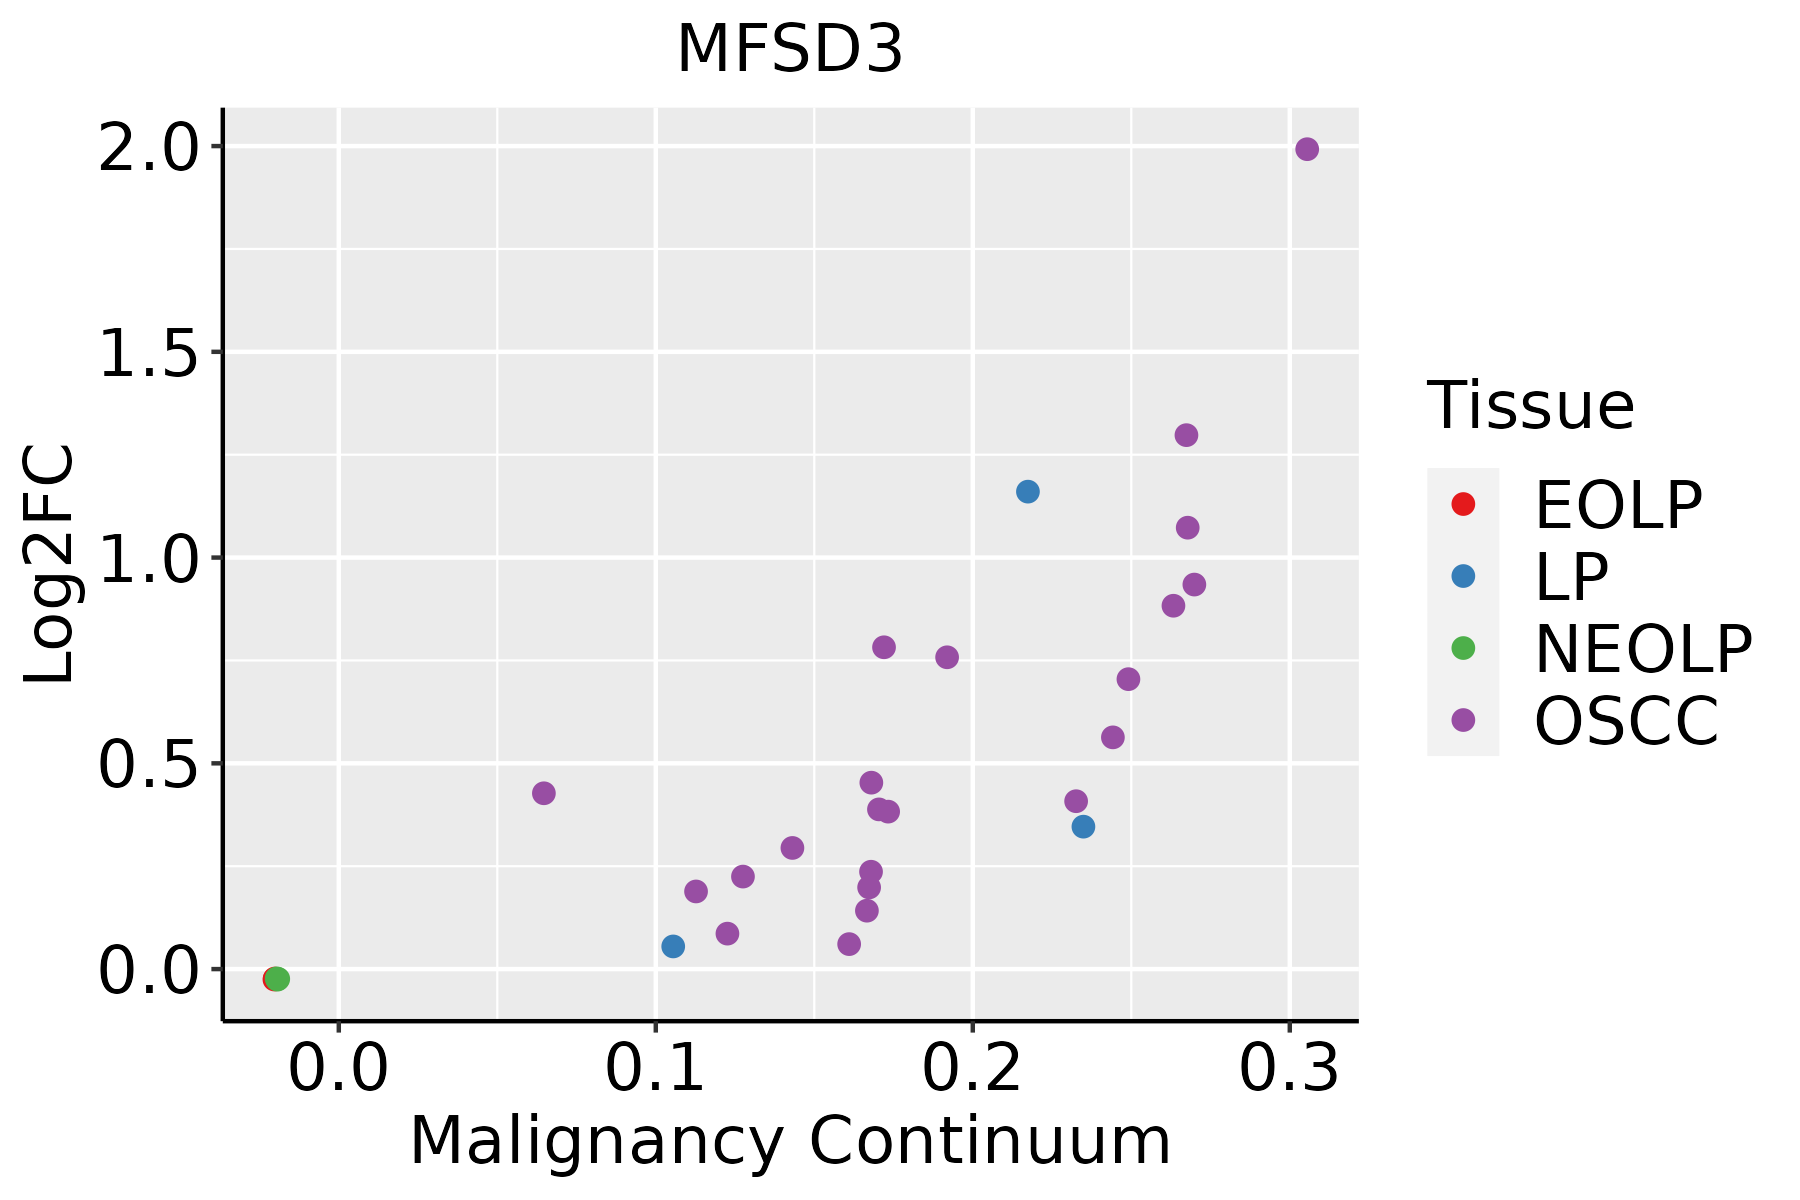 | EOLP: Erosive Oral lichen planus |
| LP: leukoplakia | ||
| NEOLP: Non-erosive oral lichen planus | ||
| OSCC: Oral squamous cell carcinoma |
| ∗log2FC in expression of this searched gene in stem-like cells from each diseased tissue sample relative to stem-like cells in normal samples in each tissue plotted against the malignancy continuum. Samples are colored based on if they are from different disease stage. |
Top |
Malignant transformation related pathway analysis |
| Find out the enriched GO biological processes and KEGG pathways involved in transition from healthy to precancer to cancer |
| Tissue | Disease Stage | Enriched GO biological Processes |
| Colorectum | AD |  |
| Colorectum | SER |  |
| Colorectum | MSS |  |
| Colorectum | MSI-H |  |
| Colorectum | FAP |  |
| ∗Top 15 enriched GO BP terms are showed in the bar plot of each disease state in each tissue. Each row represents a significant GO biological process which is colored according to the -log10(p.adjust). |
| Page: 1 2 3 4 5 6 7 8 9 |
| GO ID | Tissue | Disease Stage | Description | Gene Ratio | Bg Ratio | pvalue | p.adjust | Count |
| GO:1902600 | Colorectum | AD | proton transmembrane transport | 66/3918 | 157/18723 | 1.59e-09 | 1.17e-07 | 66 |
| GO:19026001 | Colorectum | SER | proton transmembrane transport | 60/2897 | 157/18723 | 3.12e-12 | 7.08e-10 | 60 |
| GO:19026002 | Colorectum | MSS | proton transmembrane transport | 57/3467 | 157/18723 | 1.00e-07 | 4.81e-06 | 57 |
| GO:190260018 | Esophagus | ESCC | proton transmembrane transport | 88/8552 | 157/18723 | 5.62e-03 | 2.10e-02 | 88 |
| GO:19026007 | Liver | HCC | proton transmembrane transport | 87/7958 | 157/18723 | 7.27e-04 | 4.42e-03 | 87 |
| Page: 1 |
| Pathway ID | Tissue | Disease Stage | Description | Gene Ratio | Bg Ratio | pvalue | p.adjust | qvalue | Count |
| Page: 1 |
Top |
Cell-cell communication analysis |
| Identification of potential cell-cell interactions between two cell types and their ligand-receptor pairs for different disease states |
| Ligand | Receptor | LRpair | Pathway | Tissue | Disease Stage |
| Page: 1 |
Top |
Single-cell gene regulatory network inference analysis |
| Find out the significant the regulons (TFs) and the target genes of each regulon across cell types for different disease states |
| TF | Cell Type | Tissue | Disease Stage | Target Gene | RSS | Regulon Activity |
| ∗The dot plots of a searched regulon are shown for all cell subpopulations in each disease state of each tissue based on the regulon specific score inferred using pySCENIC and by calculating the average expression. |
| Page: 1 |
Top |
Somatic mutation of malignant transformation related genes |
| Annotation of somatic variants for genes involved in malignant transformation |
| Hugo Symbol | Variant Class | Variant Classification | dbSNP RS | HGVSc | HGVSp | HGVSp Short | SWISSPROT | BIOTYPE | SIFT | PolyPhen | Tumor Sample Barcode | Tissue | Histology | Sex | Age | Stage | Therapy Types | Drugs | Outcome |
| MFSD3 | SNV | Missense_Mutation | c.785N>T | p.Ser262Phe | p.S262F | Q96ES6 | protein_coding | deleterious(0) | probably_damaging(0.996) | TCGA-AC-A23H-01 | Breast | breast invasive carcinoma | Female | >=65 | I/II | Unknown | Unknown | PD | |
| MFSD3 | SNV | Missense_Mutation | rs138616461 | c.862N>T | p.Arg288Cys | p.R288C | Q96ES6 | protein_coding | tolerated(0.18) | benign(0.376) | TCGA-AR-A255-01 | Breast | breast invasive carcinoma | Female | <65 | I/II | Targeted Molecular therapy | trastuzumab | SD |
| MFSD3 | SNV | Missense_Mutation | c.640N>C | p.Gly214Arg | p.G214R | Q96ES6 | protein_coding | deleterious(0) | probably_damaging(1) | TCGA-C8-A134-01 | Breast | breast invasive carcinoma | Female | <65 | I/II | Chemotherapy | 5-fluorouracil | CR | |
| MFSD3 | SNV | Missense_Mutation | c.1234N>G | p.Leu412Val | p.L412V | Q96ES6 | protein_coding | deleterious_low_confidence(0) | benign(0.005) | TCGA-C8-A26Y-01 | Breast | breast invasive carcinoma | Female | >=65 | I/II | Unknown | Unknown | SD | |
| MFSD3 | SNV | Missense_Mutation | rs191044206 | c.1034N>A | p.Arg345His | p.R345H | Q96ES6 | protein_coding | tolerated(1) | benign(0.001) | TCGA-AZ-6601-01 | Colorectum | colon adenocarcinoma | Male | >=65 | I/II | Unknown | Unknown | PD |
| MFSD3 | SNV | Missense_Mutation | novel | c.828N>A | p.His276Gln | p.H276Q | Q96ES6 | protein_coding | tolerated(0.23) | benign(0.202) | TCGA-A5-A0G1-01 | Endometrium | uterine corpus endometrioid carcinoma | Female | >=65 | I/II | Unknown | Unknown | SD |
| MFSD3 | SNV | Missense_Mutation | rs191044206 | c.1034N>A | p.Arg345His | p.R345H | Q96ES6 | protein_coding | tolerated(1) | benign(0.001) | TCGA-AJ-A3NE-01 | Endometrium | uterine corpus endometrioid carcinoma | Female | <65 | I/II | Unknown | Unknown | SD |
| MFSD3 | SNV | Missense_Mutation | rs774314606 | c.863N>A | p.Arg288His | p.R288H | Q96ES6 | protein_coding | tolerated(0.54) | benign(0.227) | TCGA-AP-A0LM-01 | Endometrium | uterine corpus endometrioid carcinoma | Female | <65 | III/IV | Chemotherapy | cisplatin | SD |
| MFSD3 | SNV | Missense_Mutation | novel | c.794G>A | p.Gly265Asp | p.G265D | Q96ES6 | protein_coding | deleterious(0) | probably_damaging(0.997) | TCGA-AP-A1DK-01 | Endometrium | uterine corpus endometrioid carcinoma | Female | <65 | I/II | Unknown | Unknown | SD |
| MFSD3 | SNV | Missense_Mutation | rs759614660 | c.869N>A | p.Arg290His | p.R290H | Q96ES6 | protein_coding | deleterious(0.01) | probably_damaging(0.971) | TCGA-D1-A103-01 | Endometrium | uterine corpus endometrioid carcinoma | Female | >=65 | I/II | Unknown | Unknown | SD |
| Page: 1 2 3 |
Top |
Related drugs of malignant transformation related genes |
| Identification of chemicals and drugs interact with genes involved in malignant transfromation |
| (DGIdb 4.0) |
| Entrez ID | Symbol | Category | Interaction Types | Drug Claim Name | Drug Name | PMIDs |
| Page: 1 |

Copyright 2023-Present -The University of Texas Health Science Center at Houston |