
|
|||||
|
 | |
| |
| |
| |
| |
| |
|
Gene: MFSD2A |
Gene summary for MFSD2A |
| Gene information | Species | Human | Gene symbol | MFSD2A | Gene ID | 84879 |
| Gene name | major facilitator superfamily domain containing 2A | |
| Gene Alias | MCPH15 | |
| Cytomap | 1p34.2 | |
| Gene Type | protein-coding | GO ID | GO:0000902 | UniProtAcc | Q71RE4 |
Top |
Malignant transformation analysis |
| Identification of the aberrant gene expression in precancerous and cancerous lesions by comparing the gene expression of stem-like cells in diseased tissues with normal stem cells |
| Entrez ID | Symbol | Replicates | Species | Organ | Tissue | Adj P-value | Log2FC | Malignancy |
| 84879 | MFSD2A | LZE7T | Human | Esophagus | ESCC | 7.18e-15 | 1.04e+00 | 0.0667 |
| 84879 | MFSD2A | LZE8T | Human | Esophagus | ESCC | 1.60e-05 | 9.91e-02 | 0.067 |
| 84879 | MFSD2A | LZE20T | Human | Esophagus | ESCC | 2.23e-02 | 3.03e-02 | 0.0662 |
| 84879 | MFSD2A | LZE21T | Human | Esophagus | ESCC | 4.81e-04 | 3.94e-01 | 0.0655 |
| 84879 | MFSD2A | P1T-E | Human | Esophagus | ESCC | 1.97e-02 | 6.94e-02 | 0.0875 |
| 84879 | MFSD2A | P2T-E | Human | Esophagus | ESCC | 4.39e-08 | 3.05e-01 | 0.1177 |
| 84879 | MFSD2A | P4T-E | Human | Esophagus | ESCC | 2.01e-19 | 5.76e-01 | 0.1323 |
| 84879 | MFSD2A | P5T-E | Human | Esophagus | ESCC | 1.03e-10 | 1.83e-01 | 0.1327 |
| 84879 | MFSD2A | P8T-E | Human | Esophagus | ESCC | 1.12e-05 | 2.33e-02 | 0.0889 |
| 84879 | MFSD2A | P9T-E | Human | Esophagus | ESCC | 4.28e-07 | 2.96e-01 | 0.1131 |
| 84879 | MFSD2A | P10T-E | Human | Esophagus | ESCC | 1.03e-34 | 7.01e-01 | 0.116 |
| 84879 | MFSD2A | P11T-E | Human | Esophagus | ESCC | 2.58e-11 | 5.50e-01 | 0.1426 |
| 84879 | MFSD2A | P12T-E | Human | Esophagus | ESCC | 9.66e-13 | 3.35e-01 | 0.1122 |
| 84879 | MFSD2A | P15T-E | Human | Esophagus | ESCC | 1.33e-04 | 2.17e-01 | 0.1149 |
| 84879 | MFSD2A | P16T-E | Human | Esophagus | ESCC | 8.25e-09 | 5.54e-02 | 0.1153 |
| 84879 | MFSD2A | P17T-E | Human | Esophagus | ESCC | 7.34e-03 | 1.04e-01 | 0.1278 |
| 84879 | MFSD2A | P20T-E | Human | Esophagus | ESCC | 2.26e-39 | 1.02e+00 | 0.1124 |
| 84879 | MFSD2A | P21T-E | Human | Esophagus | ESCC | 9.34e-32 | 7.97e-01 | 0.1617 |
| 84879 | MFSD2A | P22T-E | Human | Esophagus | ESCC | 1.88e-11 | 1.91e-01 | 0.1236 |
| 84879 | MFSD2A | P23T-E | Human | Esophagus | ESCC | 1.98e-04 | 1.96e-01 | 0.108 |
| Page: 1 2 3 4 5 |
| Tissue | Expression Dynamics | Abbreviation |
| Esophagus |  | ESCC: Esophageal squamous cell carcinoma |
| HGIN: High-grade intraepithelial neoplasias | ||
| LGIN: Low-grade intraepithelial neoplasias | ||
| Oral Cavity | 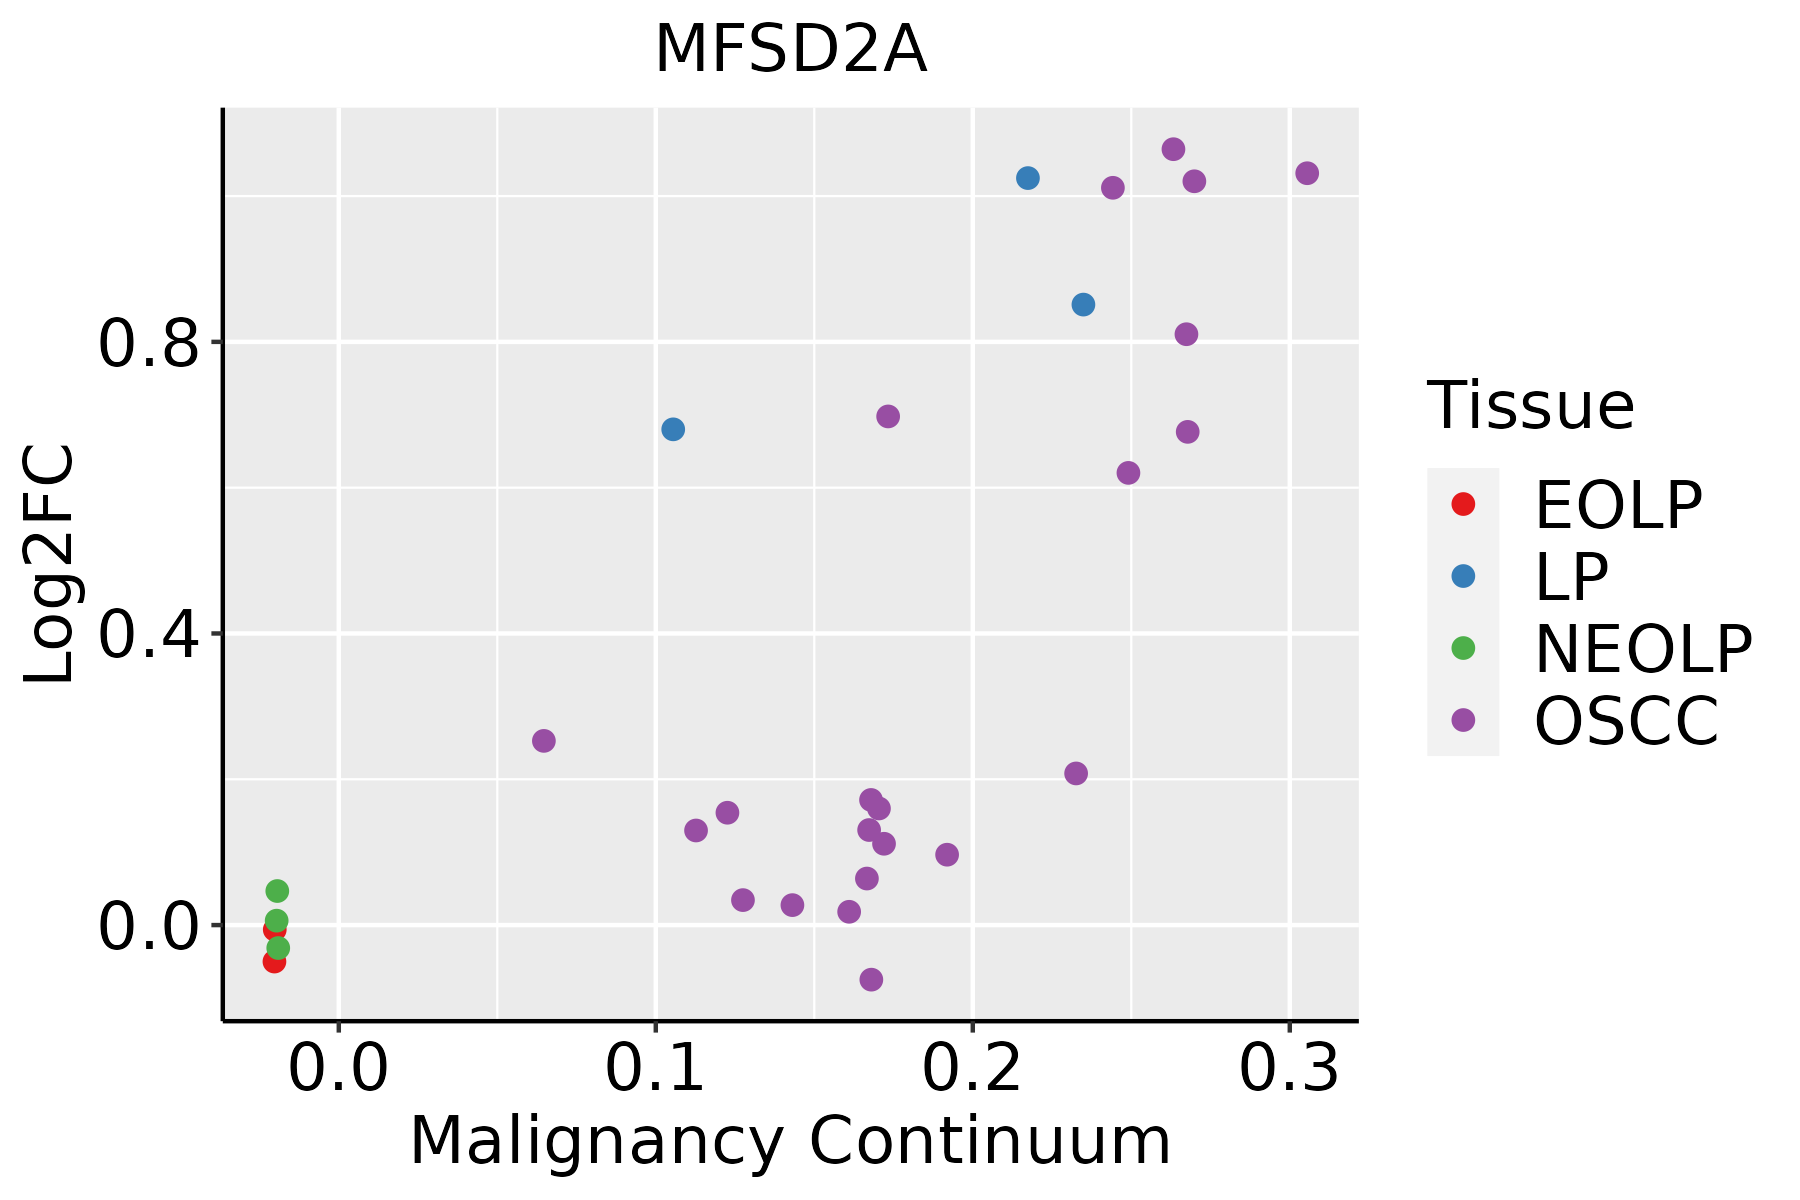 | EOLP: Erosive Oral lichen planus |
| LP: leukoplakia | ||
| NEOLP: Non-erosive oral lichen planus | ||
| OSCC: Oral squamous cell carcinoma | ||
| Skin | 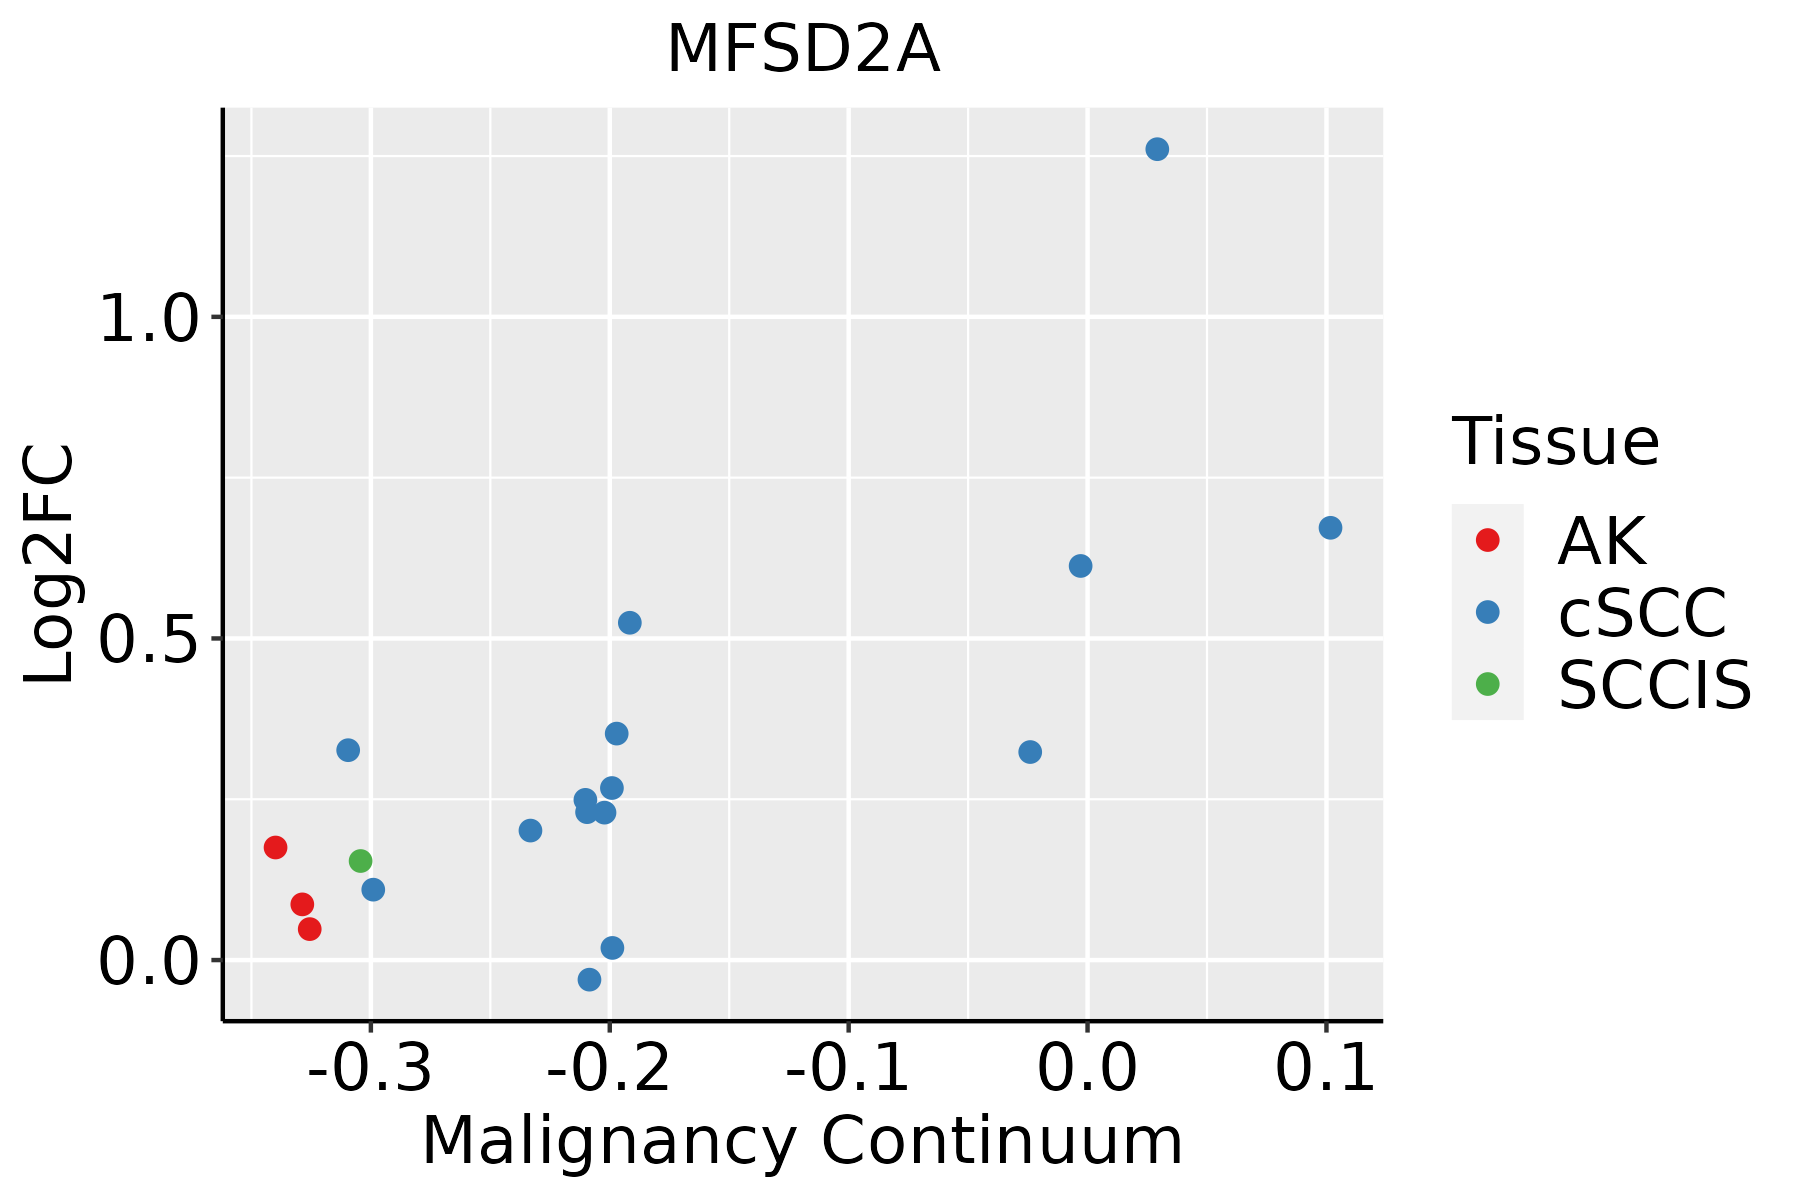 | AK: Actinic keratosis |
| cSCC: Cutaneous squamous cell carcinoma | ||
| SCCIS:squamous cell carcinoma in situ | ||
| Thyroid |  | ATC: Anaplastic thyroid cancer |
| HT: Hashimoto's thyroiditis | ||
| PTC: Papillary thyroid cancer |
| ∗log2FC in expression of this searched gene in stem-like cells from each diseased tissue sample relative to stem-like cells in normal samples in each tissue plotted against the malignancy continuum. Samples are colored based on if they are from different disease stage. |
Top |
Malignant transformation related pathway analysis |
| Find out the enriched GO biological processes and KEGG pathways involved in transition from healthy to precancer to cancer |
| Tissue | Disease Stage | Enriched GO biological Processes |
| Colorectum | AD |  |
| Colorectum | SER |  |
| Colorectum | MSS |  |
| Colorectum | MSI-H |  |
| Colorectum | FAP |  |
| ∗Top 15 enriched GO BP terms are showed in the bar plot of each disease state in each tissue. Each row represents a significant GO biological process which is colored according to the -log10(p.adjust). |
| Page: 1 2 3 4 5 6 7 8 9 |
| GO ID | Tissue | Disease Stage | Description | Gene Ratio | Bg Ratio | pvalue | p.adjust | Count |
| GO:0071496111 | Esophagus | ESCC | cellular response to external stimulus | 215/8552 | 320/18723 | 4.29e-15 | 2.43e-13 | 215 |
| GO:0031668111 | Esophagus | ESCC | cellular response to extracellular stimulus | 168/8552 | 246/18723 | 4.93e-13 | 2.23e-11 | 168 |
| GO:0031669110 | Esophagus | ESCC | cellular response to nutrient levels | 148/8552 | 215/18723 | 4.58e-12 | 1.76e-10 | 148 |
| GO:0031667111 | Esophagus | ESCC | response to nutrient levels | 289/8552 | 474/18723 | 9.25e-12 | 3.47e-10 | 289 |
| GO:0016049110 | Esophagus | ESCC | cell growth | 289/8552 | 482/18723 | 1.29e-10 | 3.77e-09 | 289 |
| GO:0009267110 | Esophagus | ESCC | cellular response to starvation | 110/8552 | 156/18723 | 2.63e-10 | 7.37e-09 | 110 |
| GO:0009895111 | Esophagus | ESCC | negative regulation of catabolic process | 201/8552 | 320/18723 | 3.88e-10 | 1.05e-08 | 201 |
| GO:004259419 | Esophagus | ESCC | response to starvation | 133/8552 | 197/18723 | 4.31e-10 | 1.14e-08 | 133 |
| GO:00086544 | Esophagus | ESCC | phospholipid biosynthetic process | 162/8552 | 253/18723 | 2.59e-09 | 5.73e-08 | 162 |
| GO:000155819 | Esophagus | ESCC | regulation of cell growth | 248/8552 | 414/18723 | 2.97e-09 | 6.45e-08 | 248 |
| GO:0031330111 | Esophagus | ESCC | negative regulation of cellular catabolic process | 166/8552 | 262/18723 | 5.17e-09 | 1.08e-07 | 166 |
| GO:00464744 | Esophagus | ESCC | glycerophospholipid biosynthetic process | 135/8552 | 211/18723 | 5.75e-08 | 1.02e-06 | 135 |
| GO:00450175 | Esophagus | ESCC | glycerolipid biosynthetic process | 154/8552 | 252/18723 | 5.20e-07 | 6.96e-06 | 154 |
| GO:002260420 | Esophagus | ESCC | regulation of cell morphogenesis | 180/8552 | 309/18723 | 5.19e-06 | 5.45e-05 | 180 |
| GO:00066446 | Esophagus | ESCC | phospholipid metabolic process | 218/8552 | 383/18723 | 5.37e-06 | 5.59e-05 | 218 |
| GO:00193958 | Esophagus | ESCC | fatty acid oxidation | 69/8552 | 103/18723 | 9.95e-06 | 9.44e-05 | 69 |
| GO:00344407 | Esophagus | ESCC | lipid oxidation | 71/8552 | 108/18723 | 2.00e-05 | 1.74e-04 | 71 |
| GO:00090628 | Esophagus | ESCC | fatty acid catabolic process | 66/8552 | 100/18723 | 3.21e-05 | 2.66e-04 | 66 |
| GO:00066318 | Esophagus | ESCC | fatty acid metabolic process | 217/8552 | 390/18723 | 4.21e-05 | 3.39e-04 | 217 |
| GO:00066561 | Esophagus | ESCC | phosphatidylcholine biosynthetic process | 24/8552 | 29/18723 | 4.50e-05 | 3.55e-04 | 24 |
| Page: 1 2 3 4 5 6 7 8 9 |
| Pathway ID | Tissue | Disease Stage | Description | Gene Ratio | Bg Ratio | pvalue | p.adjust | qvalue | Count |
| Page: 1 |
Top |
Cell-cell communication analysis |
| Identification of potential cell-cell interactions between two cell types and their ligand-receptor pairs for different disease states |
| Ligand | Receptor | LRpair | Pathway | Tissue | Disease Stage |
| Page: 1 |
Top |
Single-cell gene regulatory network inference analysis |
| Find out the significant the regulons (TFs) and the target genes of each regulon across cell types for different disease states |
| TF | Cell Type | Tissue | Disease Stage | Target Gene | RSS | Regulon Activity |
| ∗The dot plots of a searched regulon are shown for all cell subpopulations in each disease state of each tissue based on the regulon specific score inferred using pySCENIC and by calculating the average expression. |
| Page: 1 |
Top |
Somatic mutation of malignant transformation related genes |
| Annotation of somatic variants for genes involved in malignant transformation |
| Hugo Symbol | Variant Class | Variant Classification | dbSNP RS | HGVSc | HGVSp | HGVSp Short | SWISSPROT | BIOTYPE | SIFT | PolyPhen | Tumor Sample Barcode | Tissue | Histology | Sex | Age | Stage | Therapy Types | Drugs | Outcome |
| MFSD2A | insertion | Frame_Shift_Ins | novel | c.1034_1035insCCCAATATACCTACTTTGCAGAAAA | p.Leu346ProfsTer56 | p.L346Pfs*56 | Q8NA29 | protein_coding | TCGA-A2-A0D1-01 | Breast | breast invasive carcinoma | Female | >=65 | I/II | Chemotherapy | taxotere | SD | ||
| MFSD2A | SNV | Missense_Mutation | c.158N>C | p.Gly53Ala | p.G53A | Q8NA29 | protein_coding | deleterious(0.01) | possibly_damaging(0.893) | TCGA-C5-A1BQ-01 | Cervix | cervical & endocervical cancer | Female | >=65 | III/IV | Chemotherapy | cisplatin | CR | |
| MFSD2A | SNV | Missense_Mutation | novel | c.68N>A | p.Ser23Asn | p.S23N | Q8NA29 | protein_coding | tolerated(0.32) | benign(0.01) | TCGA-A6-2679-01 | Colorectum | colon adenocarcinoma | Female | >=65 | I/II | Unknown | Unknown | SD |
| MFSD2A | SNV | Missense_Mutation | novel | c.803T>C | p.Ile268Thr | p.I268T | Q8NA29 | protein_coding | deleterious(0.01) | benign(0.41) | TCGA-A6-2686-01 | Colorectum | colon adenocarcinoma | Female | >=65 | I/II | Unknown | Unknown | SD |
| MFSD2A | SNV | Missense_Mutation | rs200295199 | c.1432C>T | p.Arg478Cys | p.R478C | Q8NA29 | protein_coding | deleterious(0.02) | possibly_damaging(0.742) | TCGA-A6-2686-01 | Colorectum | colon adenocarcinoma | Female | >=65 | I/II | Unknown | Unknown | SD |
| MFSD2A | SNV | Missense_Mutation | rs139973362 | c.1196C>T | p.Ala399Val | p.A399V | Q8NA29 | protein_coding | tolerated(1) | benign(0) | TCGA-A6-5665-01 | Colorectum | colon adenocarcinoma | Female | >=65 | I/II | Unknown | Unknown | PD |
| MFSD2A | SNV | Missense_Mutation | rs556985300 | c.379C>T | p.Arg127Cys | p.R127C | Q8NA29 | protein_coding | deleterious(0) | probably_damaging(0.997) | TCGA-AA-3864-01 | Colorectum | colon adenocarcinoma | Male | >=65 | I/II | Unknown | Unknown | SD |
| MFSD2A | SNV | Missense_Mutation | c.871C>T | p.Pro291Ser | p.P291S | Q8NA29 | protein_coding | tolerated(0.67) | benign(0.018) | TCGA-AA-3864-01 | Colorectum | colon adenocarcinoma | Male | >=65 | I/II | Unknown | Unknown | SD | |
| MFSD2A | SNV | Missense_Mutation | c.958N>A | p.Ala320Thr | p.A320T | Q8NA29 | protein_coding | deleterious(0) | probably_damaging(0.996) | TCGA-AA-A010-01 | Colorectum | colon adenocarcinoma | Female | <65 | I/II | Chemotherapy | folinic | CR | |
| MFSD2A | SNV | Missense_Mutation | novel | c.793N>C | p.Ile265Leu | p.I265L | Q8NA29 | protein_coding | tolerated(0.48) | benign(0.019) | TCGA-CA-6717-01 | Colorectum | colon adenocarcinoma | Male | <65 | I/II | Chemotherapy | oxaliplatin | CR |
| Page: 1 2 3 4 5 |
Top |
Related drugs of malignant transformation related genes |
| Identification of chemicals and drugs interact with genes involved in malignant transfromation |
| (DGIdb 4.0) |
| Entrez ID | Symbol | Category | Interaction Types | Drug Claim Name | Drug Name | PMIDs |
| Page: 1 |

Copyright 2023-Present -The University of Texas Health Science Center at Houston |