
|
|||||
|
 | |
| |
| |
| |
| |
| |
|
Gene: MFSD14C |
Gene summary for MFSD14C |
| Gene information | Species | Human | Gene symbol | MFSD14C | Gene ID | 84278 |
| Gene name | major facilitator superfamily domain containing 14C | |
| Gene Alias | HIATL2 | |
| Cytomap | 9q22.33 | |
| Gene Type | pseudo | GO ID | GO:0006810 | UniProtAcc | NA |
Top |
Malignant transformation analysis |
| Identification of the aberrant gene expression in precancerous and cancerous lesions by comparing the gene expression of stem-like cells in diseased tissues with normal stem cells |
| Entrez ID | Symbol | Replicates | Species | Organ | Tissue | Adj P-value | Log2FC | Malignancy |
| 84278 | MFSD14C | CCI_1 | Human | Cervix | CC | 4.00e-24 | 8.71e-01 | 0.528 |
| 84278 | MFSD14C | CCI_2 | Human | Cervix | CC | 1.92e-27 | 1.52e+00 | 0.5249 |
| 84278 | MFSD14C | CCI_3 | Human | Cervix | CC | 2.40e-44 | 1.34e+00 | 0.516 |
| 84278 | MFSD14C | CCII_1 | Human | Cervix | CC | 4.80e-12 | 3.36e-01 | 0.3249 |
| 84278 | MFSD14C | sample3 | Human | Cervix | CC | 1.65e-18 | 2.90e-01 | 0.1387 |
| 84278 | MFSD14C | H2 | Human | Cervix | HSIL_HPV | 1.95e-07 | 1.88e-01 | 0.0632 |
| 84278 | MFSD14C | T1 | Human | Cervix | CC | 7.15e-05 | 1.55e-01 | 0.0918 |
| 84278 | MFSD14C | T2 | Human | Cervix | CC | 6.01e-03 | 1.81e-01 | 0.0709 |
| 84278 | MFSD14C | T3 | Human | Cervix | CC | 8.56e-25 | 2.96e-01 | 0.1389 |
| 84278 | MFSD14C | HTA11_3410_2000001011 | Human | Colorectum | AD | 1.67e-09 | -4.35e-01 | 0.0155 |
| 84278 | MFSD14C | HTA11_99999970781_79442 | Human | Colorectum | MSS | 7.20e-04 | -3.15e-01 | 0.294 |
| 84278 | MFSD14C | HTA11_99999974143_84620 | Human | Colorectum | MSS | 6.35e-11 | -4.12e-01 | 0.3005 |
| 84278 | MFSD14C | A002-C-010 | Human | Colorectum | FAP | 6.82e-03 | -3.33e-02 | 0.242 |
| 84278 | MFSD14C | A001-C-207 | Human | Colorectum | FAP | 6.84e-03 | -2.95e-01 | 0.1278 |
| 84278 | MFSD14C | A015-C-203 | Human | Colorectum | FAP | 5.75e-32 | -3.53e-01 | -0.1294 |
| 84278 | MFSD14C | A015-C-204 | Human | Colorectum | FAP | 1.22e-06 | -3.59e-01 | -0.0228 |
| 84278 | MFSD14C | A014-C-040 | Human | Colorectum | FAP | 2.94e-03 | -4.52e-01 | -0.1184 |
| 84278 | MFSD14C | A002-C-201 | Human | Colorectum | FAP | 2.78e-13 | -3.77e-01 | 0.0324 |
| 84278 | MFSD14C | A002-C-203 | Human | Colorectum | FAP | 3.42e-06 | -1.81e-01 | 0.2786 |
| 84278 | MFSD14C | A001-C-119 | Human | Colorectum | FAP | 2.80e-05 | -1.88e-01 | -0.1557 |
| Page: 1 2 3 4 5 6 7 |
| Tissue | Expression Dynamics | Abbreviation |
| Cervix |  | CC: Cervix cancer |
| HSIL_HPV: HPV-infected high-grade squamous intraepithelial lesions | ||
| N_HPV: HPV-infected normal cervix | ||
| Colorectum (GSE201348) |  | FAP: Familial adenomatous polyposis |
| CRC: Colorectal cancer | ||
| Colorectum (HTA11) |  | AD: Adenomas |
| SER: Sessile serrated lesions | ||
| MSI-H: Microsatellite-high colorectal cancer | ||
| MSS: Microsatellite stable colorectal cancer | ||
| Endometrium |  | AEH: Atypical endometrial hyperplasia |
| EEC: Endometrioid Cancer | ||
| Esophagus | 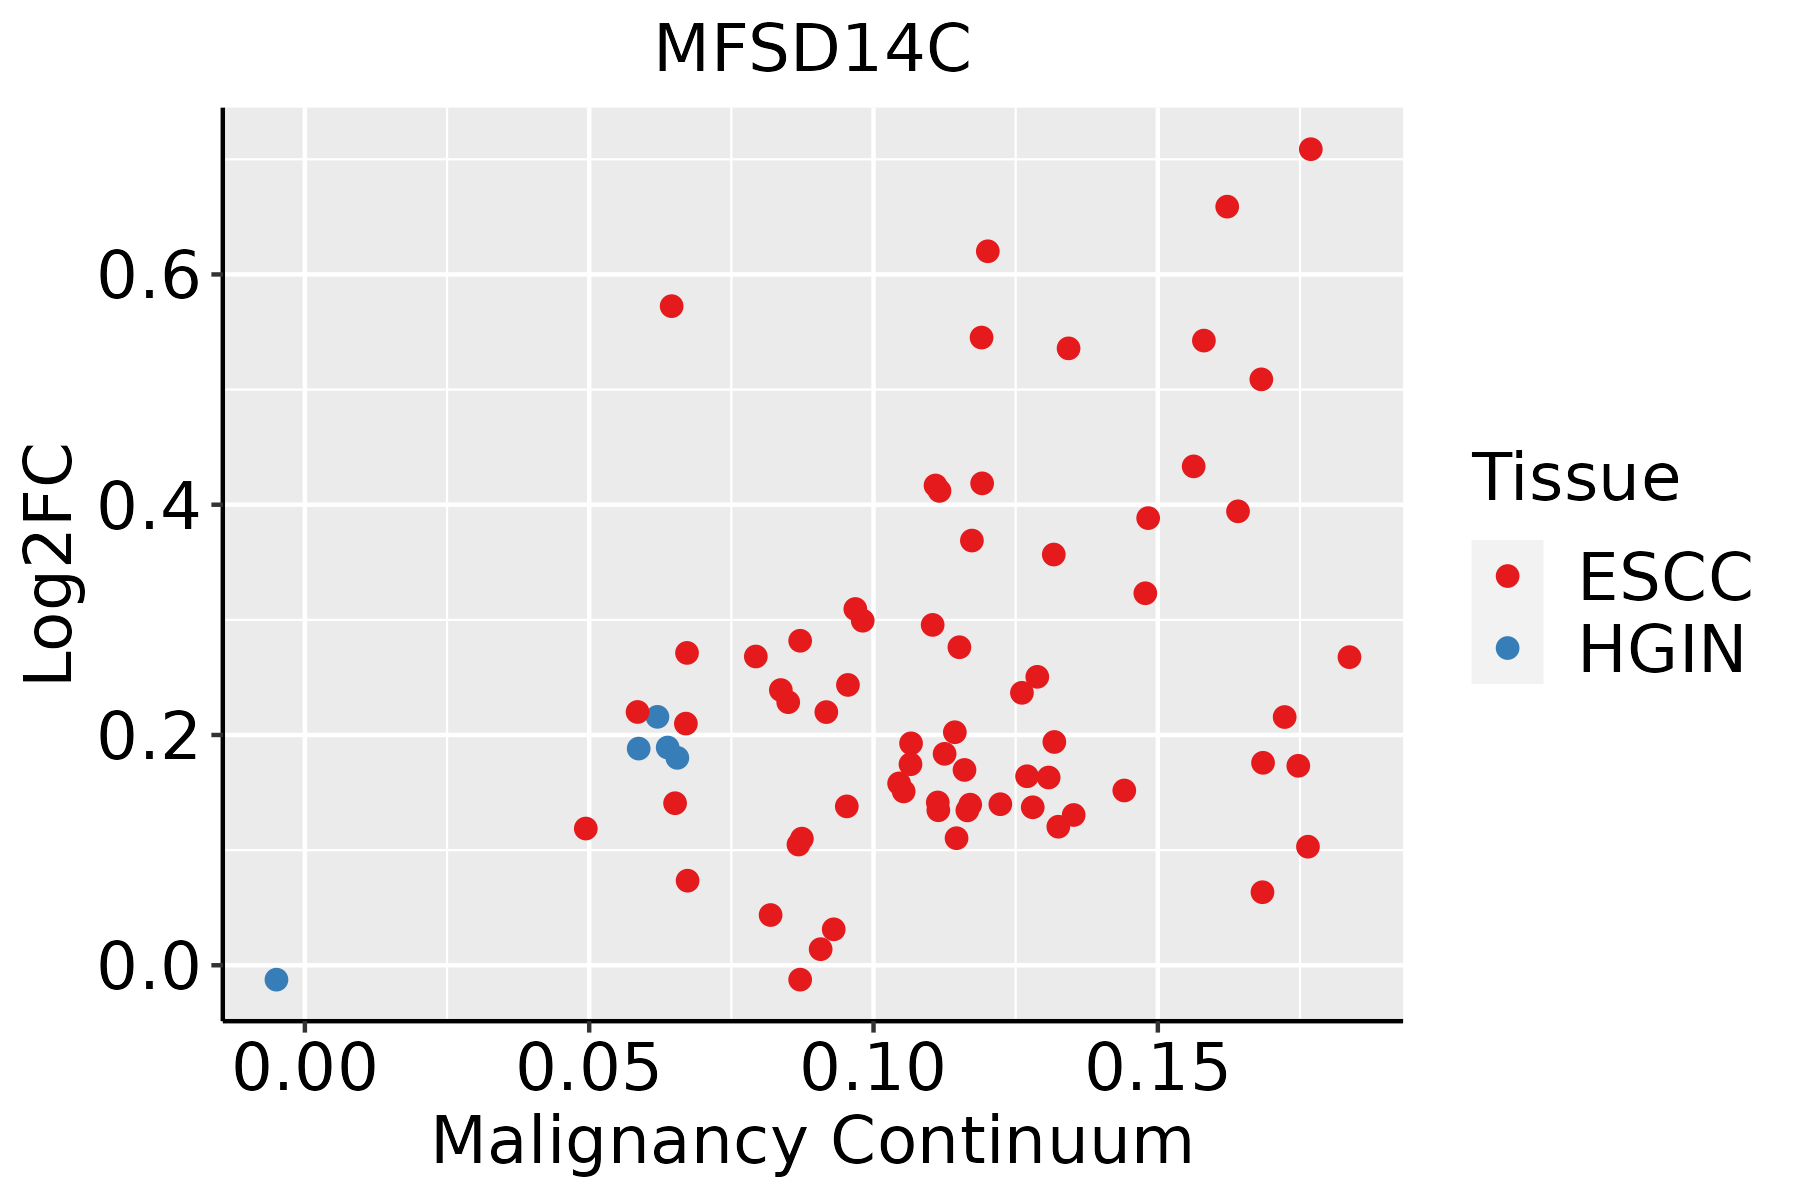 | ESCC: Esophageal squamous cell carcinoma |
| HGIN: High-grade intraepithelial neoplasias | ||
| LGIN: Low-grade intraepithelial neoplasias | ||
| Liver | 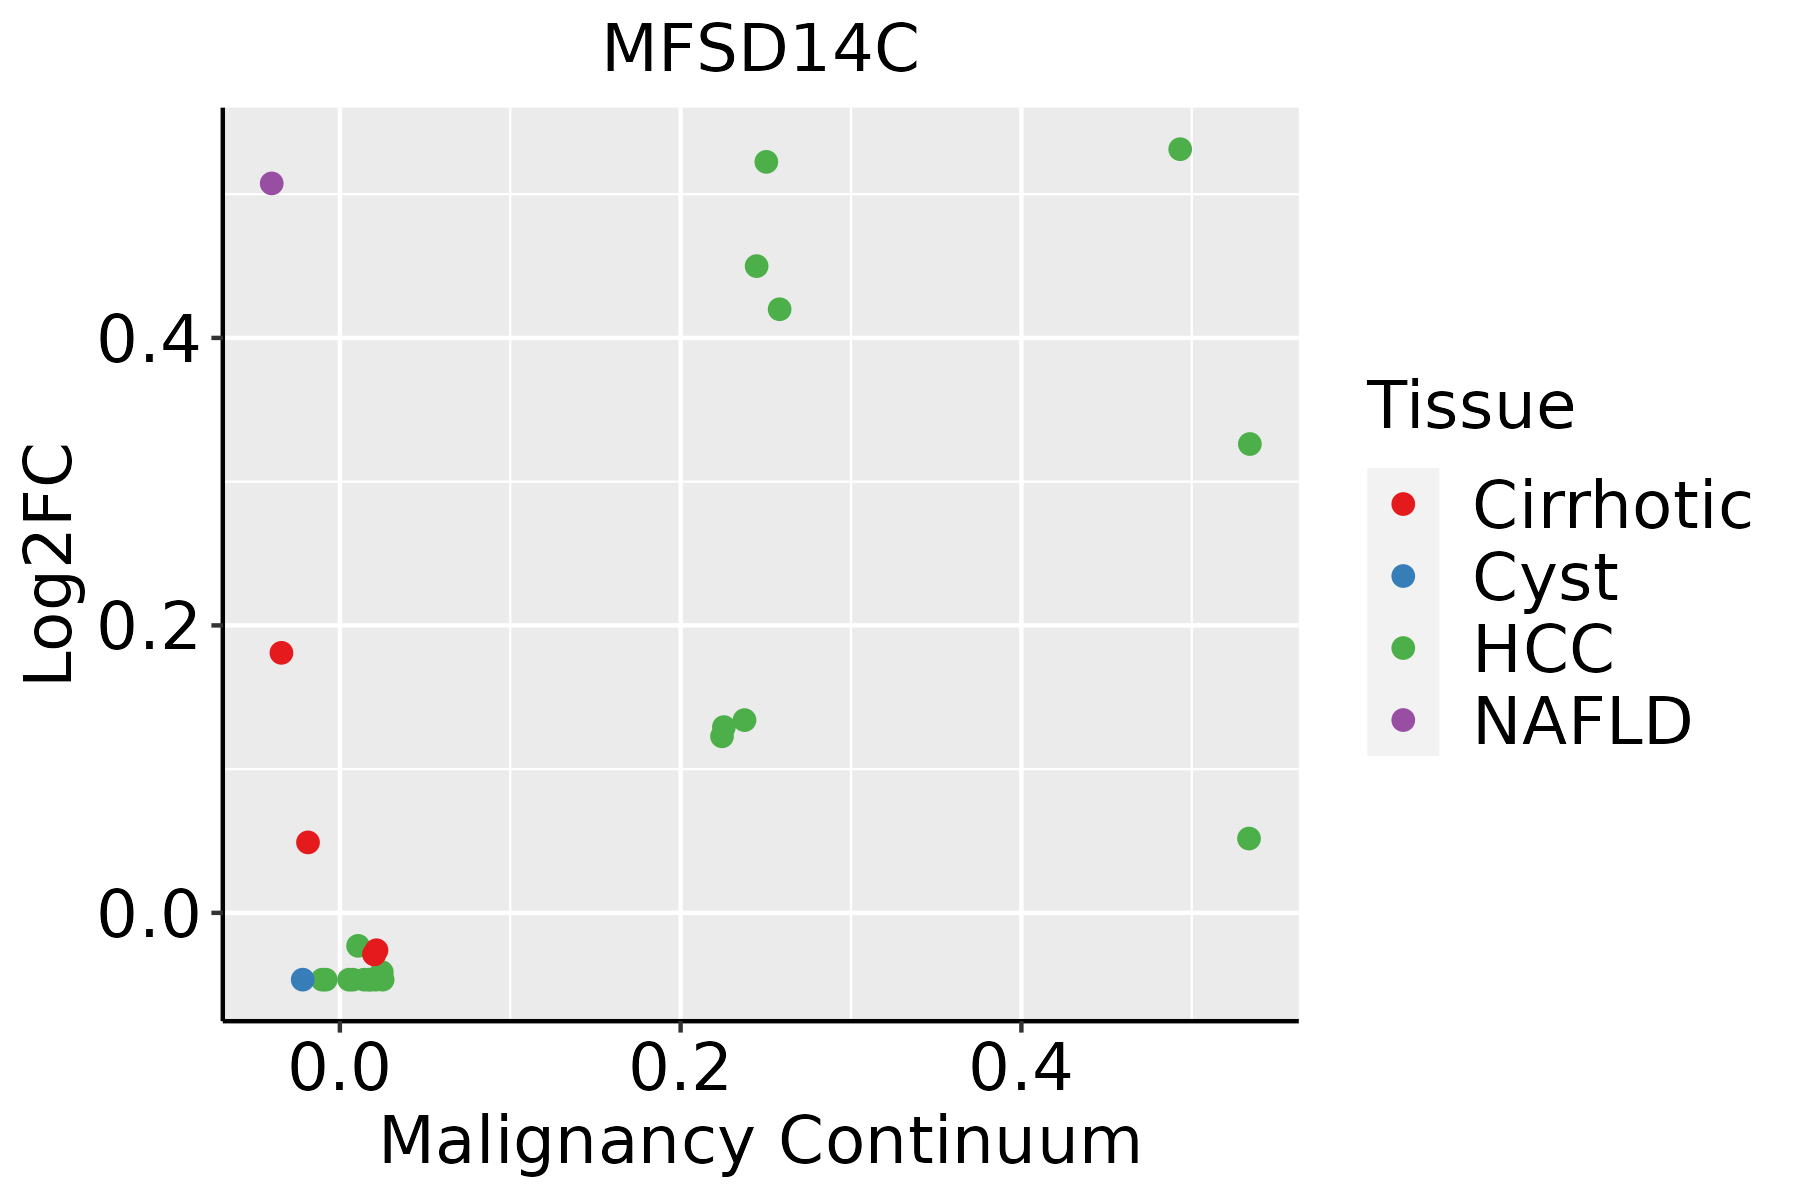 | HCC: Hepatocellular carcinoma |
| NAFLD: Non-alcoholic fatty liver disease | ||
| Prostate | 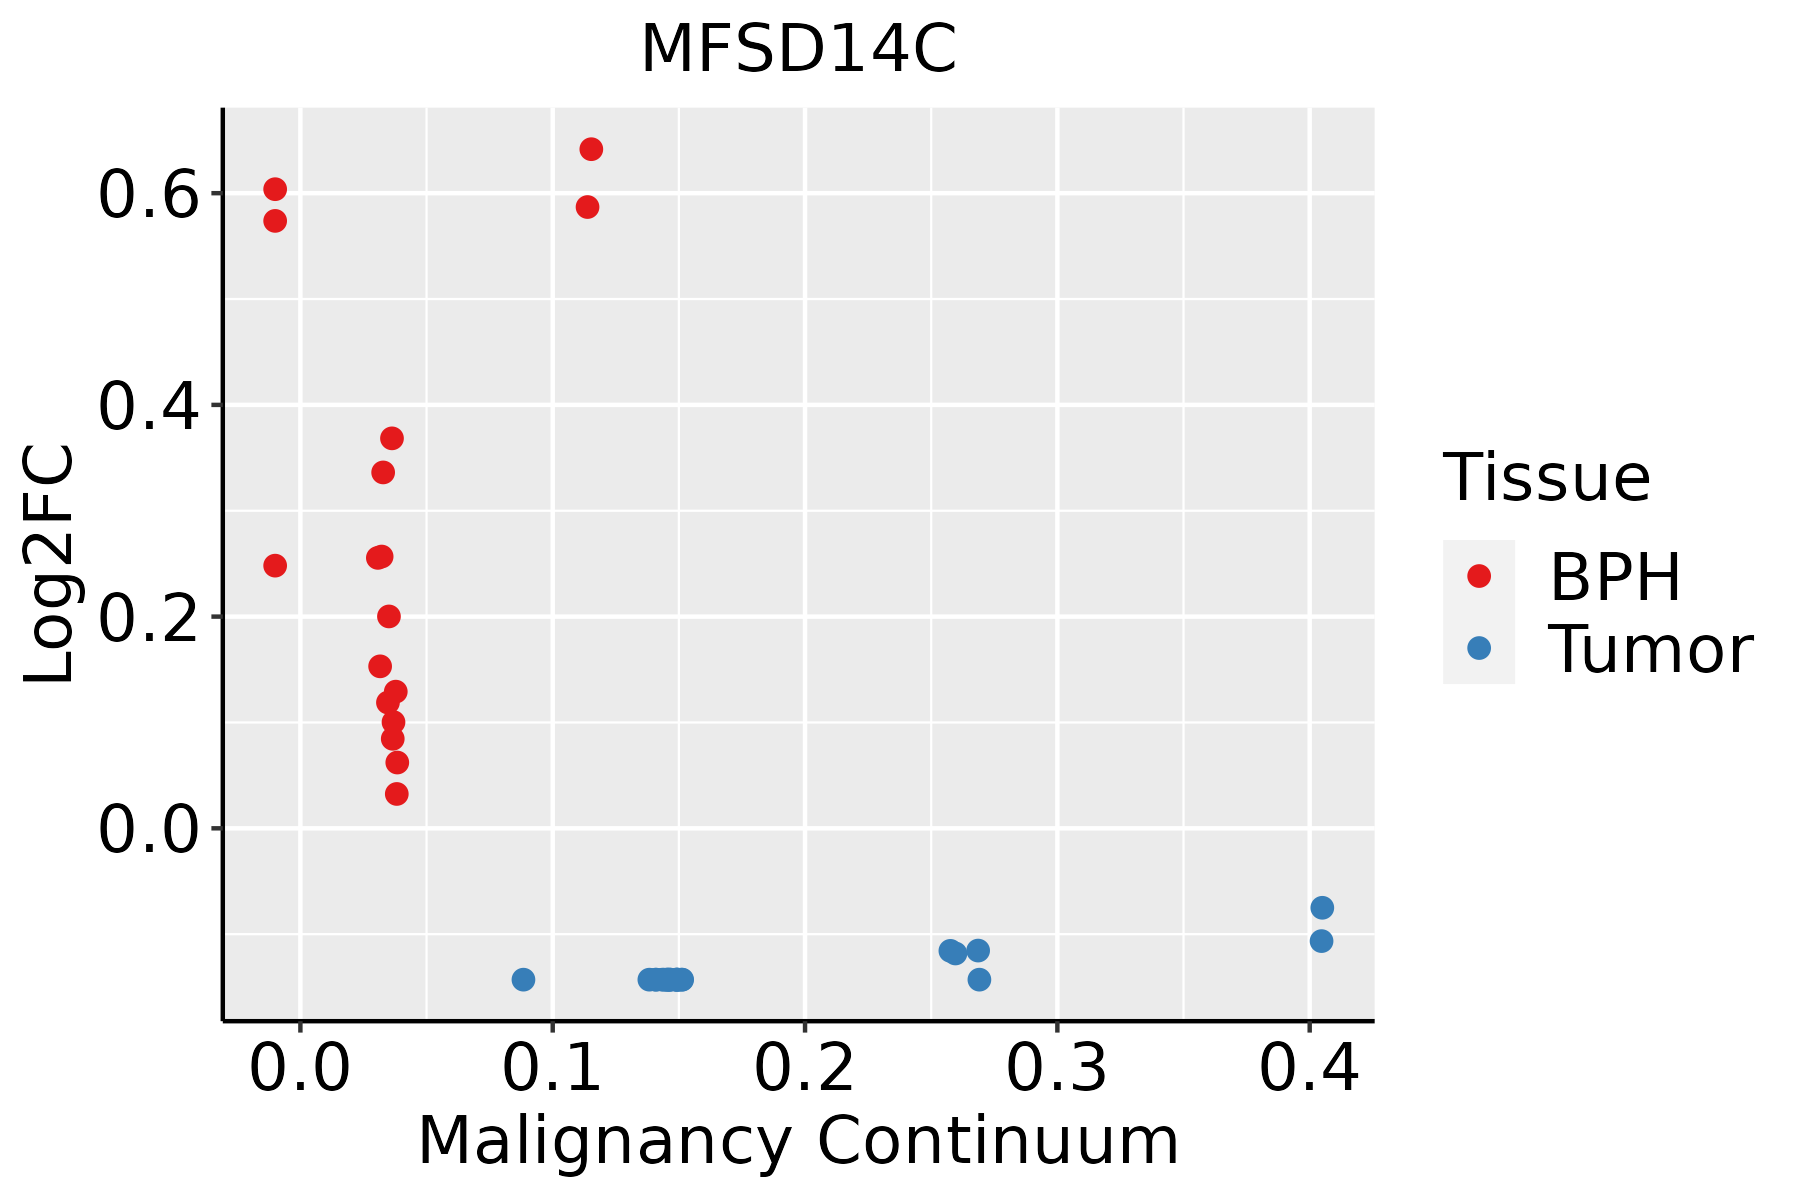 | BPH: Benign Prostatic Hyperplasia |
| Thyroid | 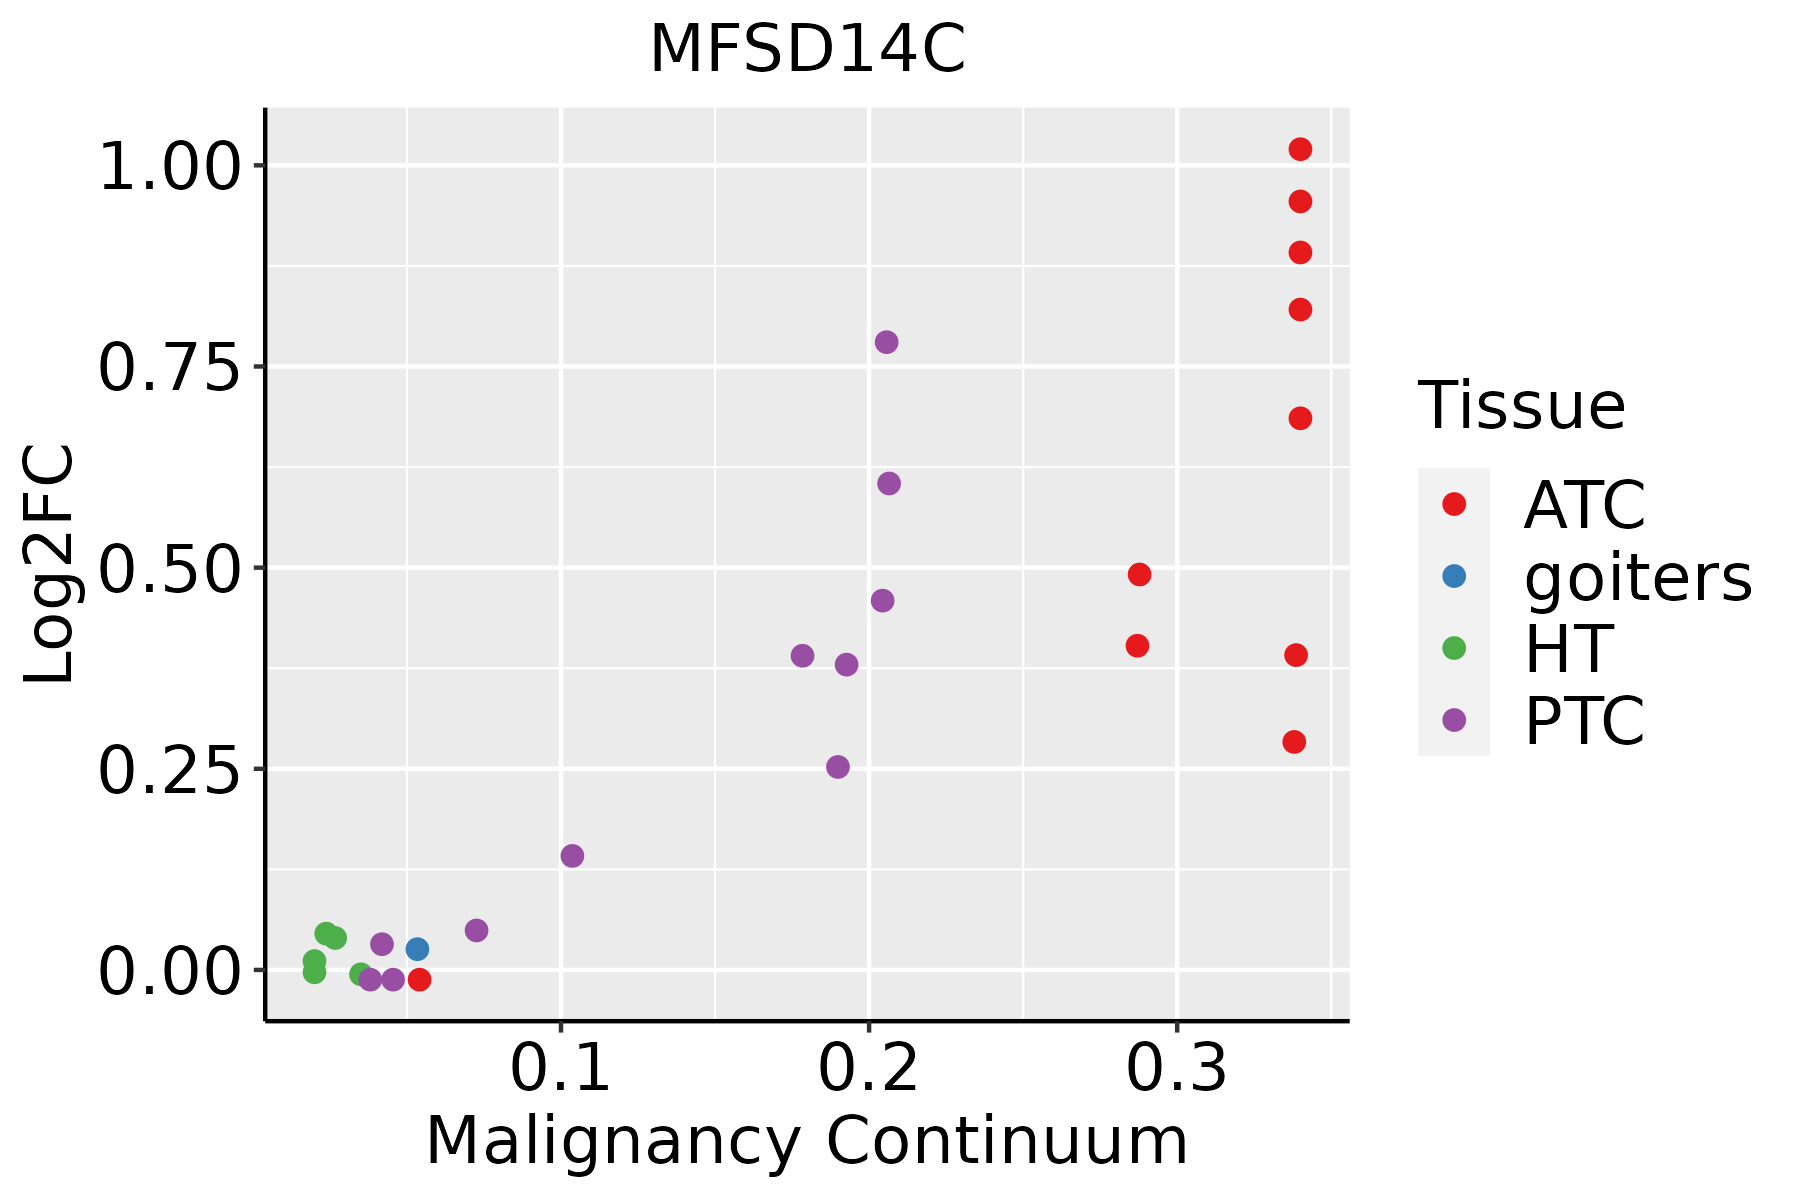 | ATC: Anaplastic thyroid cancer |
| HT: Hashimoto's thyroiditis | ||
| PTC: Papillary thyroid cancer |
| ∗log2FC in expression of this searched gene in stem-like cells from each diseased tissue sample relative to stem-like cells in normal samples in each tissue plotted against the malignancy continuum. Samples are colored based on if they are from different disease stage. |
Top |
Malignant transformation related pathway analysis |
| Find out the enriched GO biological processes and KEGG pathways involved in transition from healthy to precancer to cancer |
| Tissue | Disease Stage | Enriched GO biological Processes |
| Colorectum | AD |  |
| Colorectum | SER |  |
| Colorectum | MSS |  |
| Colorectum | MSI-H |  |
| Colorectum | FAP |  |
| ∗Top 15 enriched GO BP terms are showed in the bar plot of each disease state in each tissue. Each row represents a significant GO biological process which is colored according to the -log10(p.adjust). |
| Page: 1 2 3 4 5 6 7 8 9 |
| GO ID | Tissue | Disease Stage | Description | Gene Ratio | Bg Ratio | pvalue | p.adjust | Count |
| Page: 1 |
| Pathway ID | Tissue | Disease Stage | Description | Gene Ratio | Bg Ratio | pvalue | p.adjust | qvalue | Count |
| Page: 1 |
Top |
Cell-cell communication analysis |
| Identification of potential cell-cell interactions between two cell types and their ligand-receptor pairs for different disease states |
| Ligand | Receptor | LRpair | Pathway | Tissue | Disease Stage |
| Page: 1 |
Top |
Single-cell gene regulatory network inference analysis |
| Find out the significant the regulons (TFs) and the target genes of each regulon across cell types for different disease states |
| TF | Cell Type | Tissue | Disease Stage | Target Gene | RSS | Regulon Activity |
| ∗The dot plots of a searched regulon are shown for all cell subpopulations in each disease state of each tissue based on the regulon specific score inferred using pySCENIC and by calculating the average expression. |
| Page: 1 |
Top |
Somatic mutation of malignant transformation related genes |
| Annotation of somatic variants for genes involved in malignant transformation |
| Hugo Symbol | Variant Class | Variant Classification | dbSNP RS | HGVSc | HGVSp | HGVSp Short | SWISSPROT | BIOTYPE | SIFT | PolyPhen | Tumor Sample Barcode | Tissue | Histology | Sex | Age | Stage | Therapy Types | Drugs | Outcome |
| MFSD14C | SNV | Missense_Mutation | c.226N>G | p.Gln76Glu | p.Q76E | protein_coding | tolerated(0.5) | benign(0.011) | TCGA-D8-A1J9-01 | Breast | breast invasive carcinoma | Female | <65 | I/II | Unknown | Unknown | SD | ||
| MFSD14C | SNV | Missense_Mutation | novel | c.133G>T | p.Val45Leu | p.V45L | protein_coding | tolerated(0.07) | possibly_damaging(0.517) | TCGA-D8-A1X8-01 | Breast | breast invasive carcinoma | Female | <65 | III/IV | Chemotherapy | adrimicin+cyclophosphamide | SD | |
| MFSD14C | SNV | Missense_Mutation | c.269G>A | p.Gly90Asp | p.G90D | protein_coding | deleterious(0) | probably_damaging(0.996) | TCGA-A6-2686-01 | Colorectum | colon adenocarcinoma | Female | >=65 | I/II | Unknown | Unknown | SD | ||
| MFSD14C | SNV | Missense_Mutation | novel | c.216A>C | p.Glu72Asp | p.E72D | protein_coding | tolerated(0.22) | benign(0.099) | TCGA-AA-3984-01 | Colorectum | colon adenocarcinoma | Female | <65 | I/II | Unknown | Unknown | SD | |
| MFSD14C | SNV | Missense_Mutation | novel | c.290N>T | p.Ala97Val | p.A97V | protein_coding | deleterious(0) | probably_damaging(0.97) | TCGA-AP-A1DK-01 | Endometrium | uterine corpus endometrioid carcinoma | Female | <65 | I/II | Unknown | Unknown | SD | |
| MFSD14C | SNV | Missense_Mutation | c.208N>A | p.Leu70Ile | p.L70I | protein_coding | deleterious(0.03) | possibly_damaging(0.883) | TCGA-B5-A0JY-01 | Endometrium | uterine corpus endometrioid carcinoma | Female | <65 | III/IV | Chemotherapy | doxorubicin | SD | ||
| MFSD14C | SNV | Missense_Mutation | novel | c.367C>T | p.Pro123Ser | p.P123S | protein_coding | deleterious(0) | probably_damaging(1) | TCGA-05-4420-01 | Lung | lung adenocarcinoma | Male | <65 | I/II | Unknown | Unknown | SD | |
| MFSD14C | SNV | Missense_Mutation | novel | c.321G>T | p.Trp107Cys | p.W107C | protein_coding | deleterious(0.02) | benign(0.16) | TCGA-55-A4DG-01 | Lung | lung adenocarcinoma | Male | >=65 | I/II | Unknown | Unknown | SD | |
| MFSD14C | SNV | Missense_Mutation | novel | c.289N>A | p.Ala97Thr | p.A97T | protein_coding | tolerated(0.09) | probably_damaging(0.923) | TCGA-NK-A5CR-01 | Lung | lung squamous cell carcinoma | Male | >=65 | I/II | Unknown | Unknown | SD |
| Page: 1 |
Top |
Related drugs of malignant transformation related genes |
| Identification of chemicals and drugs interact with genes involved in malignant transfromation |
| (DGIdb 4.0) |
| Entrez ID | Symbol | Category | Interaction Types | Drug Claim Name | Drug Name | PMIDs |
| Page: 1 |

Copyright 2023-Present -The University of Texas Health Science Center at Houston |