
|
|||||
|
 | |
| |
| |
| |
| |
| |
|
Gene: MFSD14A |
Gene summary for MFSD14A |
| Gene information | Species | Human | Gene symbol | MFSD14A | Gene ID | 64645 |
| Gene name | major facilitator superfamily domain containing 14A | |
| Gene Alias | HIAT1 | |
| Cytomap | 1p21.2 | |
| Gene Type | protein-coding | GO ID | GO:0000003 | UniProtAcc | Q96MC6 |
Top |
Malignant transformation analysis |
| Identification of the aberrant gene expression in precancerous and cancerous lesions by comparing the gene expression of stem-like cells in diseased tissues with normal stem cells |
| Entrez ID | Symbol | Replicates | Species | Organ | Tissue | Adj P-value | Log2FC | Malignancy |
| 64645 | MFSD14A | LZE4T | Human | Esophagus | ESCC | 1.66e-08 | 1.75e-01 | 0.0811 |
| 64645 | MFSD14A | LZE7T | Human | Esophagus | ESCC | 2.47e-06 | 6.28e-01 | 0.0667 |
| 64645 | MFSD14A | LZE8T | Human | Esophagus | ESCC | 3.06e-05 | 2.21e-01 | 0.067 |
| 64645 | MFSD14A | LZE22D1 | Human | Esophagus | HGIN | 3.91e-02 | 1.55e-02 | 0.0595 |
| 64645 | MFSD14A | LZE24T | Human | Esophagus | ESCC | 1.57e-12 | 2.10e-01 | 0.0596 |
| 64645 | MFSD14A | LZE21T | Human | Esophagus | ESCC | 2.41e-02 | 5.92e-02 | 0.0655 |
| 64645 | MFSD14A | LZE6T | Human | Esophagus | ESCC | 3.09e-09 | 4.08e-02 | 0.0845 |
| 64645 | MFSD14A | P1T-E | Human | Esophagus | ESCC | 1.37e-07 | 1.58e-01 | 0.0875 |
| 64645 | MFSD14A | P2T-E | Human | Esophagus | ESCC | 2.47e-23 | 5.75e-01 | 0.1177 |
| 64645 | MFSD14A | P4T-E | Human | Esophagus | ESCC | 2.00e-14 | 3.69e-01 | 0.1323 |
| 64645 | MFSD14A | P5T-E | Human | Esophagus | ESCC | 5.17e-17 | 3.95e-01 | 0.1327 |
| 64645 | MFSD14A | P8T-E | Human | Esophagus | ESCC | 2.35e-19 | 3.51e-01 | 0.0889 |
| 64645 | MFSD14A | P9T-E | Human | Esophagus | ESCC | 7.05e-08 | 2.06e-01 | 0.1131 |
| 64645 | MFSD14A | P10T-E | Human | Esophagus | ESCC | 1.44e-28 | 6.63e-01 | 0.116 |
| 64645 | MFSD14A | P11T-E | Human | Esophagus | ESCC | 4.21e-13 | 5.67e-01 | 0.1426 |
| 64645 | MFSD14A | P12T-E | Human | Esophagus | ESCC | 5.27e-32 | 9.99e-01 | 0.1122 |
| 64645 | MFSD14A | P15T-E | Human | Esophagus | ESCC | 2.25e-24 | 3.47e-01 | 0.1149 |
| 64645 | MFSD14A | P16T-E | Human | Esophagus | ESCC | 1.04e-18 | 2.70e-01 | 0.1153 |
| 64645 | MFSD14A | P17T-E | Human | Esophagus | ESCC | 2.03e-02 | 1.47e-01 | 0.1278 |
| 64645 | MFSD14A | P19T-E | Human | Esophagus | ESCC | 1.08e-03 | 1.94e-01 | 0.1662 |
| Page: 1 2 3 4 |
| Tissue | Expression Dynamics | Abbreviation |
| Esophagus | 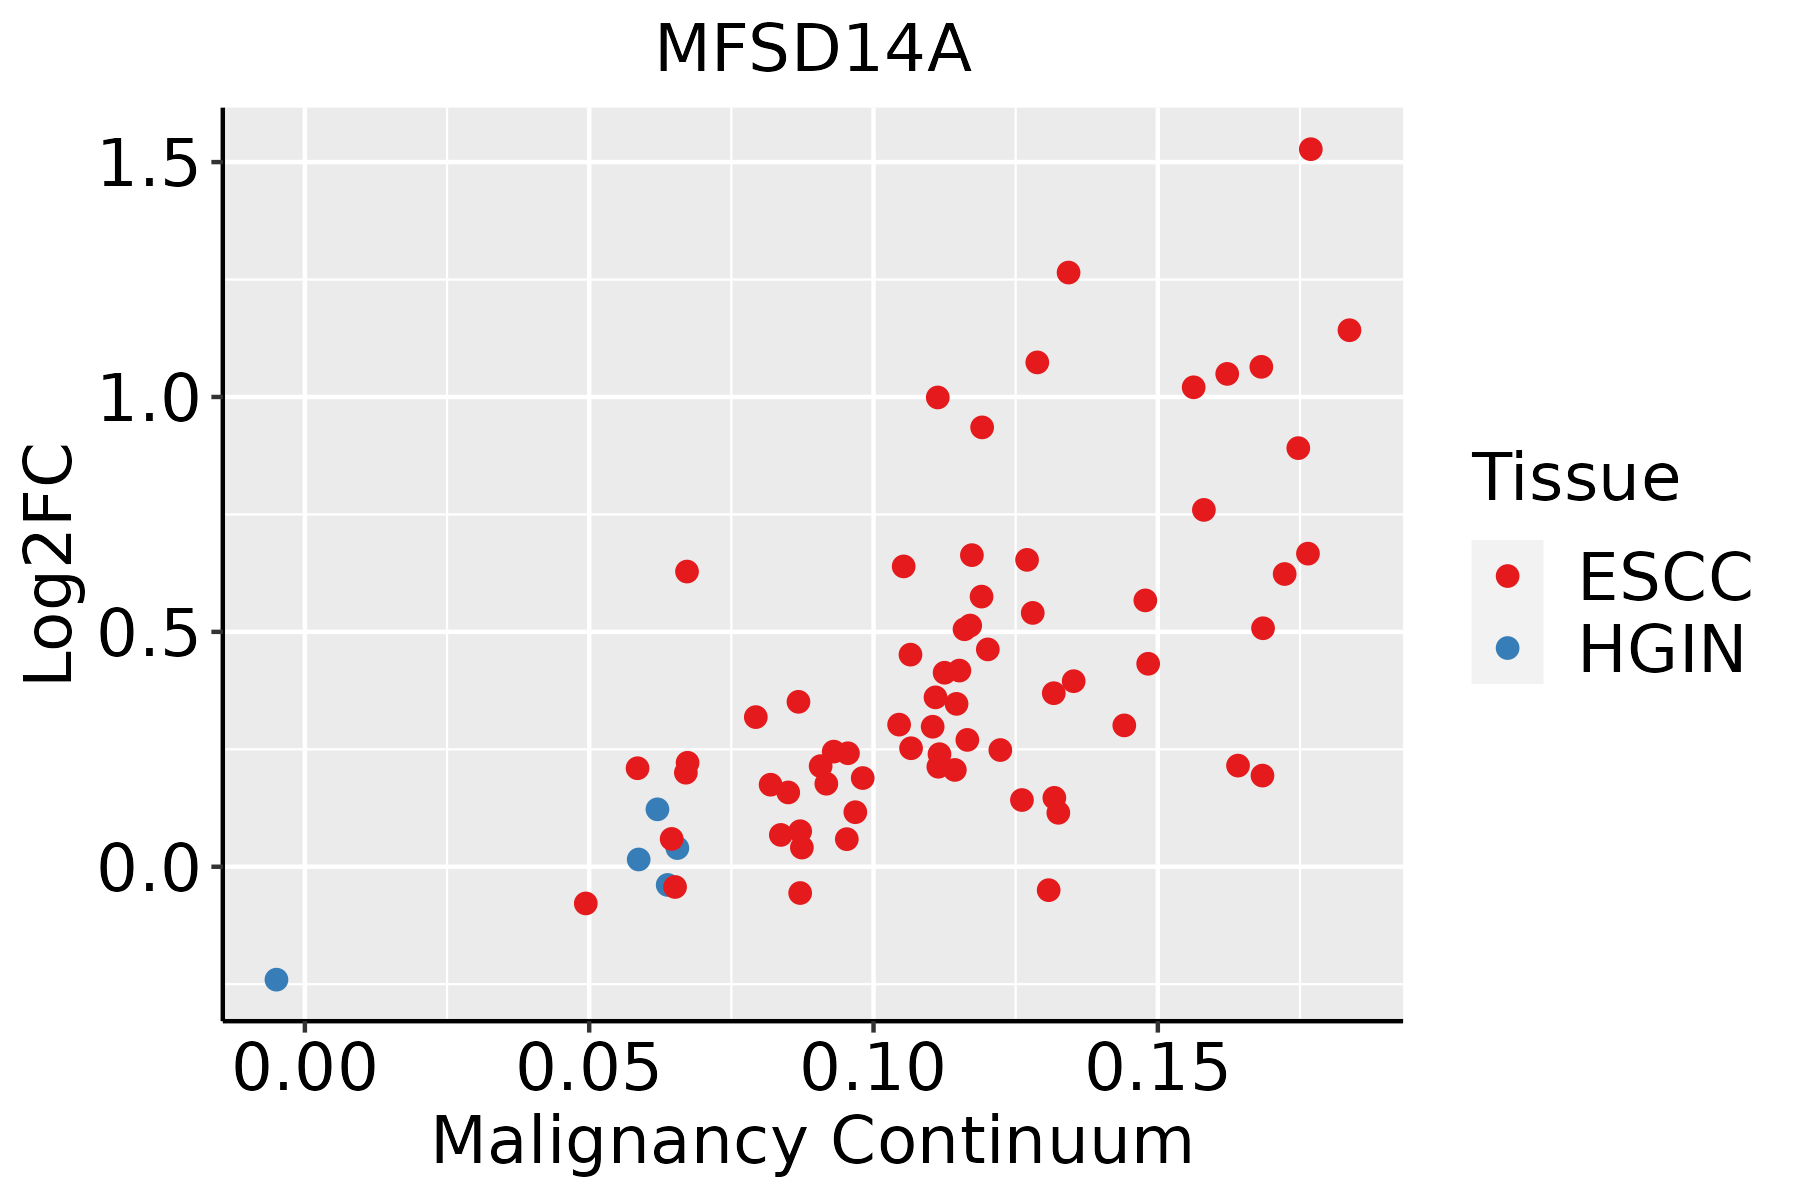 | ESCC: Esophageal squamous cell carcinoma |
| HGIN: High-grade intraepithelial neoplasias | ||
| LGIN: Low-grade intraepithelial neoplasias | ||
| Oral Cavity | 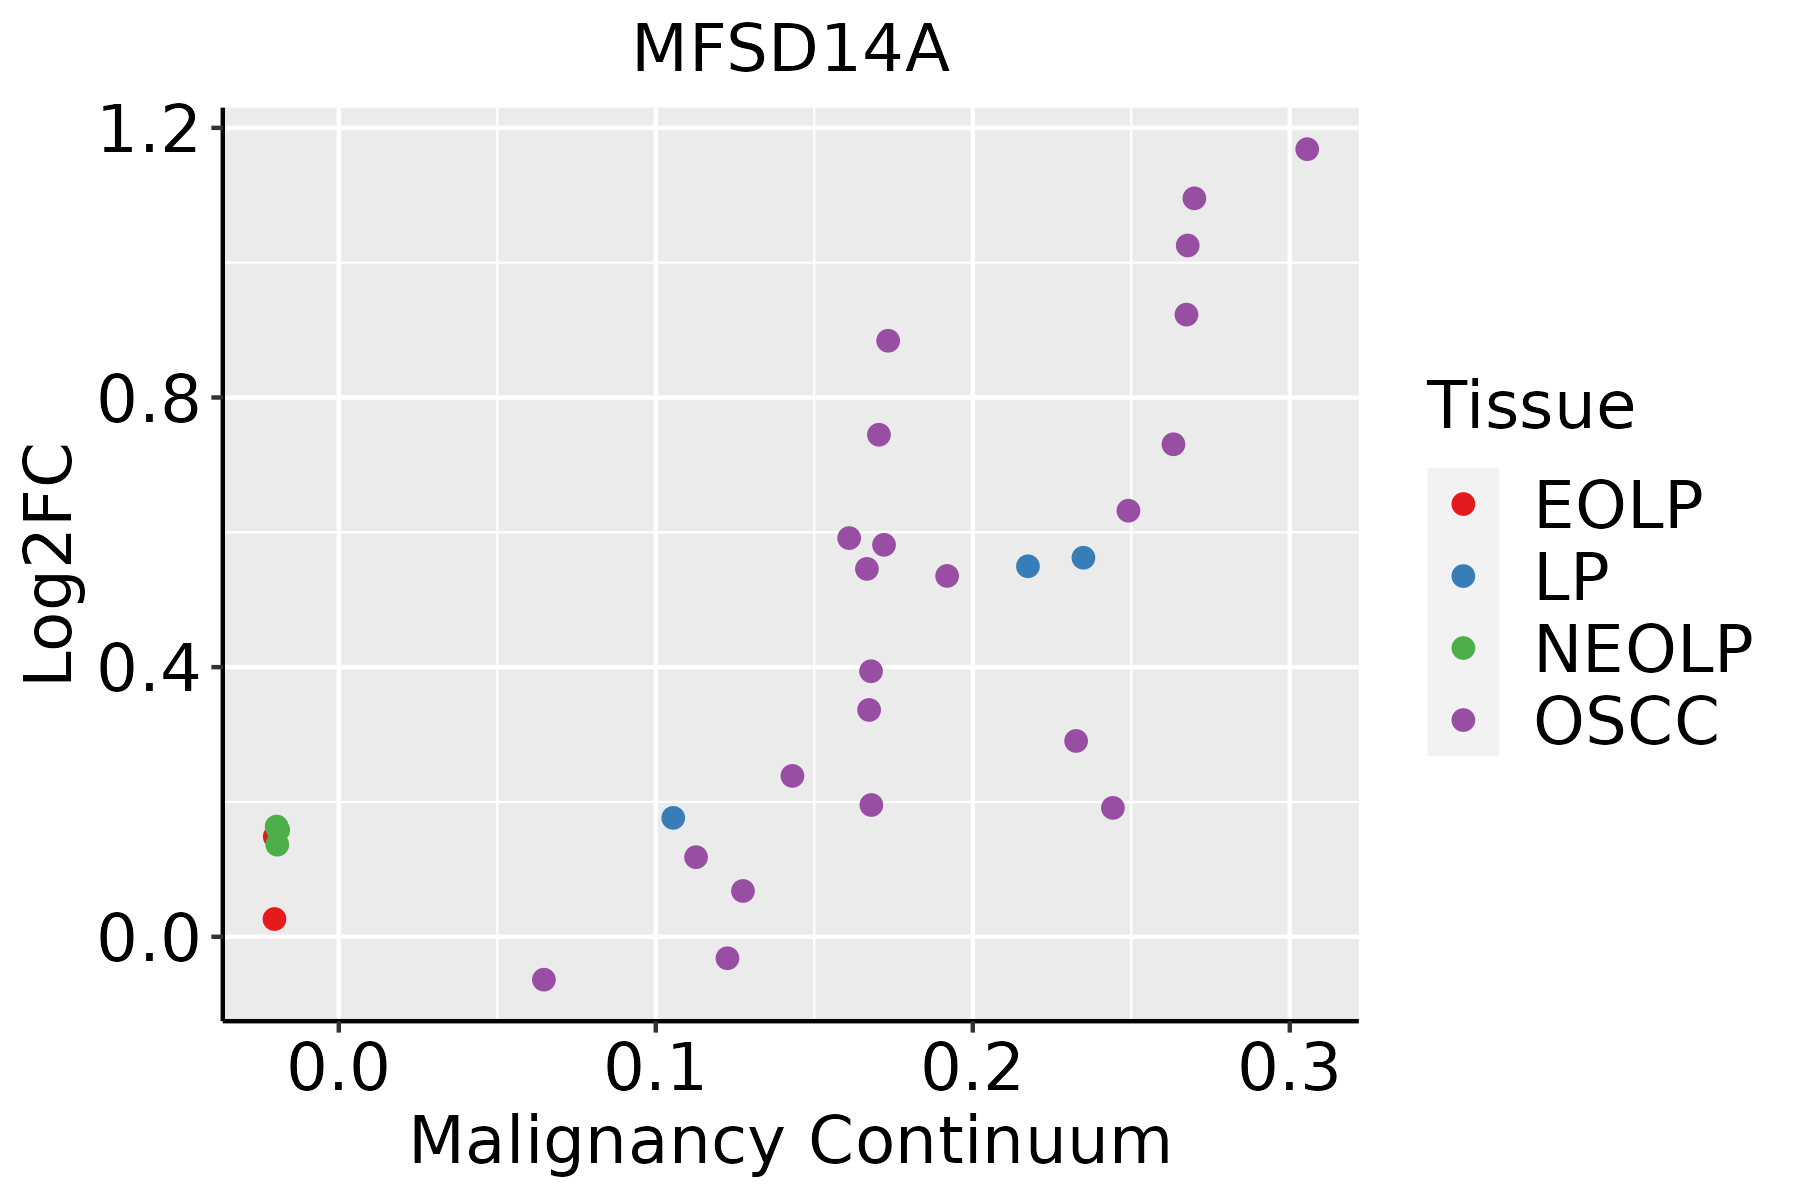 | EOLP: Erosive Oral lichen planus |
| LP: leukoplakia | ||
| NEOLP: Non-erosive oral lichen planus | ||
| OSCC: Oral squamous cell carcinoma |
| ∗log2FC in expression of this searched gene in stem-like cells from each diseased tissue sample relative to stem-like cells in normal samples in each tissue plotted against the malignancy continuum. Samples are colored based on if they are from different disease stage. |
Top |
Malignant transformation related pathway analysis |
| Find out the enriched GO biological processes and KEGG pathways involved in transition from healthy to precancer to cancer |
| Tissue | Disease Stage | Enriched GO biological Processes |
| Colorectum | AD |  |
| Colorectum | SER |  |
| Colorectum | MSS |  |
| Colorectum | MSI-H |  |
| Colorectum | FAP |  |
| ∗Top 15 enriched GO BP terms are showed in the bar plot of each disease state in each tissue. Each row represents a significant GO biological process which is colored according to the -log10(p.adjust). |
| Page: 1 2 3 4 5 6 7 8 9 |
| GO ID | Tissue | Disease Stage | Description | Gene Ratio | Bg Ratio | pvalue | p.adjust | Count |
| GO:00160509 | Esophagus | HGIN | vesicle organization | 65/2587 | 300/18723 | 1.24e-04 | 2.54e-03 | 65 |
| GO:00069975 | Esophagus | HGIN | nucleus organization | 34/2587 | 133/18723 | 2.20e-04 | 4.00e-03 | 34 |
| GO:001605014 | Esophagus | ESCC | vesicle organization | 211/8552 | 300/18723 | 2.85e-18 | 2.87e-16 | 211 |
| GO:000699713 | Esophagus | ESCC | nucleus organization | 96/8552 | 133/18723 | 4.66e-10 | 1.21e-08 | 96 |
| GO:00160508 | Oral cavity | OSCC | vesicle organization | 189/7305 | 300/18723 | 2.40e-17 | 2.14e-15 | 189 |
| GO:00069974 | Oral cavity | OSCC | nucleus organization | 85/7305 | 133/18723 | 5.12e-09 | 1.12e-07 | 85 |
| GO:001605022 | Oral cavity | EOLP | vesicle organization | 65/2218 | 300/18723 | 8.62e-07 | 2.15e-05 | 65 |
| GO:000699721 | Oral cavity | EOLP | nucleus organization | 29/2218 | 133/18723 | 7.82e-04 | 6.24e-03 | 29 |
| Page: 1 |
| Pathway ID | Tissue | Disease Stage | Description | Gene Ratio | Bg Ratio | pvalue | p.adjust | qvalue | Count |
| Page: 1 |
Top |
Cell-cell communication analysis |
| Identification of potential cell-cell interactions between two cell types and their ligand-receptor pairs for different disease states |
| Ligand | Receptor | LRpair | Pathway | Tissue | Disease Stage |
| Page: 1 |
Top |
Single-cell gene regulatory network inference analysis |
| Find out the significant the regulons (TFs) and the target genes of each regulon across cell types for different disease states |
| TF | Cell Type | Tissue | Disease Stage | Target Gene | RSS | Regulon Activity |
| ∗The dot plots of a searched regulon are shown for all cell subpopulations in each disease state of each tissue based on the regulon specific score inferred using pySCENIC and by calculating the average expression. |
| Page: 1 |
Top |
Somatic mutation of malignant transformation related genes |
| Annotation of somatic variants for genes involved in malignant transformation |
| Hugo Symbol | Variant Class | Variant Classification | dbSNP RS | HGVSc | HGVSp | HGVSp Short | SWISSPROT | BIOTYPE | SIFT | PolyPhen | Tumor Sample Barcode | Tissue | Histology | Sex | Age | Stage | Therapy Types | Drugs | Outcome |
| MFSD14A | SNV | Missense_Mutation | c.844N>C | p.Val282Leu | p.V282L | Q96MC6 | protein_coding | tolerated(0.2) | benign(0.162) | TCGA-A7-A0DA-01 | Breast | breast invasive carcinoma | Female | <65 | I/II | Chemotherapy | adriamycin | SD | |
| MFSD14A | deletion | Frame_Shift_Del | novel | c.17delA | p.Lys6ArgfsTer27 | p.K6Rfs*27 | Q96MC6 | protein_coding | TCGA-D8-A27V-01 | Breast | breast invasive carcinoma | Female | <65 | I/II | Hormone Therapy | tamoxiphen | SD | ||
| MFSD14A | SNV | Missense_Mutation | novel | c.53C>T | p.Ala18Val | p.A18V | Q96MC6 | protein_coding | tolerated(0.38) | benign(0.021) | TCGA-2W-A8YY-01 | Cervix | cervical & endocervical cancer | Female | <65 | I/II | Chemotherapy | cisplatin | CR |
| MFSD14A | SNV | Missense_Mutation | c.767N>A | p.Ser256Tyr | p.S256Y | Q96MC6 | protein_coding | deleterious(0) | probably_damaging(0.934) | TCGA-EK-A2PL-01 | Cervix | cervical & endocervical cancer | Female | <65 | III/IV | Unknown | Unknown | SD | |
| MFSD14A | SNV | Missense_Mutation | novel | c.1273N>G | p.Ile425Val | p.I425V | Q96MC6 | protein_coding | tolerated(0.73) | benign(0.009) | TCGA-VS-A8EH-01 | Cervix | cervical & endocervical cancer | Female | <65 | III/IV | Chemotherapy | cisplatin | CR |
| MFSD14A | deletion | Frame_Shift_Del | rs780635289 | c.806delT | p.Leu269TyrfsTer6 | p.L269Yfs*6 | Q96MC6 | protein_coding | TCGA-EA-A3HU-01 | Cervix | cervical & endocervical cancer | Female | <65 | I/II | Unknown | Unknown | SD | ||
| MFSD14A | deletion | Frame_Shift_Del | rs780635289 | c.799delN | p.Leu269TyrfsTer6 | p.L269Yfs*6 | Q96MC6 | protein_coding | TCGA-VS-A94Z-01 | Cervix | cervical & endocervical cancer | Female | <65 | I/II | Chemotherapy | cisplatin | CR | ||
| MFSD14A | SNV | Missense_Mutation | c.1141T>C | p.Cys381Arg | p.C381R | Q96MC6 | protein_coding | deleterious(0) | probably_damaging(0.998) | TCGA-A6-6652-01 | Colorectum | colon adenocarcinoma | Male | <65 | I/II | Targeted Molecular therapy | cetuximab | SD | |
| MFSD14A | deletion | Frame_Shift_Del | rs780635289 | c.799delN | p.Leu269TyrfsTer6 | p.L269Yfs*6 | Q96MC6 | protein_coding | TCGA-A6-6780-01 | Colorectum | colon adenocarcinoma | Male | >=65 | I/II | Unknown | Unknown | SD | ||
| MFSD14A | deletion | Frame_Shift_Del | rs780635289 | c.799delN | p.Leu269TyrfsTer6 | p.L269Yfs*6 | Q96MC6 | protein_coding | TCGA-AA-3715-01 | Colorectum | colon adenocarcinoma | Male | >=65 | I/II | Unknown | Unknown | PD |
| Page: 1 2 3 4 5 6 7 |
Top |
Related drugs of malignant transformation related genes |
| Identification of chemicals and drugs interact with genes involved in malignant transfromation |
| (DGIdb 4.0) |
| Entrez ID | Symbol | Category | Interaction Types | Drug Claim Name | Drug Name | PMIDs |
| Page: 1 |

Copyright 2023-Present -The University of Texas Health Science Center at Houston |