
|
|||||
|
 | |
| |
| |
| |
| |
| |
|
Gene: MFSD13A |
Gene summary for MFSD13A |
| Gene information | Species | Human | Gene symbol | MFSD13A | Gene ID | 79847 |
| Gene name | major facilitator superfamily domain containing 13A | |
| Gene Alias | C10orf77 | |
| Cytomap | 10q24.32 | |
| Gene Type | protein-coding | GO ID | GO:0005575 | UniProtAcc | Q14CX5 |
Top |
Malignant transformation analysis |
| Identification of the aberrant gene expression in precancerous and cancerous lesions by comparing the gene expression of stem-like cells in diseased tissues with normal stem cells |
| Entrez ID | Symbol | Replicates | Species | Organ | Tissue | Adj P-value | Log2FC | Malignancy |
| 79847 | MFSD13A | HCC1_Meng | Human | Liver | HCC | 3.63e-07 | -2.90e-03 | 0.0246 |
| 79847 | MFSD13A | HCC2_Meng | Human | Liver | HCC | 8.18e-06 | 5.36e-02 | 0.0107 |
| 79847 | MFSD13A | HCC2 | Human | Liver | HCC | 3.29e-02 | 1.85e+00 | 0.5341 |
| 79847 | MFSD13A | S014 | Human | Liver | HCC | 2.86e-11 | 3.92e-01 | 0.2254 |
| 79847 | MFSD13A | S015 | Human | Liver | HCC | 5.28e-17 | 6.70e-01 | 0.2375 |
| 79847 | MFSD13A | S016 | Human | Liver | HCC | 1.07e-21 | 5.42e-01 | 0.2243 |
| 79847 | MFSD13A | S028 | Human | Liver | HCC | 2.00e-09 | 2.64e-01 | 0.2503 |
| 79847 | MFSD13A | S029 | Human | Liver | HCC | 3.31e-03 | 2.03e-01 | 0.2581 |
| Page: 1 |
| Tissue | Expression Dynamics | Abbreviation |
| Liver | 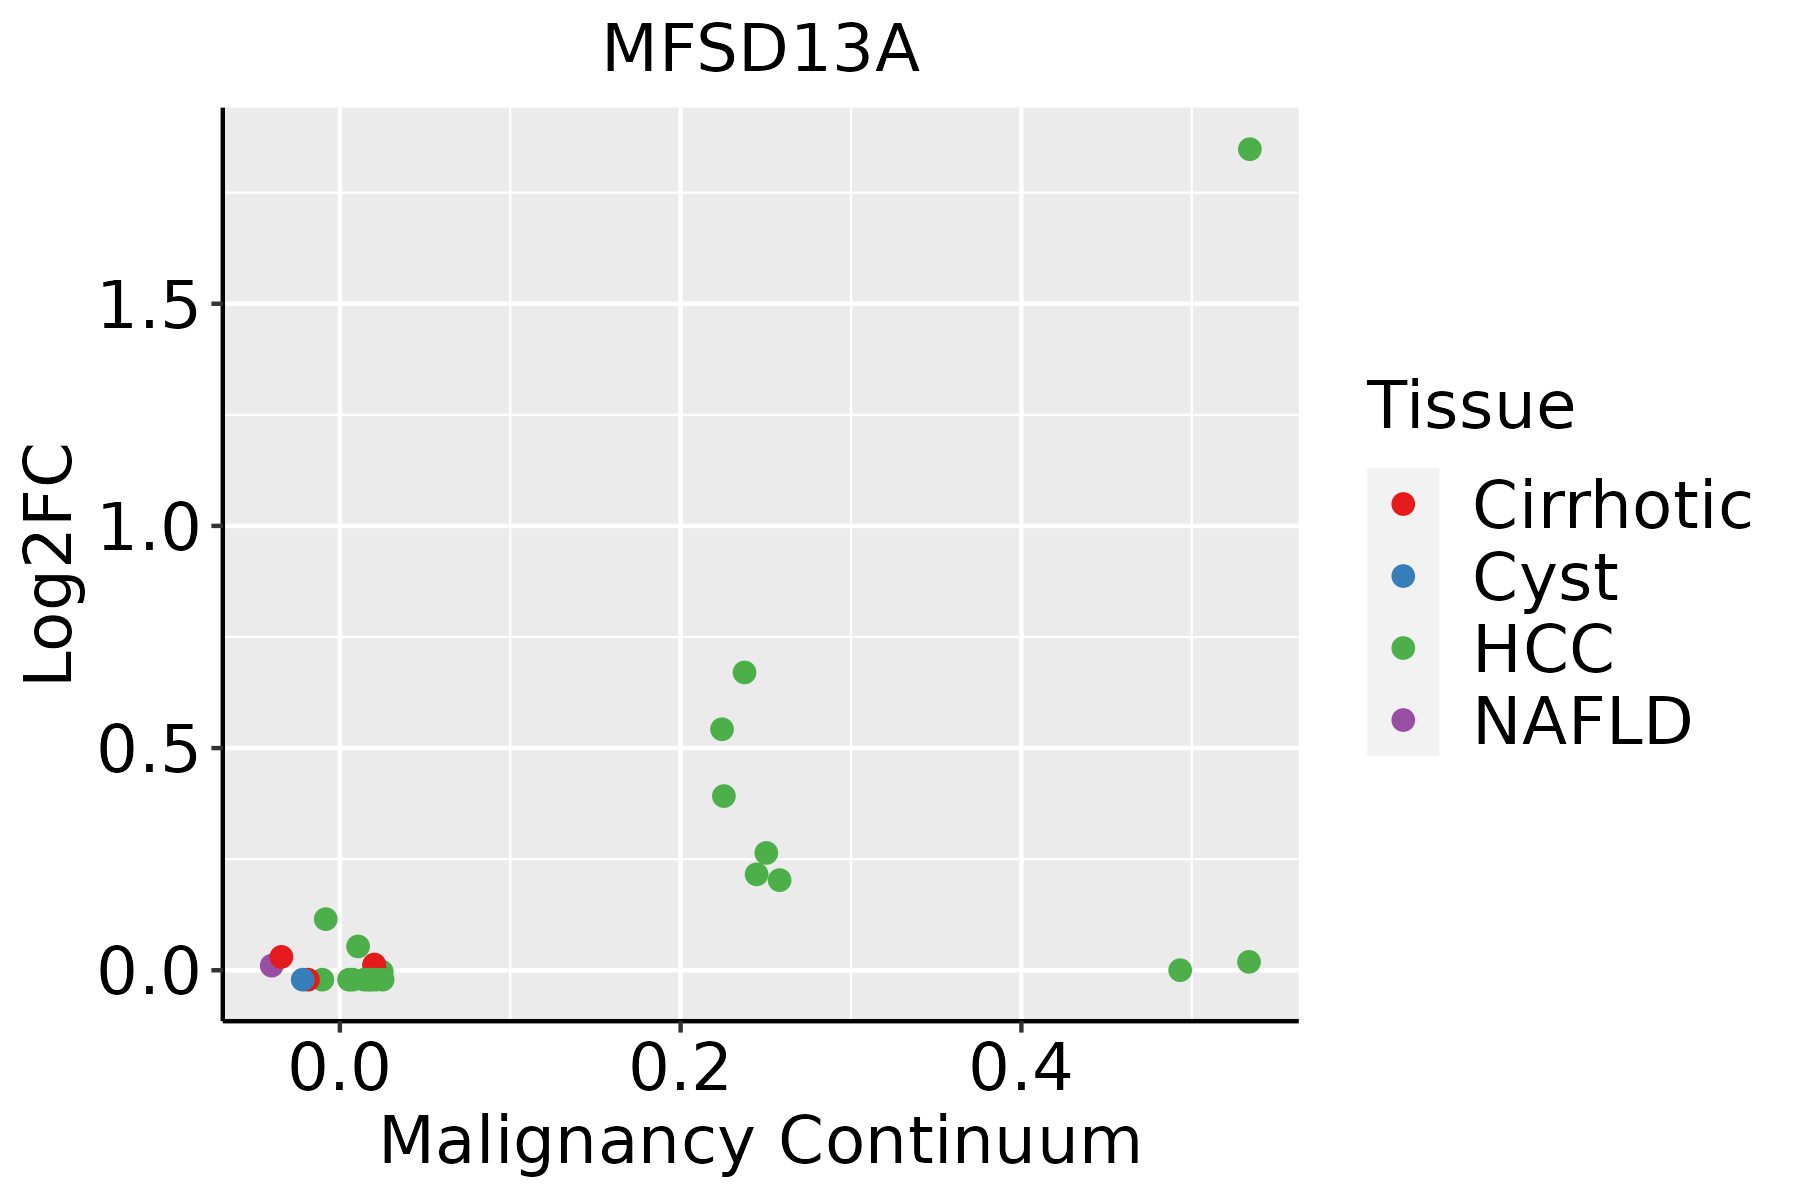 | HCC: Hepatocellular carcinoma |
| NAFLD: Non-alcoholic fatty liver disease |
| ∗log2FC in expression of this searched gene in stem-like cells from each diseased tissue sample relative to stem-like cells in normal samples in each tissue plotted against the malignancy continuum. Samples are colored based on if they are from different disease stage. |
Top |
Malignant transformation related pathway analysis |
| Find out the enriched GO biological processes and KEGG pathways involved in transition from healthy to precancer to cancer |
| Tissue | Disease Stage | Enriched GO biological Processes |
| Colorectum | AD |  |
| Colorectum | SER |  |
| Colorectum | MSS |  |
| Colorectum | MSI-H |  |
| Colorectum | FAP |  |
| ∗Top 15 enriched GO BP terms are showed in the bar plot of each disease state in each tissue. Each row represents a significant GO biological process which is colored according to the -log10(p.adjust). |
| Page: 1 2 3 4 5 6 7 8 9 |
| GO ID | Tissue | Disease Stage | Description | Gene Ratio | Bg Ratio | pvalue | p.adjust | Count |
| Page: 1 |
| Pathway ID | Tissue | Disease Stage | Description | Gene Ratio | Bg Ratio | pvalue | p.adjust | qvalue | Count |
| Page: 1 |
Top |
Cell-cell communication analysis |
| Identification of potential cell-cell interactions between two cell types and their ligand-receptor pairs for different disease states |
| Ligand | Receptor | LRpair | Pathway | Tissue | Disease Stage |
| Page: 1 |
Top |
Single-cell gene regulatory network inference analysis |
| Find out the significant the regulons (TFs) and the target genes of each regulon across cell types for different disease states |
| TF | Cell Type | Tissue | Disease Stage | Target Gene | RSS | Regulon Activity |
| ∗The dot plots of a searched regulon are shown for all cell subpopulations in each disease state of each tissue based on the regulon specific score inferred using pySCENIC and by calculating the average expression. |
| Page: 1 |
Top |
Somatic mutation of malignant transformation related genes |
| Annotation of somatic variants for genes involved in malignant transformation |
| Hugo Symbol | Variant Class | Variant Classification | dbSNP RS | HGVSc | HGVSp | HGVSp Short | SWISSPROT | BIOTYPE | SIFT | PolyPhen | Tumor Sample Barcode | Tissue | Histology | Sex | Age | Stage | Therapy Types | Drugs | Outcome |
| MFSD13A | SNV | Missense_Mutation | rs745953305 | c.665N>A | p.Arg222Gln | p.R222Q | Q14CX5 | protein_coding | tolerated(0.58) | benign(0.096) | TCGA-AO-A1KT-01 | Breast | breast invasive carcinoma | Female | >=65 | I/II | Chemotherapy | fluorouracil | SD |
| MFSD13A | SNV | Missense_Mutation | c.769N>T | p.Leu257Phe | p.L257F | Q14CX5 | protein_coding | tolerated(0.11) | benign(0.25) | TCGA-D8-A27G-01 | Breast | breast invasive carcinoma | Female | >=65 | I/II | Unknown | Unknown | SD | |
| MFSD13A | SNV | Missense_Mutation | c.769N>T | p.Leu257Phe | p.L257F | Q14CX5 | protein_coding | tolerated(0.11) | benign(0.25) | TCGA-C5-A2LZ-01 | Cervix | cervical & endocervical cancer | Female | >=65 | III/IV | Unknown | Unknown | PD | |
| MFSD13A | SNV | Missense_Mutation | rs200975256 | c.335N>T | p.Ser112Leu | p.S112L | Q14CX5 | protein_coding | deleterious(0) | possibly_damaging(0.65) | TCGA-A6-A565-01 | Colorectum | colon adenocarcinoma | Female | <65 | III/IV | Unspecific | 5FU | PD |
| MFSD13A | SNV | Missense_Mutation | c.1073N>T | p.Ser358Ile | p.S358I | Q14CX5 | protein_coding | tolerated(0.38) | benign(0.003) | TCGA-AA-3949-01 | Colorectum | colon adenocarcinoma | Female | >=65 | III/IV | Unknown | Unknown | SD | |
| MFSD13A | SNV | Missense_Mutation | rs775779303 | c.1253N>T | p.Ala418Val | p.A418V | Q14CX5 | protein_coding | deleterious(0) | probably_damaging(1) | TCGA-AA-3950-01 | Colorectum | colon adenocarcinoma | Female | >=65 | I/II | Unknown | Unknown | SD |
| MFSD13A | SNV | Missense_Mutation | rs745953305 | c.665N>A | p.Arg222Gln | p.R222Q | Q14CX5 | protein_coding | tolerated(0.58) | benign(0.096) | TCGA-AA-A00N-01 | Colorectum | colon adenocarcinoma | Male | >=65 | I/II | Unknown | Unknown | PD |
| MFSD13A | SNV | Missense_Mutation | rs770923282 | c.329N>T | p.Ala110Val | p.A110V | Q14CX5 | protein_coding | deleterious(0) | possibly_damaging(0.46) | TCGA-AA-A01D-01 | Colorectum | colon adenocarcinoma | Female | <65 | III/IV | Chemotherapy | capecitabine | PD |
| MFSD13A | SNV | Missense_Mutation | rs371763710 | c.982N>T | p.Arg328Cys | p.R328C | Q14CX5 | protein_coding | deleterious(0) | probably_damaging(0.976) | TCGA-CK-4951-01 | Colorectum | colon adenocarcinoma | Female | >=65 | I/II | Unknown | Unknown | PD |
| MFSD13A | SNV | Missense_Mutation | rs145950496 | c.1102N>T | p.Arg368Cys | p.R368C | Q14CX5 | protein_coding | deleterious(0) | probably_damaging(1) | TCGA-CM-5863-01 | Colorectum | colon adenocarcinoma | Female | <65 | III/IV | Chemotherapy | oxaliplatin | SD |
| Page: 1 2 3 4 |
Top |
Related drugs of malignant transformation related genes |
| Identification of chemicals and drugs interact with genes involved in malignant transfromation |
| (DGIdb 4.0) |
| Entrez ID | Symbol | Category | Interaction Types | Drug Claim Name | Drug Name | PMIDs |
| Page: 1 |

Copyright 2023-Present -The University of Texas Health Science Center at Houston |