
|
|||||
|
 | |
| |
| |
| |
| |
| |
|
Gene: MFSD12 |
Gene summary for MFSD12 |
| Gene information | Species | Human | Gene symbol | MFSD12 | Gene ID | 126321 |
| Gene name | major facilitator superfamily domain containing 12 | |
| Gene Alias | C19orf28 | |
| Cytomap | 19p13.3 | |
| Gene Type | protein-coding | GO ID | GO:0000101 | UniProtAcc | Q6NUT3 |
Top |
Malignant transformation analysis |
| Identification of the aberrant gene expression in precancerous and cancerous lesions by comparing the gene expression of stem-like cells in diseased tissues with normal stem cells |
| Entrez ID | Symbol | Replicates | Species | Organ | Tissue | Adj P-value | Log2FC | Malignancy |
| 126321 | MFSD12 | LZE24T | Human | Esophagus | ESCC | 8.73e-08 | 7.93e-02 | 0.0596 |
| 126321 | MFSD12 | P4T-E | Human | Esophagus | ESCC | 1.22e-09 | 1.66e-01 | 0.1323 |
| 126321 | MFSD12 | P5T-E | Human | Esophagus | ESCC | 5.24e-07 | 1.41e-01 | 0.1327 |
| 126321 | MFSD12 | P9T-E | Human | Esophagus | ESCC | 5.66e-10 | 3.12e-01 | 0.1131 |
| 126321 | MFSD12 | P10T-E | Human | Esophagus | ESCC | 8.74e-05 | 5.17e-02 | 0.116 |
| 126321 | MFSD12 | P11T-E | Human | Esophagus | ESCC | 5.38e-10 | 2.66e-01 | 0.1426 |
| 126321 | MFSD12 | P15T-E | Human | Esophagus | ESCC | 2.97e-02 | 6.68e-02 | 0.1149 |
| 126321 | MFSD12 | P17T-E | Human | Esophagus | ESCC | 4.86e-15 | 6.81e-01 | 0.1278 |
| 126321 | MFSD12 | P19T-E | Human | Esophagus | ESCC | 2.60e-09 | 6.65e-01 | 0.1662 |
| 126321 | MFSD12 | P20T-E | Human | Esophagus | ESCC | 1.15e-04 | 5.84e-02 | 0.1124 |
| 126321 | MFSD12 | P21T-E | Human | Esophagus | ESCC | 5.04e-08 | 2.30e-01 | 0.1617 |
| 126321 | MFSD12 | P23T-E | Human | Esophagus | ESCC | 3.17e-10 | 2.14e-01 | 0.108 |
| 126321 | MFSD12 | P24T-E | Human | Esophagus | ESCC | 1.79e-09 | 2.73e-01 | 0.1287 |
| 126321 | MFSD12 | P26T-E | Human | Esophagus | ESCC | 1.18e-14 | 1.05e-01 | 0.1276 |
| 126321 | MFSD12 | P27T-E | Human | Esophagus | ESCC | 1.26e-04 | 9.05e-02 | 0.1055 |
| 126321 | MFSD12 | P28T-E | Human | Esophagus | ESCC | 3.42e-29 | 5.72e-01 | 0.1149 |
| 126321 | MFSD12 | P30T-E | Human | Esophagus | ESCC | 1.36e-08 | 3.59e-01 | 0.137 |
| 126321 | MFSD12 | P31T-E | Human | Esophagus | ESCC | 7.13e-06 | 1.85e-01 | 0.1251 |
| 126321 | MFSD12 | P32T-E | Human | Esophagus | ESCC | 1.42e-20 | 4.30e-01 | 0.1666 |
| 126321 | MFSD12 | P36T-E | Human | Esophagus | ESCC | 1.66e-10 | 2.55e-01 | 0.1187 |
| Page: 1 2 3 4 5 |
| Tissue | Expression Dynamics | Abbreviation |
| Esophagus | 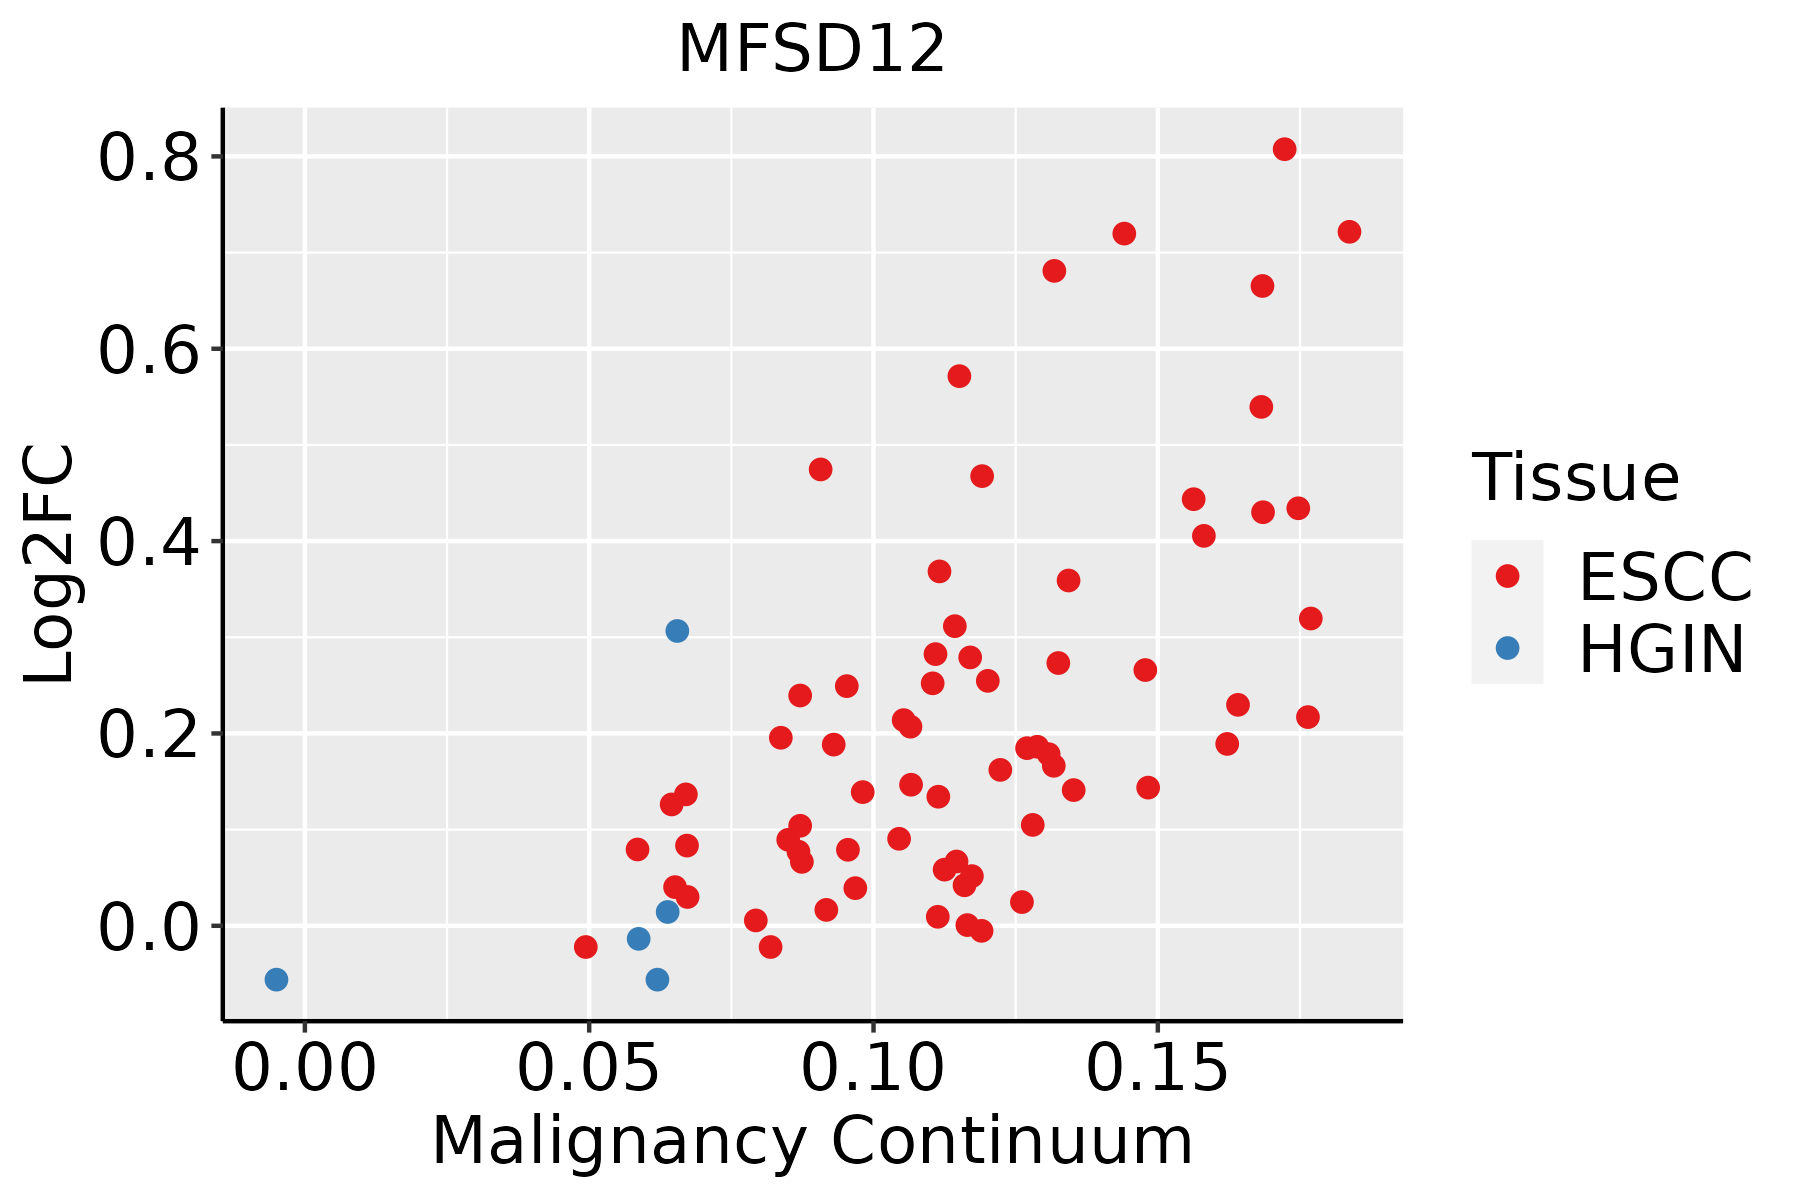 | ESCC: Esophageal squamous cell carcinoma |
| HGIN: High-grade intraepithelial neoplasias | ||
| LGIN: Low-grade intraepithelial neoplasias | ||
| Liver |  | HCC: Hepatocellular carcinoma |
| NAFLD: Non-alcoholic fatty liver disease | ||
| Oral Cavity | 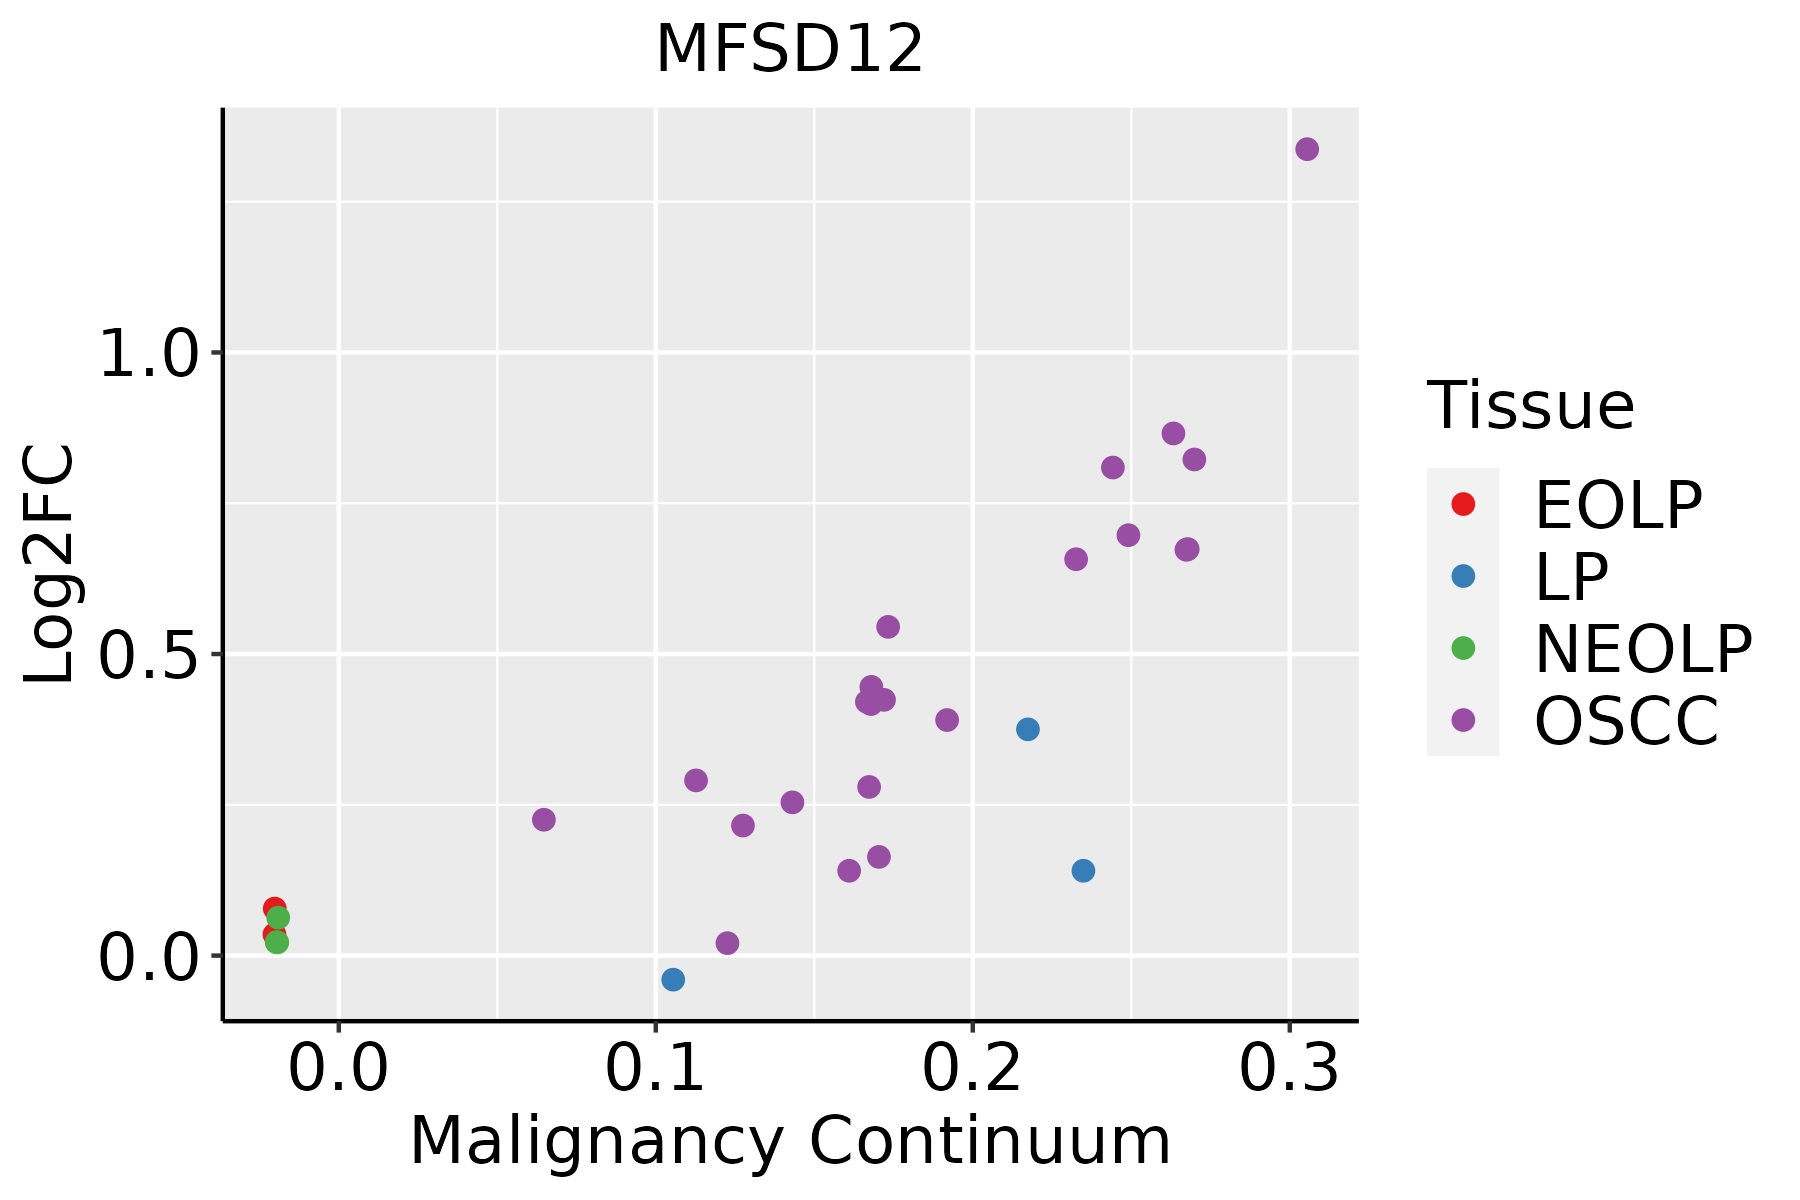 | EOLP: Erosive Oral lichen planus |
| LP: leukoplakia | ||
| NEOLP: Non-erosive oral lichen planus | ||
| OSCC: Oral squamous cell carcinoma | ||
| Thyroid |  | ATC: Anaplastic thyroid cancer |
| HT: Hashimoto's thyroiditis | ||
| PTC: Papillary thyroid cancer |
| ∗log2FC in expression of this searched gene in stem-like cells from each diseased tissue sample relative to stem-like cells in normal samples in each tissue plotted against the malignancy continuum. Samples are colored based on if they are from different disease stage. |
Top |
Malignant transformation related pathway analysis |
| Find out the enriched GO biological processes and KEGG pathways involved in transition from healthy to precancer to cancer |
| Tissue | Disease Stage | Enriched GO biological Processes |
| Colorectum | AD |  |
| Colorectum | SER |  |
| Colorectum | MSS |  |
| Colorectum | MSI-H |  |
| Colorectum | FAP |  |
| ∗Top 15 enriched GO BP terms are showed in the bar plot of each disease state in each tissue. Each row represents a significant GO biological process which is colored according to the -log10(p.adjust). |
| Page: 1 2 3 4 5 6 7 8 9 |
| GO ID | Tissue | Disease Stage | Description | Gene Ratio | Bg Ratio | pvalue | p.adjust | Count |
| GO:00461482 | Esophagus | ESCC | pigment biosynthetic process | 40/8552 | 62/18723 | 2.14e-03 | 9.54e-03 | 40 |
| GO:00434731 | Esophagus | ESCC | pigmentation | 59/8552 | 98/18723 | 2.64e-03 | 1.12e-02 | 59 |
| GO:19016174 | Esophagus | ESCC | organic hydroxy compound biosynthetic process | 128/8552 | 237/18723 | 5.86e-03 | 2.16e-02 | 128 |
| GO:00424401 | Esophagus | ESCC | pigment metabolic process | 50/8552 | 84/18723 | 7.34e-03 | 2.64e-02 | 50 |
| GO:19016172 | Liver | HCC | organic hydroxy compound biosynthetic process | 129/7958 | 237/18723 | 1.32e-04 | 1.08e-03 | 129 |
| GO:0042440 | Liver | HCC | pigment metabolic process | 51/7958 | 84/18723 | 5.74e-04 | 3.65e-03 | 51 |
| GO:0046148 | Liver | HCC | pigment biosynthetic process | 37/7958 | 62/18723 | 4.73e-03 | 2.02e-02 | 37 |
| GO:0008643 | Liver | HCC | carbohydrate transport | 80/7958 | 152/18723 | 7.34e-03 | 2.92e-02 | 80 |
| GO:19016173 | Oral cavity | OSCC | organic hydroxy compound biosynthetic process | 115/7305 | 237/18723 | 1.73e-03 | 8.18e-03 | 115 |
| GO:00461481 | Oral cavity | OSCC | pigment biosynthetic process | 36/7305 | 62/18723 | 1.82e-03 | 8.57e-03 | 36 |
| Page: 1 |
| Pathway ID | Tissue | Disease Stage | Description | Gene Ratio | Bg Ratio | pvalue | p.adjust | qvalue | Count |
| Page: 1 |
Top |
Cell-cell communication analysis |
| Identification of potential cell-cell interactions between two cell types and their ligand-receptor pairs for different disease states |
| Ligand | Receptor | LRpair | Pathway | Tissue | Disease Stage |
| Page: 1 |
Top |
Single-cell gene regulatory network inference analysis |
| Find out the significant the regulons (TFs) and the target genes of each regulon across cell types for different disease states |
| TF | Cell Type | Tissue | Disease Stage | Target Gene | RSS | Regulon Activity |
| ∗The dot plots of a searched regulon are shown for all cell subpopulations in each disease state of each tissue based on the regulon specific score inferred using pySCENIC and by calculating the average expression. |
| Page: 1 |
Top |
Somatic mutation of malignant transformation related genes |
| Annotation of somatic variants for genes involved in malignant transformation |
| Hugo Symbol | Variant Class | Variant Classification | dbSNP RS | HGVSc | HGVSp | HGVSp Short | SWISSPROT | BIOTYPE | SIFT | PolyPhen | Tumor Sample Barcode | Tissue | Histology | Sex | Age | Stage | Therapy Types | Drugs | Outcome |
| MFSD12 | SNV | Missense_Mutation | novel | c.983N>G | p.Ser328Cys | p.S328C | Q6NUT3 | protein_coding | deleterious(0) | probably_damaging(0.997) | TCGA-AC-A3W6-01 | Breast | breast invasive carcinoma | Female | >=65 | III/IV | Unknown | Unknown | SD |
| MFSD12 | SNV | Missense_Mutation | novel | c.443N>A | p.Ser148Tyr | p.S148Y | Q6NUT3 | protein_coding | deleterious(0) | probably_damaging(0.992) | TCGA-C8-A8HP-01 | Breast | breast invasive carcinoma | Female | <65 | III/IV | Chemotherapy | 5-fluorouracil | CR |
| MFSD12 | deletion | Frame_Shift_Del | novel | c.1358delN | p.Val453GlyfsTer31 | p.V453Gfs*31 | Q6NUT3 | protein_coding | TCGA-D8-A27V-01 | Breast | breast invasive carcinoma | Female | <65 | I/II | Hormone Therapy | tamoxiphen | SD | ||
| MFSD12 | SNV | Missense_Mutation | c.146N>G | p.Ser49Trp | p.S49W | Q6NUT3 | protein_coding | tolerated(0.18) | probably_damaging(0.959) | TCGA-DR-A0ZM-01 | Cervix | cervical & endocervical cancer | Female | <65 | III/IV | Unspecific | Cisplatin | SD | |
| MFSD12 | deletion | Frame_Shift_Del | c.766delC | p.Leu256CysfsTer30 | p.L256Cfs*30 | Q6NUT3 | protein_coding | TCGA-EA-A3HU-01 | Cervix | cervical & endocervical cancer | Female | <65 | I/II | Unknown | Unknown | SD | |||
| MFSD12 | SNV | Missense_Mutation | rs569176426 | c.1082N>T | p.Ala361Val | p.A361V | Q6NUT3 | protein_coding | tolerated(0.34) | benign(0.005) | TCGA-A6-2686-01 | Colorectum | colon adenocarcinoma | Female | >=65 | I/II | Unknown | Unknown | SD |
| MFSD12 | SNV | Missense_Mutation | novel | c.323N>C | p.Phe108Ser | p.F108S | Q6NUT3 | protein_coding | deleterious(0) | probably_damaging(0.997) | TCGA-A6-6780-01 | Colorectum | colon adenocarcinoma | Male | >=65 | I/II | Unknown | Unknown | SD |
| MFSD12 | SNV | Missense_Mutation | c.1433N>G | p.Ala478Gly | p.A478G | Q6NUT3 | protein_coding | tolerated_low_confidence(0.3) | benign(0.018) | TCGA-CA-5796-01 | Colorectum | colon adenocarcinoma | Female | <65 | I/II | Chemotherapy | oxaliplatin | CR | |
| MFSD12 | SNV | Missense_Mutation | c.380N>T | p.Ala127Val | p.A127V | Q6NUT3 | protein_coding | tolerated(0.12) | benign(0.326) | TCGA-DM-A28F-01 | Colorectum | colon adenocarcinoma | Male | >=65 | III/IV | Unknown | Unknown | SD | |
| MFSD12 | SNV | Missense_Mutation | rs372325734 | c.500C>T | p.Thr167Met | p.T167M | Q6NUT3 | protein_coding | deleterious(0) | probably_damaging(0.978) | TCGA-NH-A50T-01 | Colorectum | colon adenocarcinoma | Female | >=65 | I/II | Unknown | Unknown | SD |
| Page: 1 2 3 4 |
Top |
Related drugs of malignant transformation related genes |
| Identification of chemicals and drugs interact with genes involved in malignant transfromation |
| (DGIdb 4.0) |
| Entrez ID | Symbol | Category | Interaction Types | Drug Claim Name | Drug Name | PMIDs |
| Page: 1 |

Copyright 2023-Present -The University of Texas Health Science Center at Houston |