
|
|||||
|
 | |
| |
| |
| |
| |
| |
|
Gene: MFSD10 |
Gene summary for MFSD10 |
| Gene information | Species | Human | Gene symbol | MFSD10 | Gene ID | 10227 |
| Gene name | major facilitator superfamily domain containing 10 | |
| Gene Alias | TETRAN | |
| Cytomap | 4p16.3 | |
| Gene Type | protein-coding | GO ID | GO:0006810 | UniProtAcc | Q14728 |
Top |
Malignant transformation analysis |
| Identification of the aberrant gene expression in precancerous and cancerous lesions by comparing the gene expression of stem-like cells in diseased tissues with normal stem cells |
| Entrez ID | Symbol | Replicates | Species | Organ | Tissue | Adj P-value | Log2FC | Malignancy |
| 10227 | MFSD10 | LZE4T | Human | Esophagus | ESCC | 7.57e-04 | 5.91e-02 | 0.0811 |
| 10227 | MFSD10 | LZE7T | Human | Esophagus | ESCC | 3.76e-11 | 8.02e-01 | 0.0667 |
| 10227 | MFSD10 | LZE8T | Human | Esophagus | ESCC | 2.60e-18 | 8.28e-01 | 0.067 |
| 10227 | MFSD10 | LZE20T | Human | Esophagus | ESCC | 6.97e-09 | 5.71e-01 | 0.0662 |
| 10227 | MFSD10 | LZE22T | Human | Esophagus | ESCC | 1.13e-05 | 7.78e-01 | 0.068 |
| 10227 | MFSD10 | LZE24T | Human | Esophagus | ESCC | 2.33e-16 | 5.46e-01 | 0.0596 |
| 10227 | MFSD10 | LZE6T | Human | Esophagus | ESCC | 7.09e-12 | 1.10e+00 | 0.0845 |
| 10227 | MFSD10 | P1T-E | Human | Esophagus | ESCC | 2.46e-15 | 6.17e-01 | 0.0875 |
| 10227 | MFSD10 | P2T-E | Human | Esophagus | ESCC | 1.51e-56 | 1.20e+00 | 0.1177 |
| 10227 | MFSD10 | P4T-E | Human | Esophagus | ESCC | 2.38e-27 | 8.21e-01 | 0.1323 |
| 10227 | MFSD10 | P5T-E | Human | Esophagus | ESCC | 7.88e-27 | 5.93e-01 | 0.1327 |
| 10227 | MFSD10 | P8T-E | Human | Esophagus | ESCC | 1.22e-53 | 1.11e+00 | 0.0889 |
| 10227 | MFSD10 | P9T-E | Human | Esophagus | ESCC | 1.69e-21 | 5.08e-01 | 0.1131 |
| 10227 | MFSD10 | P10T-E | Human | Esophagus | ESCC | 7.86e-23 | 3.92e-01 | 0.116 |
| 10227 | MFSD10 | P11T-E | Human | Esophagus | ESCC | 1.55e-23 | 1.02e+00 | 0.1426 |
| 10227 | MFSD10 | P12T-E | Human | Esophagus | ESCC | 6.11e-27 | 4.24e-01 | 0.1122 |
| 10227 | MFSD10 | P15T-E | Human | Esophagus | ESCC | 1.64e-18 | 4.71e-01 | 0.1149 |
| 10227 | MFSD10 | P16T-E | Human | Esophagus | ESCC | 1.85e-73 | 1.55e+00 | 0.1153 |
| 10227 | MFSD10 | P17T-E | Human | Esophagus | ESCC | 1.48e-24 | 1.11e+00 | 0.1278 |
| 10227 | MFSD10 | P19T-E | Human | Esophagus | ESCC | 2.17e-15 | 1.23e+00 | 0.1662 |
| Page: 1 2 3 4 5 6 |
| Tissue | Expression Dynamics | Abbreviation |
| Esophagus | 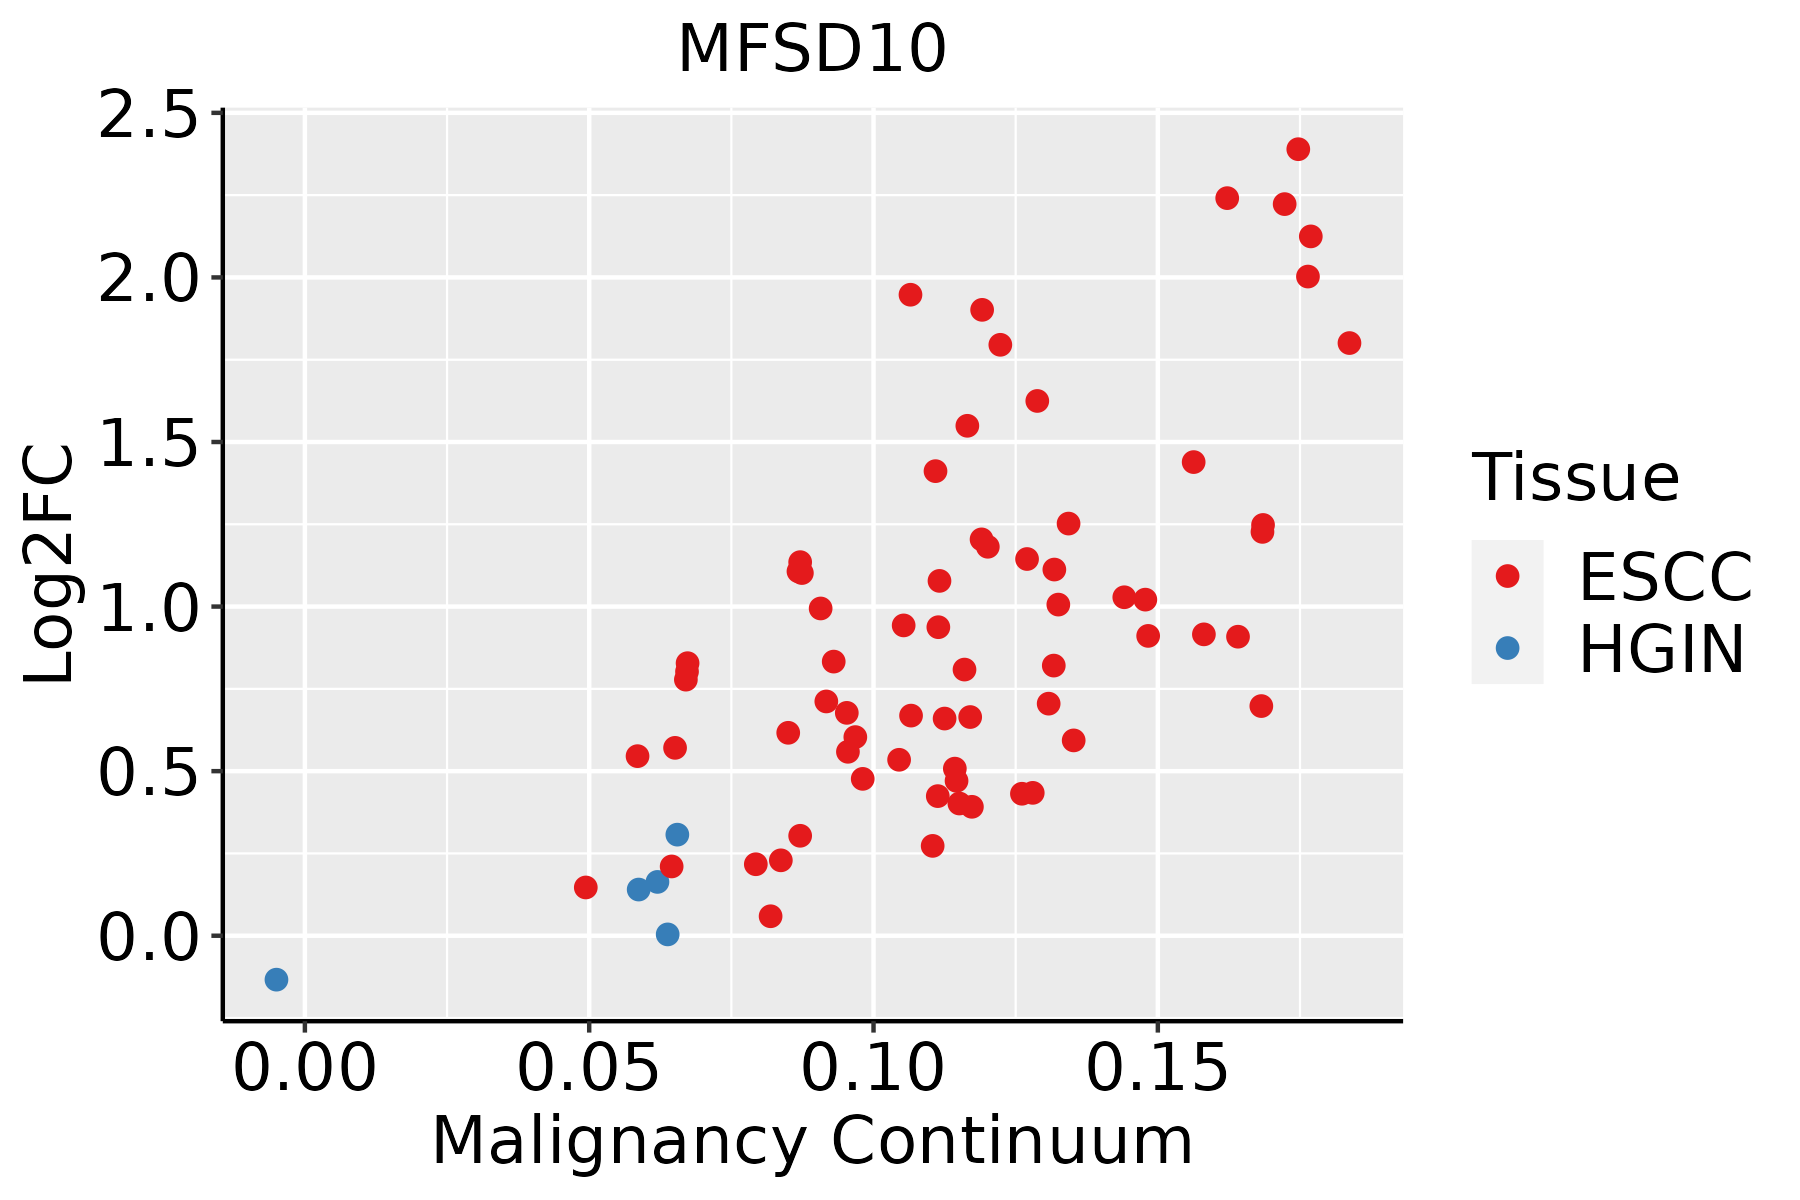 | ESCC: Esophageal squamous cell carcinoma |
| HGIN: High-grade intraepithelial neoplasias | ||
| LGIN: Low-grade intraepithelial neoplasias | ||
| Liver |  | HCC: Hepatocellular carcinoma |
| NAFLD: Non-alcoholic fatty liver disease | ||
| Oral Cavity |  | EOLP: Erosive Oral lichen planus |
| LP: leukoplakia | ||
| NEOLP: Non-erosive oral lichen planus | ||
| OSCC: Oral squamous cell carcinoma | ||
| Skin |  | AK: Actinic keratosis |
| cSCC: Cutaneous squamous cell carcinoma | ||
| SCCIS:squamous cell carcinoma in situ | ||
| Thyroid |  | ATC: Anaplastic thyroid cancer |
| HT: Hashimoto's thyroiditis | ||
| PTC: Papillary thyroid cancer |
| ∗log2FC in expression of this searched gene in stem-like cells from each diseased tissue sample relative to stem-like cells in normal samples in each tissue plotted against the malignancy continuum. Samples are colored based on if they are from different disease stage. |
Top |
Malignant transformation related pathway analysis |
| Find out the enriched GO biological processes and KEGG pathways involved in transition from healthy to precancer to cancer |
| Tissue | Disease Stage | Enriched GO biological Processes |
| Colorectum | AD |  |
| Colorectum | SER |  |
| Colorectum | MSS |  |
| Colorectum | MSI-H |  |
| Colorectum | FAP |  |
| ∗Top 15 enriched GO BP terms are showed in the bar plot of each disease state in each tissue. Each row represents a significant GO biological process which is colored according to the -log10(p.adjust). |
| Page: 1 2 3 4 5 6 7 8 9 |
| GO ID | Tissue | Disease Stage | Description | Gene Ratio | Bg Ratio | pvalue | p.adjust | Count |
| Page: 1 |
| Pathway ID | Tissue | Disease Stage | Description | Gene Ratio | Bg Ratio | pvalue | p.adjust | qvalue | Count |
| Page: 1 |
Top |
Cell-cell communication analysis |
| Identification of potential cell-cell interactions between two cell types and their ligand-receptor pairs for different disease states |
| Ligand | Receptor | LRpair | Pathway | Tissue | Disease Stage |
| Page: 1 |
Top |
Single-cell gene regulatory network inference analysis |
| Find out the significant the regulons (TFs) and the target genes of each regulon across cell types for different disease states |
| TF | Cell Type | Tissue | Disease Stage | Target Gene | RSS | Regulon Activity |
| ∗The dot plots of a searched regulon are shown for all cell subpopulations in each disease state of each tissue based on the regulon specific score inferred using pySCENIC and by calculating the average expression. |
| Page: 1 |
Top |
Somatic mutation of malignant transformation related genes |
| Annotation of somatic variants for genes involved in malignant transformation |
| Hugo Symbol | Variant Class | Variant Classification | dbSNP RS | HGVSc | HGVSp | HGVSp Short | SWISSPROT | BIOTYPE | SIFT | PolyPhen | Tumor Sample Barcode | Tissue | Histology | Sex | Age | Stage | Therapy Types | Drugs | Outcome |
| MFSD10 | SNV | Missense_Mutation | rs147592346 | c.583N>A | p.Gly195Arg | p.G195R | Q14728 | protein_coding | deleterious(0) | probably_damaging(1) | TCGA-A2-A04W-01 | Breast | breast invasive carcinoma | Female | <65 | I/II | Chemotherapy | cytoxan | SD |
| MFSD10 | SNV | Missense_Mutation | c.526G>T | p.Gly176Cys | p.G176C | Q14728 | protein_coding | deleterious(0) | probably_damaging(1) | TCGA-A8-A09Z-01 | Breast | breast invasive carcinoma | Female | >=65 | I/II | Unknown | Unknown | SD | |
| MFSD10 | SNV | Missense_Mutation | c.332N>T | p.Ser111Phe | p.S111F | Q14728 | protein_coding | deleterious(0) | probably_damaging(1) | TCGA-EK-A3GJ-01 | Cervix | cervical & endocervical cancer | Female | <65 | I/II | Unknown | Unknown | SD | |
| MFSD10 | SNV | Missense_Mutation | novel | c.28N>G | p.Thr10Ala | p.T10A | Q14728 | protein_coding | tolerated(0.07) | benign(0.023) | TCGA-A6-3809-01 | Colorectum | colon adenocarcinoma | Female | >=65 | I/II | Unknown | Unknown | SD |
| MFSD10 | SNV | Missense_Mutation | rs369064197 | c.640N>A | p.Asp214Asn | p.D214N | Q14728 | protein_coding | tolerated(0.13) | benign(0.072) | TCGA-AA-3984-01 | Colorectum | colon adenocarcinoma | Female | <65 | I/II | Unknown | Unknown | SD |
| MFSD10 | SNV | Missense_Mutation | c.1093N>A | p.Gly365Arg | p.G365R | Q14728 | protein_coding | deleterious(0) | probably_damaging(1) | TCGA-CK-4951-01 | Colorectum | colon adenocarcinoma | Female | >=65 | I/II | Unknown | Unknown | PD | |
| MFSD10 | SNV | Missense_Mutation | rs748192658 | c.1120G>A | p.Ala374Thr | p.A374T | Q14728 | protein_coding | deleterious(0) | probably_damaging(0.993) | TCGA-F5-6814-01 | Colorectum | rectum adenocarcinoma | Male | <65 | I/II | Unknown | Unknown | SD |
| MFSD10 | deletion | Frame_Shift_Del | c.331_353delNNNNNNNNNNNNNNNNNNNNNNN | p.Ser111GlyfsTer48 | p.S111Gfs*48 | Q14728 | protein_coding | TCGA-AA-3502-01 | Colorectum | colon adenocarcinoma | Male | >=65 | I/II | Unknown | Unknown | SD | |||
| MFSD10 | SNV | Missense_Mutation | novel | c.602A>G | p.Glu201Gly | p.E201G | Q14728 | protein_coding | tolerated(0.19) | benign(0.407) | TCGA-A5-A0G2-01 | Endometrium | uterine corpus endometrioid carcinoma | Female | <65 | III/IV | Unknown | Unknown | SD |
| MFSD10 | SNV | Missense_Mutation | rs370161671 | c.482C>T | p.Thr161Met | p.T161M | Q14728 | protein_coding | tolerated(0.41) | possibly_damaging(0.547) | TCGA-A5-A0G2-01 | Endometrium | uterine corpus endometrioid carcinoma | Female | <65 | III/IV | Unknown | Unknown | SD |
| Page: 1 2 3 |
Top |
Related drugs of malignant transformation related genes |
| Identification of chemicals and drugs interact with genes involved in malignant transfromation |
| (DGIdb 4.0) |
| Entrez ID | Symbol | Category | Interaction Types | Drug Claim Name | Drug Name | PMIDs |
| Page: 1 |

Copyright 2023-Present -The University of Texas Health Science Center at Houston |