
|
|||||
|
 | |
| |
| |
| |
| |
| |
|
Gene: MFNG |
Gene summary for MFNG |
| Gene information | Species | Human | Gene symbol | MFNG | Gene ID | 4242 |
| Gene name | MFNG O-fucosylpeptide 3-beta-N-acetylglucosaminyltransferase | |
| Gene Alias | MFNG | |
| Cytomap | 22q13.1 | |
| Gene Type | protein-coding | GO ID | GO:0001701 | UniProtAcc | O00587 |
Top |
Malignant transformation analysis |
| Identification of the aberrant gene expression in precancerous and cancerous lesions by comparing the gene expression of stem-like cells in diseased tissues with normal stem cells |
| Entrez ID | Symbol | Replicates | Species | Organ | Tissue | Adj P-value | Log2FC | Malignancy |
| 4242 | MFNG | S014 | Human | Liver | HCC | 1.18e-51 | 1.55e+00 | 0.2254 |
| 4242 | MFNG | S015 | Human | Liver | HCC | 1.50e-43 | 2.09e+00 | 0.2375 |
| 4242 | MFNG | S016 | Human | Liver | HCC | 6.70e-70 | 1.94e+00 | 0.2243 |
| Page: 1 |
| Tissue | Expression Dynamics | Abbreviation |
| Liver | 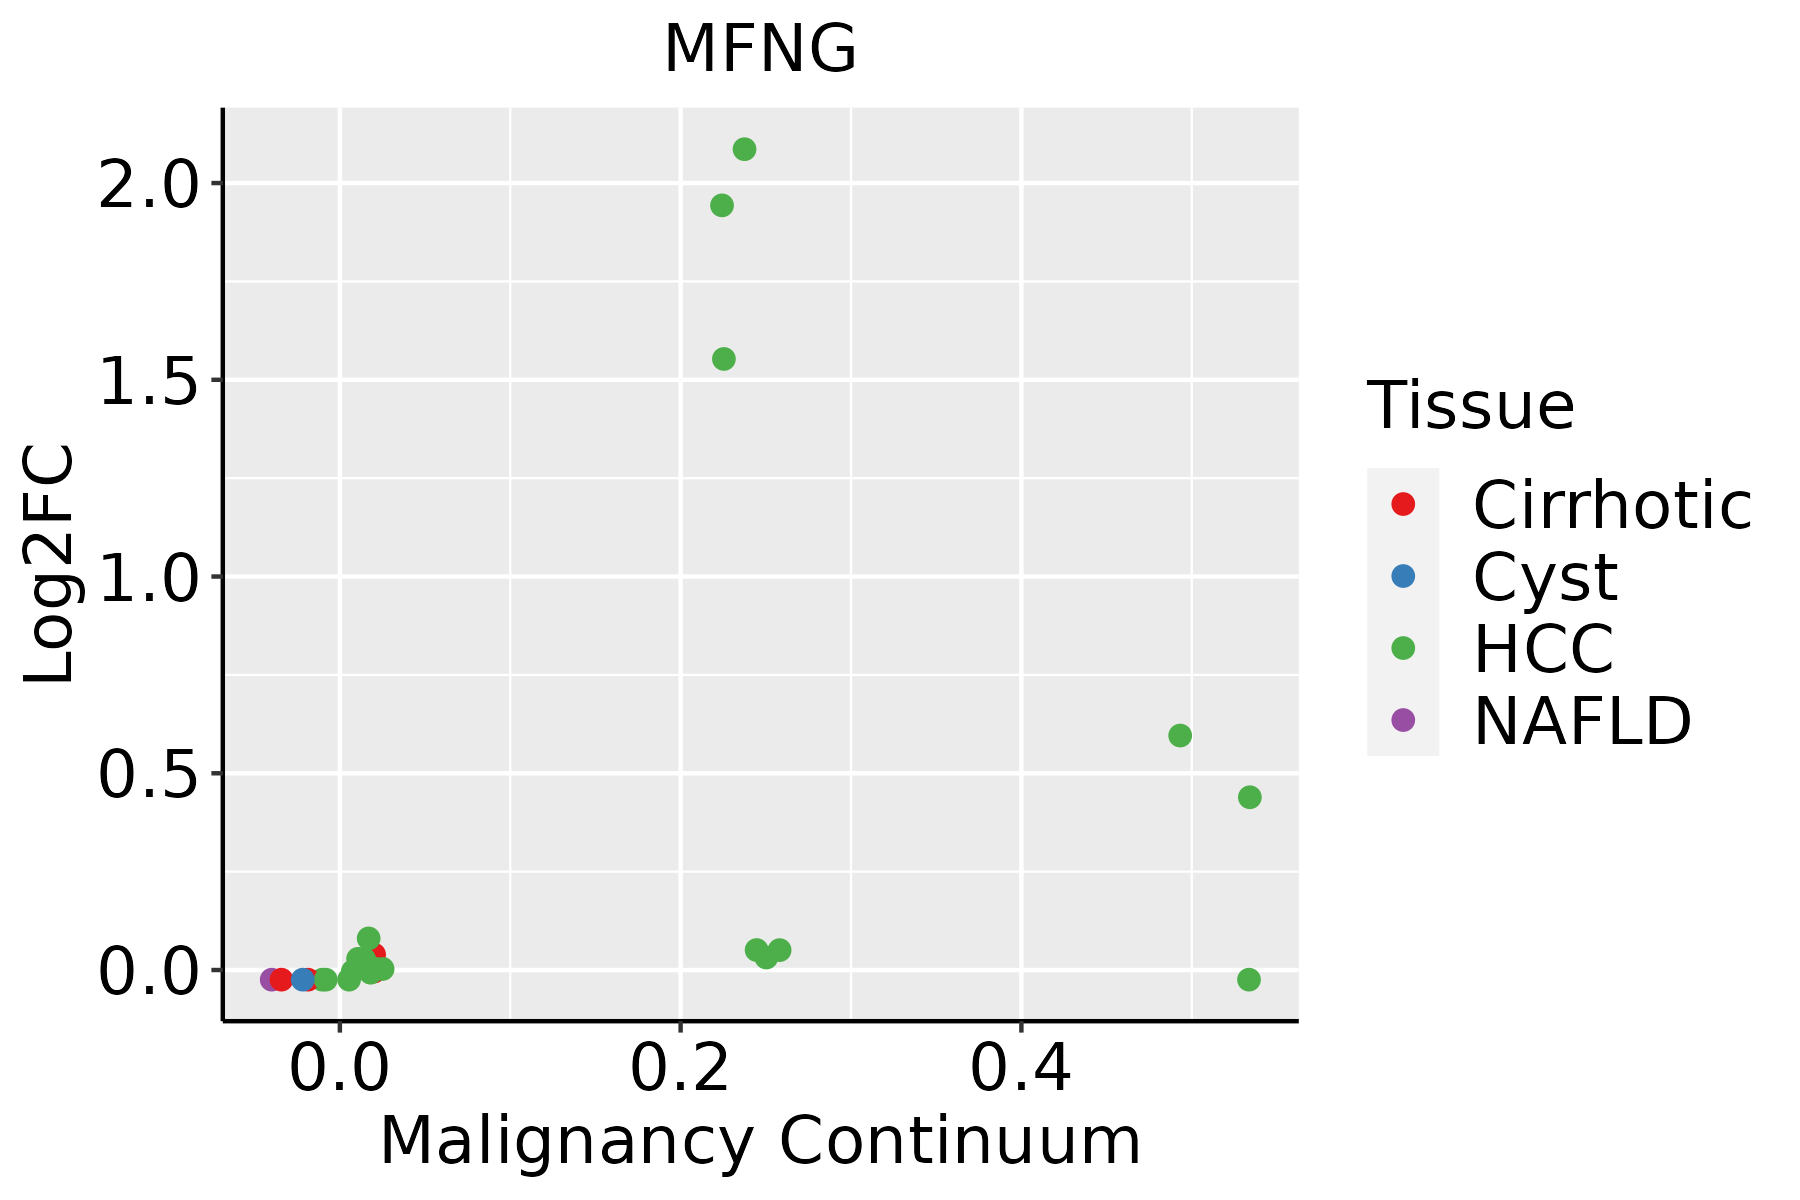 | HCC: Hepatocellular carcinoma |
| NAFLD: Non-alcoholic fatty liver disease |
| ∗log2FC in expression of this searched gene in stem-like cells from each diseased tissue sample relative to stem-like cells in normal samples in each tissue plotted against the malignancy continuum. Samples are colored based on if they are from different disease stage. |
Top |
Malignant transformation related pathway analysis |
| Find out the enriched GO biological processes and KEGG pathways involved in transition from healthy to precancer to cancer |
| Tissue | Disease Stage | Enriched GO biological Processes |
| Colorectum | AD |  |
| Colorectum | SER |  |
| Colorectum | MSS |  |
| Colorectum | MSI-H |  |
| Colorectum | FAP |  |
| ∗Top 15 enriched GO BP terms are showed in the bar plot of each disease state in each tissue. Each row represents a significant GO biological process which is colored according to the -log10(p.adjust). |
| Page: 1 2 3 4 5 6 7 8 9 |
| GO ID | Tissue | Disease Stage | Description | Gene Ratio | Bg Ratio | pvalue | p.adjust | Count |
| GO:005109822 | Liver | HCC | regulation of binding | 225/7958 | 363/18723 | 3.78e-14 | 2.37e-12 | 225 |
| GO:004339322 | Liver | HCC | regulation of protein binding | 129/7958 | 196/18723 | 3.27e-11 | 1.26e-09 | 129 |
| GO:005109922 | Liver | HCC | positive regulation of binding | 108/7958 | 173/18723 | 9.22e-08 | 1.83e-06 | 108 |
| GO:000170111 | Liver | HCC | in utero embryonic development | 204/7958 | 367/18723 | 2.44e-07 | 4.30e-06 | 204 |
| GO:003209221 | Liver | HCC | positive regulation of protein binding | 59/7958 | 85/18723 | 4.66e-07 | 7.61e-06 | 59 |
| GO:00018251 | Liver | HCC | blastocyst formation | 27/7958 | 38/18723 | 3.47e-04 | 2.42e-03 | 27 |
| Page: 1 |
| Pathway ID | Tissue | Disease Stage | Description | Gene Ratio | Bg Ratio | pvalue | p.adjust | qvalue | Count |
| hsa051652 | Liver | HCC | Human papillomavirus infection | 188/4020 | 331/8465 | 3.34e-04 | 1.49e-03 | 8.29e-04 | 188 |
| hsa051653 | Liver | HCC | Human papillomavirus infection | 188/4020 | 331/8465 | 3.34e-04 | 1.49e-03 | 8.29e-04 | 188 |
| Page: 1 |
Top |
Cell-cell communication analysis |
| Identification of potential cell-cell interactions between two cell types and their ligand-receptor pairs for different disease states |
| Ligand | Receptor | LRpair | Pathway | Tissue | Disease Stage |
| Page: 1 |
Top |
Single-cell gene regulatory network inference analysis |
| Find out the significant the regulons (TFs) and the target genes of each regulon across cell types for different disease states |
| TF | Cell Type | Tissue | Disease Stage | Target Gene | RSS | Regulon Activity |
| ∗The dot plots of a searched regulon are shown for all cell subpopulations in each disease state of each tissue based on the regulon specific score inferred using pySCENIC and by calculating the average expression. |
| Page: 1 |
Top |
Somatic mutation of malignant transformation related genes |
| Annotation of somatic variants for genes involved in malignant transformation |
| Hugo Symbol | Variant Class | Variant Classification | dbSNP RS | HGVSc | HGVSp | HGVSp Short | SWISSPROT | BIOTYPE | SIFT | PolyPhen | Tumor Sample Barcode | Tissue | Histology | Sex | Age | Stage | Therapy Types | Drugs | Outcome |
| MFNG | SNV | Missense_Mutation | c.660N>G | p.Phe220Leu | p.F220L | O00587 | protein_coding | deleterious(0.03) | probably_damaging(0.997) | TCGA-IR-A3LK-01 | Cervix | cervical & endocervical cancer | Female | >=65 | I/II | Chemotherapy | cisplatin | PD | |
| MFNG | SNV | Missense_Mutation | c.313N>A | p.Leu105Ile | p.L105I | O00587 | protein_coding | tolerated(0.16) | benign(0.291) | TCGA-AA-A02R-01 | Colorectum | colon adenocarcinoma | Female | >=65 | I/II | Unknown | Unknown | PD | |
| MFNG | SNV | Missense_Mutation | rs199609888 | c.614N>A | p.Arg205His | p.R205H | O00587 | protein_coding | deleterious(0.03) | probably_damaging(0.992) | TCGA-F4-6856-01 | Colorectum | colon adenocarcinoma | Male | <65 | I/II | Ancillary | leucovorin | CR |
| MFNG | SNV | Missense_Mutation | rs554733145 | c.613C>T | p.Arg205Cys | p.R205C | O00587 | protein_coding | deleterious(0) | probably_damaging(0.992) | TCGA-A5-A0G2-01 | Endometrium | uterine corpus endometrioid carcinoma | Female | <65 | III/IV | Unknown | Unknown | SD |
| MFNG | SNV | Missense_Mutation | rs758327571 | c.10C>T | p.Arg4Trp | p.R4W | O00587 | protein_coding | deleterious_low_confidence(0) | benign(0.021) | TCGA-AJ-A3BH-01 | Endometrium | uterine corpus endometrioid carcinoma | Female | Unknown | I/II | Unknown | Unknown | SD |
| MFNG | SNV | Missense_Mutation | novel | c.282C>G | p.Asp94Glu | p.D94E | O00587 | protein_coding | deleterious(0) | benign(0.214) | TCGA-AJ-A3EL-01 | Endometrium | uterine corpus endometrioid carcinoma | Female | <65 | I/II | Unknown | Unknown | SD |
| MFNG | SNV | Missense_Mutation | rs748361128 | c.853G>A | p.Val285Ile | p.V285I | O00587 | protein_coding | tolerated(0.19) | benign(0.015) | TCGA-AP-A056-01 | Endometrium | uterine corpus endometrioid carcinoma | Female | <65 | I/II | Unknown | Unknown | SD |
| MFNG | SNV | Missense_Mutation | c.470G>A | p.Arg157Lys | p.R157K | O00587 | protein_coding | tolerated(0.15) | benign(0.001) | TCGA-AP-A059-01 | Endometrium | uterine corpus endometrioid carcinoma | Female | >=65 | I/II | Unknown | Unknown | SD | |
| MFNG | SNV | Missense_Mutation | c.118N>A | p.Glu40Lys | p.E40K | O00587 | protein_coding | tolerated(0.5) | benign(0.025) | TCGA-AP-A1DV-01 | Endometrium | uterine corpus endometrioid carcinoma | Female | <65 | I/II | Unknown | Unknown | SD | |
| MFNG | SNV | Missense_Mutation | novel | c.366N>T | p.Lys122Asn | p.K122N | O00587 | protein_coding | deleterious(0) | probably_damaging(1) | TCGA-AX-A2HC-01 | Endometrium | uterine corpus endometrioid carcinoma | Female | <65 | III/IV | Chemotherapy | paclitaxel | PD |
| Page: 1 2 |
Top |
Related drugs of malignant transformation related genes |
| Identification of chemicals and drugs interact with genes involved in malignant transfromation |
| (DGIdb 4.0) |
| Entrez ID | Symbol | Category | Interaction Types | Drug Claim Name | Drug Name | PMIDs |
| Page: 1 |

Copyright 2023-Present -The University of Texas Health Science Center at Houston |