| Tissue | Expression Dynamics | Abbreviation |
| Cervix |  | CC: Cervix cancer |
| HSIL_HPV: HPV-infected high-grade squamous intraepithelial lesions |
| N_HPV: HPV-infected normal cervix |
| Esophagus | 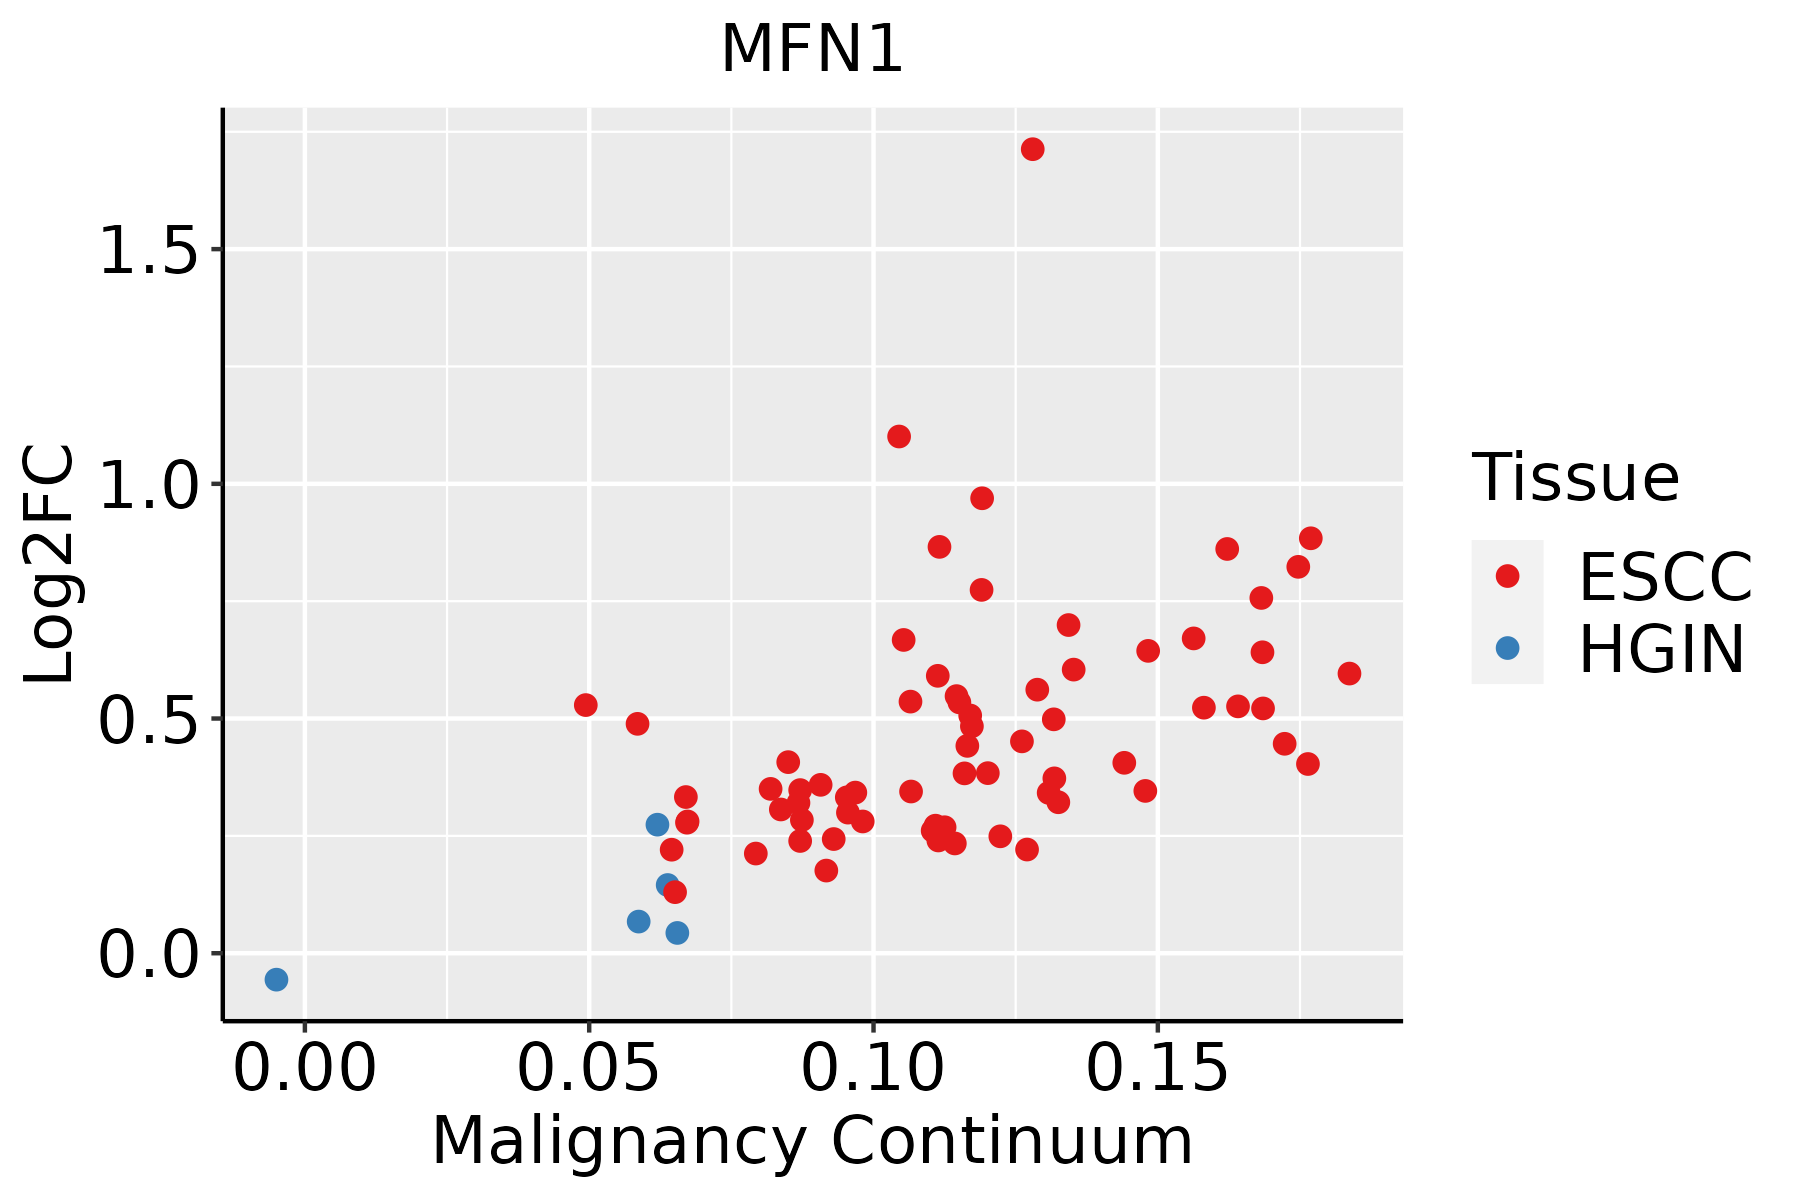 | ESCC: Esophageal squamous cell carcinoma |
| HGIN: High-grade intraepithelial neoplasias |
| LGIN: Low-grade intraepithelial neoplasias |
| Oral Cavity | 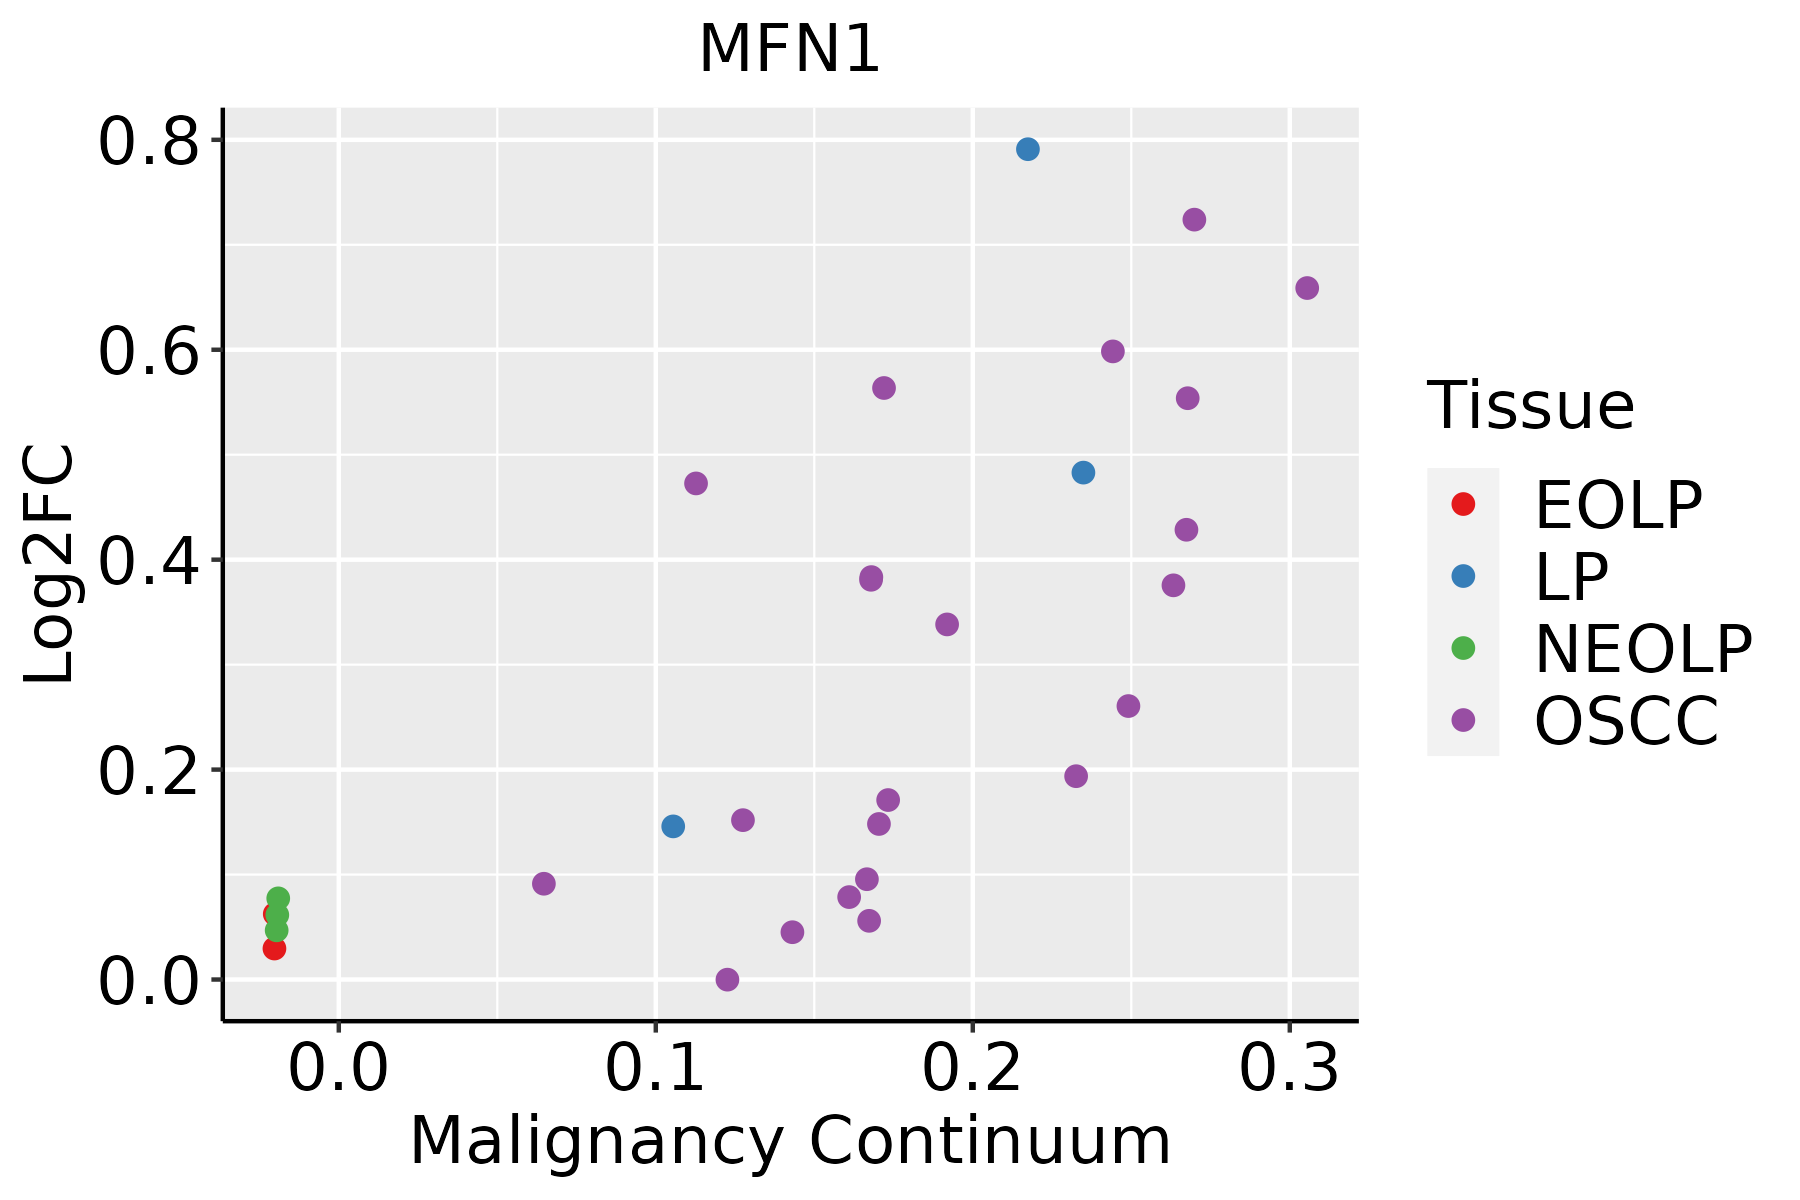 | EOLP: Erosive Oral lichen planus |
| LP: leukoplakia |
| NEOLP: Non-erosive oral lichen planus |
| OSCC: Oral squamous cell carcinoma |
| Skin | 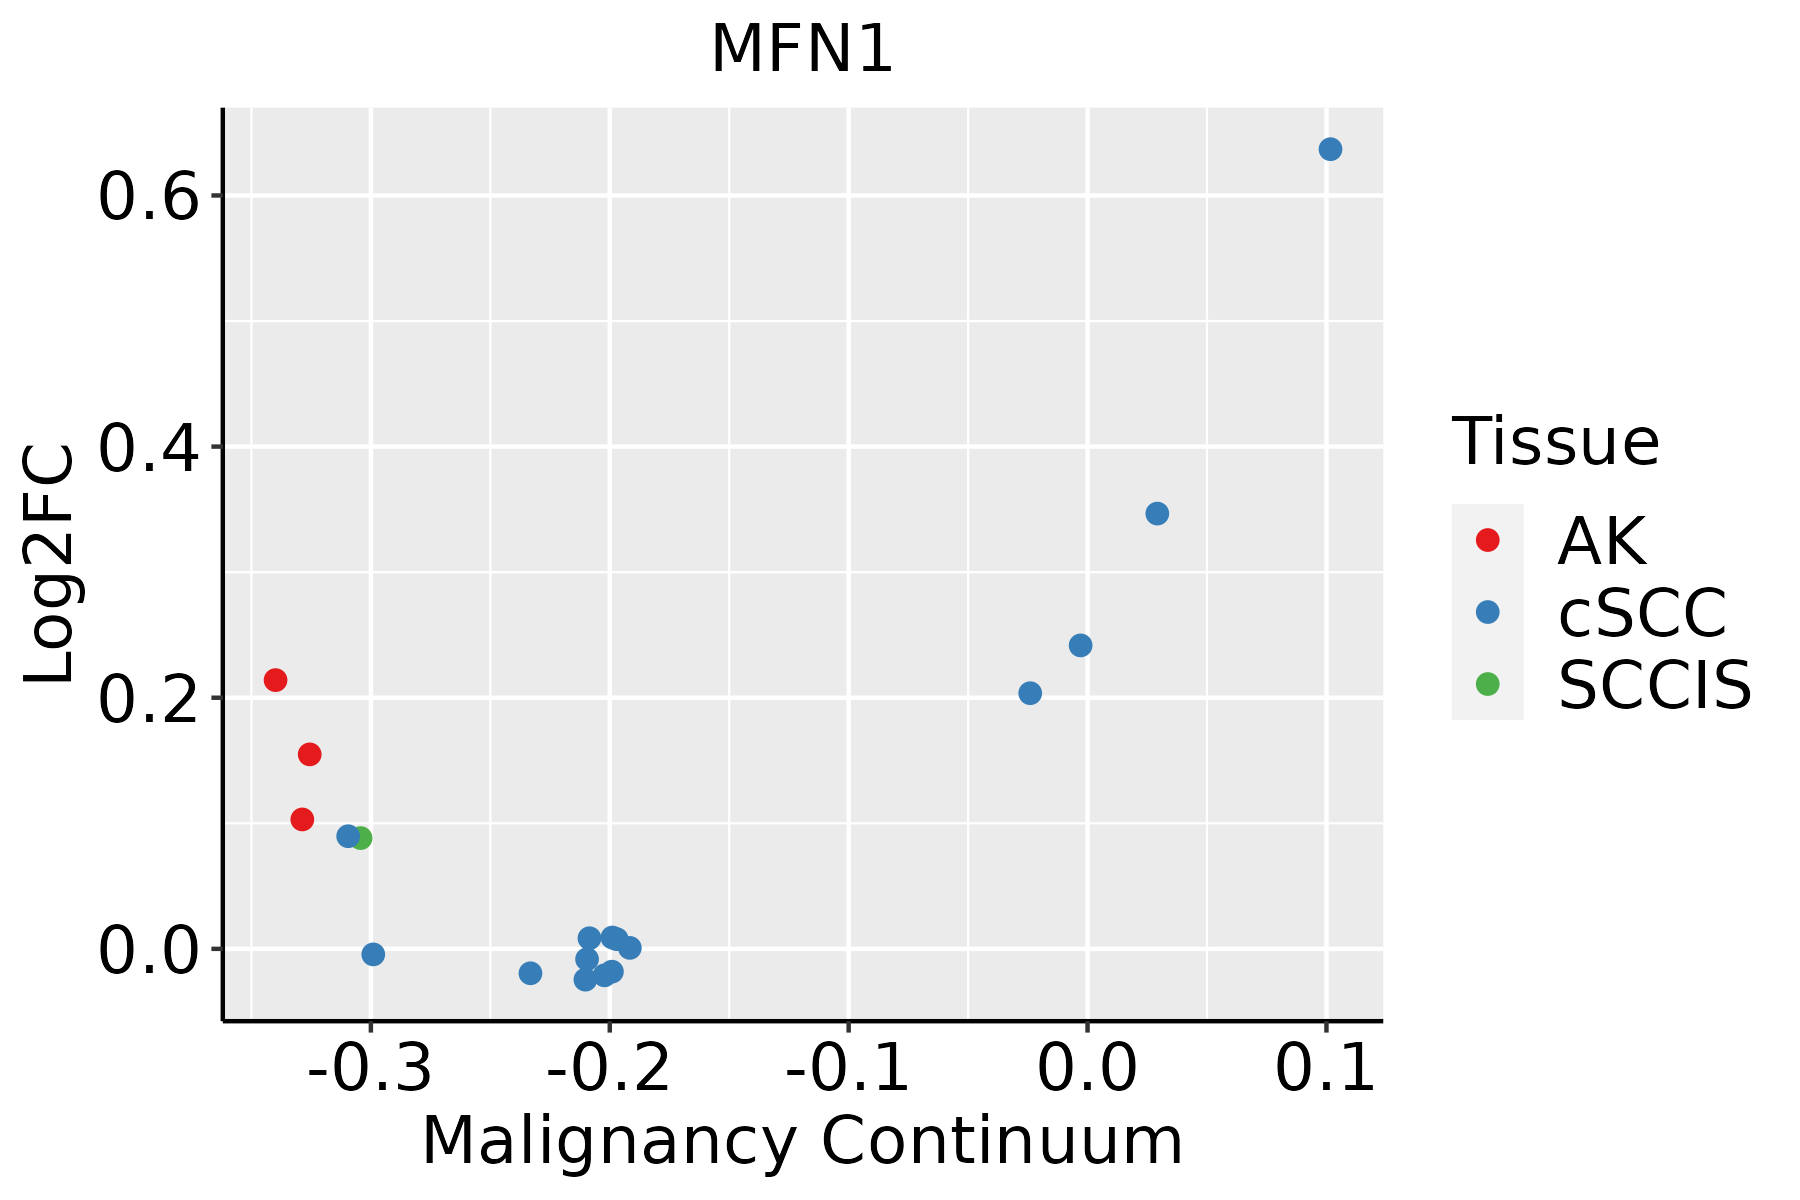 | AK: Actinic keratosis |
| cSCC: Cutaneous squamous cell carcinoma |
| SCCIS:squamous cell carcinoma in situ |
| GO ID | Tissue | Disease Stage | Description | Gene Ratio | Bg Ratio | pvalue | p.adjust | Count |
| GO:00091449 | Cervix | CC | purine nucleoside triphosphate metabolic process | 29/2311 | 88/18723 | 3.62e-07 | 1.45e-05 | 29 |
| GO:00092058 | Cervix | CC | purine ribonucleoside triphosphate metabolic process | 27/2311 | 82/18723 | 9.24e-07 | 3.25e-05 | 27 |
| GO:00091998 | Cervix | CC | ribonucleoside triphosphate metabolic process | 28/2311 | 89/18723 | 1.65e-06 | 5.44e-05 | 28 |
| GO:00091419 | Cervix | CC | nucleoside triphosphate metabolic process | 31/2311 | 112/18723 | 9.38e-06 | 2.11e-04 | 31 |
| GO:00070067 | Cervix | CC | mitochondrial membrane organization | 28/2311 | 116/18723 | 3.28e-04 | 3.47e-03 | 28 |
| GO:00196939 | Cervix | CC | ribose phosphate metabolic process | 72/2311 | 396/18723 | 4.49e-04 | 4.48e-03 | 72 |
| GO:00092599 | Cervix | CC | ribonucleotide metabolic process | 70/2311 | 385/18723 | 5.35e-04 | 5.18e-03 | 70 |
| GO:000915010 | Cervix | CC | purine ribonucleotide metabolic process | 66/2311 | 368/18723 | 1.09e-03 | 9.07e-03 | 66 |
| GO:000616310 | Cervix | CC | purine nucleotide metabolic process | 67/2311 | 396/18723 | 4.41e-03 | 2.69e-02 | 67 |
| GO:007252110 | Cervix | CC | purine-containing compound metabolic process | 69/2311 | 416/18723 | 6.27e-03 | 3.54e-02 | 69 |
| GO:00516461 | Cervix | CC | mitochondrion localization | 13/2311 | 50/18723 | 6.42e-03 | 3.58e-02 | 13 |
| GO:000911710 | Cervix | CC | nucleotide metabolic process | 79/2311 | 489/18723 | 7.16e-03 | 3.85e-02 | 79 |
| GO:000700619 | Esophagus | ESCC | mitochondrial membrane organization | 93/8552 | 116/18723 | 2.16e-14 | 1.11e-12 | 93 |
| GO:0006753110 | Esophagus | ESCC | nucleoside phosphate metabolic process | 288/8552 | 497/18723 | 1.80e-08 | 3.50e-07 | 288 |
| GO:0019693111 | Esophagus | ESCC | ribose phosphate metabolic process | 234/8552 | 396/18723 | 4.24e-08 | 7.76e-07 | 234 |
| GO:0009117111 | Esophagus | ESCC | nucleotide metabolic process | 282/8552 | 489/18723 | 4.70e-08 | 8.50e-07 | 282 |
| GO:0009141111 | Esophagus | ESCC | nucleoside triphosphate metabolic process | 78/8552 | 112/18723 | 2.36e-07 | 3.59e-06 | 78 |
| GO:00482844 | Esophagus | ESCC | organelle fusion | 94/8552 | 141/18723 | 3.72e-07 | 5.16e-06 | 94 |
| GO:0009259111 | Esophagus | ESCC | ribonucleotide metabolic process | 224/8552 | 385/18723 | 4.41e-07 | 6.00e-06 | 224 |
| GO:0072521111 | Esophagus | ESCC | purine-containing compound metabolic process | 238/8552 | 416/18723 | 1.20e-06 | 1.49e-05 | 238 |
| Pathway ID | Tissue | Disease Stage | Description | Gene Ratio | Bg Ratio | pvalue | p.adjust | qvalue | Count |
| hsa0501220 | Cervix | CC | Parkinson disease | 102/1267 | 266/8465 | 1.81e-21 | 1.47e-19 | 8.66e-20 | 102 |
| hsa0502218 | Cervix | CC | Pathways of neurodegeneration - multiple diseases | 128/1267 | 476/8465 | 2.87e-12 | 9.29e-11 | 5.50e-11 | 128 |
| hsa0413718 | Cervix | CC | Mitophagy - animal | 22/1267 | 72/8465 | 5.77e-04 | 2.75e-03 | 1.63e-03 | 22 |
| hsa046213 | Cervix | CC | NOD-like receptor signaling pathway | 41/1267 | 186/8465 | 5.90e-03 | 1.95e-02 | 1.15e-02 | 41 |
| hsa05012110 | Cervix | CC | Parkinson disease | 102/1267 | 266/8465 | 1.81e-21 | 1.47e-19 | 8.66e-20 | 102 |
| hsa0502219 | Cervix | CC | Pathways of neurodegeneration - multiple diseases | 128/1267 | 476/8465 | 2.87e-12 | 9.29e-11 | 5.50e-11 | 128 |
| hsa0413719 | Cervix | CC | Mitophagy - animal | 22/1267 | 72/8465 | 5.77e-04 | 2.75e-03 | 1.63e-03 | 22 |
| hsa0462112 | Cervix | CC | NOD-like receptor signaling pathway | 41/1267 | 186/8465 | 5.90e-03 | 1.95e-02 | 1.15e-02 | 41 |
| hsa05012211 | Esophagus | ESCC | Parkinson disease | 201/4205 | 266/8465 | 1.56e-18 | 8.72e-17 | 4.46e-17 | 201 |
| hsa05022210 | Esophagus | ESCC | Pathways of neurodegeneration - multiple diseases | 318/4205 | 476/8465 | 6.10e-15 | 2.04e-13 | 1.05e-13 | 318 |
| hsa04137210 | Esophagus | ESCC | Mitophagy - animal | 54/4205 | 72/8465 | 9.33e-06 | 4.96e-05 | 2.54e-05 | 54 |
| hsa0462122 | Esophagus | ESCC | NOD-like receptor signaling pathway | 116/4205 | 186/8465 | 2.90e-04 | 1.03e-03 | 5.30e-04 | 116 |
| hsa05012310 | Esophagus | ESCC | Parkinson disease | 201/4205 | 266/8465 | 1.56e-18 | 8.72e-17 | 4.46e-17 | 201 |
| hsa0502238 | Esophagus | ESCC | Pathways of neurodegeneration - multiple diseases | 318/4205 | 476/8465 | 6.10e-15 | 2.04e-13 | 1.05e-13 | 318 |
| hsa0413738 | Esophagus | ESCC | Mitophagy - animal | 54/4205 | 72/8465 | 9.33e-06 | 4.96e-05 | 2.54e-05 | 54 |
| hsa0462132 | Esophagus | ESCC | NOD-like receptor signaling pathway | 116/4205 | 186/8465 | 2.90e-04 | 1.03e-03 | 5.30e-04 | 116 |
| hsa0501230 | Oral cavity | OSCC | Parkinson disease | 188/3704 | 266/8465 | 1.82e-19 | 1.52e-17 | 7.75e-18 | 188 |
| hsa0502228 | Oral cavity | OSCC | Pathways of neurodegeneration - multiple diseases | 292/3704 | 476/8465 | 1.60e-15 | 4.47e-14 | 2.28e-14 | 292 |
| hsa0413728 | Oral cavity | OSCC | Mitophagy - animal | 58/3704 | 72/8465 | 1.48e-10 | 2.07e-09 | 1.05e-09 | 58 |
| hsa046218 | Oral cavity | OSCC | NOD-like receptor signaling pathway | 108/3704 | 186/8465 | 5.13e-05 | 2.07e-04 | 1.05e-04 | 108 |
| Hugo Symbol | Variant Class | Variant Classification | dbSNP RS | HGVSc | HGVSp | HGVSp Short | SWISSPROT | BIOTYPE | SIFT | PolyPhen | Tumor Sample Barcode | Tissue | Histology | Sex | Age | Stage | Therapy Types | Drugs | Outcome |
| MFN1 | SNV | Missense_Mutation | | c.17N>G | p.Ser6Cys | p.S6C | | protein_coding | deleterious(0) | probably_damaging(1) | TCGA-A8-A08L-01 | Breast | breast invasive carcinoma | Female | >=65 | III/IV | Unknown | Unknown | SD |
| MFN1 | SNV | Missense_Mutation | rs748861127 | c.128N>T | p.Pro43Leu | p.P43L | | protein_coding | tolerated(0.08) | benign(0.039) | TCGA-AN-A046-01 | Breast | breast invasive carcinoma | Female | >=65 | I/II | Unknown | Unknown | SD |
| MFN1 | SNV | Missense_Mutation | | c.1132N>C | p.Asp378His | p.D378H | | protein_coding | deleterious(0) | probably_damaging(0.985) | TCGA-AO-A0J4-01 | Breast | breast invasive carcinoma | Female | <65 | I/II | Chemotherapy | doxorubicin | SD |
| MFN1 | SNV | Missense_Mutation | rs774808113 | c.644N>T | p.Thr215Met | p.T215M | | protein_coding | deleterious(0) | benign(0.392) | TCGA-UU-A93S-01 | Breast | breast invasive carcinoma | Female | <65 | III/IV | Unknown | Unknown | PD |
| MFN1 | insertion | Frame_Shift_Ins | novel | c.899_900insGACTGGGTTTCACCATATTGCCCAGGCTGGTCTTG | p.Glu301ThrfsTer45 | p.E301Tfs*45 | | protein_coding | | | TCGA-AN-A0FS-01 | Breast | breast invasive carcinoma | Female | <65 | I/II | Unknown | Unknown | SD |
| MFN1 | deletion | Frame_Shift_Del | novel | c.1955delN | p.Lys653AsnfsTer2 | p.K653Nfs*2 | | protein_coding | | | TCGA-D8-A27V-01 | Breast | breast invasive carcinoma | Female | <65 | I/II | Hormone Therapy | tamoxiphen | SD |
| MFN1 | SNV | Missense_Mutation | novel | c.1863N>T | p.Met621Ile | p.M621I | | protein_coding | tolerated(0.37) | benign(0.005) | TCGA-VS-A8QH-01 | Cervix | cervical & endocervical cancer | Female | >=65 | I/II | Chemotherapy | gemcitabine | PD |
| MFN1 | SNV | Missense_Mutation | novel | c.639G>C | p.Met213Ile | p.M213I | | protein_coding | deleterious(0.02) | benign(0.043) | TCGA-VS-A9UL-01 | Cervix | cervical & endocervical cancer | Female | >=65 | III/IV | Unknown | Unknown | PD |
| MFN1 | SNV | Missense_Mutation | | c.845N>C | p.Phe282Ser | p.F282S | | protein_coding | deleterious(0) | probably_damaging(0.999) | TCGA-A6-6780-01 | Colorectum | colon adenocarcinoma | Male | >=65 | I/II | Unknown | Unknown | SD |
| MFN1 | SNV | Missense_Mutation | | c.82N>C | p.Phe28Leu | p.F28L | | protein_coding | deleterious(0) | benign(0.197) | TCGA-AA-3864-01 | Colorectum | colon adenocarcinoma | Male | >=65 | I/II | Unknown | Unknown | SD |


