
|
|||||
|
 | |
| |
| |
| |
| |
| |
|
Gene: MFGE8 |
Gene summary for MFGE8 |
| Gene information | Species | Human | Gene symbol | MFGE8 | Gene ID | 4240 |
| Gene name | milk fat globule EGF and factor V/VIII domain containing | |
| Gene Alias | BA46 | |
| Cytomap | 15q26.1 | |
| Gene Type | protein-coding | GO ID | GO:0000003 | UniProtAcc | Q08431 |
Top |
Malignant transformation analysis |
| Identification of the aberrant gene expression in precancerous and cancerous lesions by comparing the gene expression of stem-like cells in diseased tissues with normal stem cells |
| Entrez ID | Symbol | Replicates | Species | Organ | Tissue | Adj P-value | Log2FC | Malignancy |
| 4240 | MFGE8 | GSM4909282 | Human | Breast | IDC | 9.60e-31 | 6.30e-01 | -0.0288 |
| 4240 | MFGE8 | GSM4909285 | Human | Breast | IDC | 1.39e-05 | -4.40e-01 | 0.21 |
| 4240 | MFGE8 | GSM4909286 | Human | Breast | IDC | 2.29e-13 | 3.26e-01 | 0.1081 |
| 4240 | MFGE8 | GSM4909290 | Human | Breast | IDC | 5.11e-26 | -6.77e-01 | 0.2096 |
| 4240 | MFGE8 | GSM4909291 | Human | Breast | IDC | 1.29e-10 | -5.80e-01 | 0.1753 |
| 4240 | MFGE8 | GSM4909292 | Human | Breast | IDC | 5.59e-04 | -6.77e-01 | 0.1236 |
| 4240 | MFGE8 | GSM4909293 | Human | Breast | IDC | 1.32e-20 | -6.17e-01 | 0.1581 |
| 4240 | MFGE8 | GSM4909294 | Human | Breast | IDC | 1.00e-29 | -6.54e-01 | 0.2022 |
| 4240 | MFGE8 | GSM4909295 | Human | Breast | IDC | 2.09e-02 | 3.95e-01 | 0.0898 |
| 4240 | MFGE8 | GSM4909296 | Human | Breast | IDC | 1.83e-29 | -6.52e-01 | 0.1524 |
| 4240 | MFGE8 | GSM4909297 | Human | Breast | IDC | 1.50e-32 | -6.29e-01 | 0.1517 |
| 4240 | MFGE8 | GSM4909298 | Human | Breast | IDC | 1.99e-23 | -6.32e-01 | 0.1551 |
| 4240 | MFGE8 | GSM4909301 | Human | Breast | IDC | 5.88e-29 | -6.52e-01 | 0.1577 |
| 4240 | MFGE8 | GSM4909302 | Human | Breast | IDC | 2.09e-20 | -5.93e-01 | 0.1545 |
| 4240 | MFGE8 | GSM4909304 | Human | Breast | IDC | 1.19e-19 | -6.18e-01 | 0.1636 |
| 4240 | MFGE8 | GSM4909306 | Human | Breast | IDC | 3.39e-20 | -5.76e-01 | 0.1564 |
| 4240 | MFGE8 | GSM4909307 | Human | Breast | IDC | 1.18e-16 | -5.69e-01 | 0.1569 |
| 4240 | MFGE8 | GSM4909308 | Human | Breast | IDC | 4.51e-27 | -6.65e-01 | 0.158 |
| 4240 | MFGE8 | GSM4909311 | Human | Breast | IDC | 3.12e-25 | -5.73e-01 | 0.1534 |
| 4240 | MFGE8 | GSM4909312 | Human | Breast | IDC | 1.65e-35 | -6.72e-01 | 0.1552 |
| Page: 1 2 3 4 5 6 7 8 9 |
| Tissue | Expression Dynamics | Abbreviation |
| Breast | 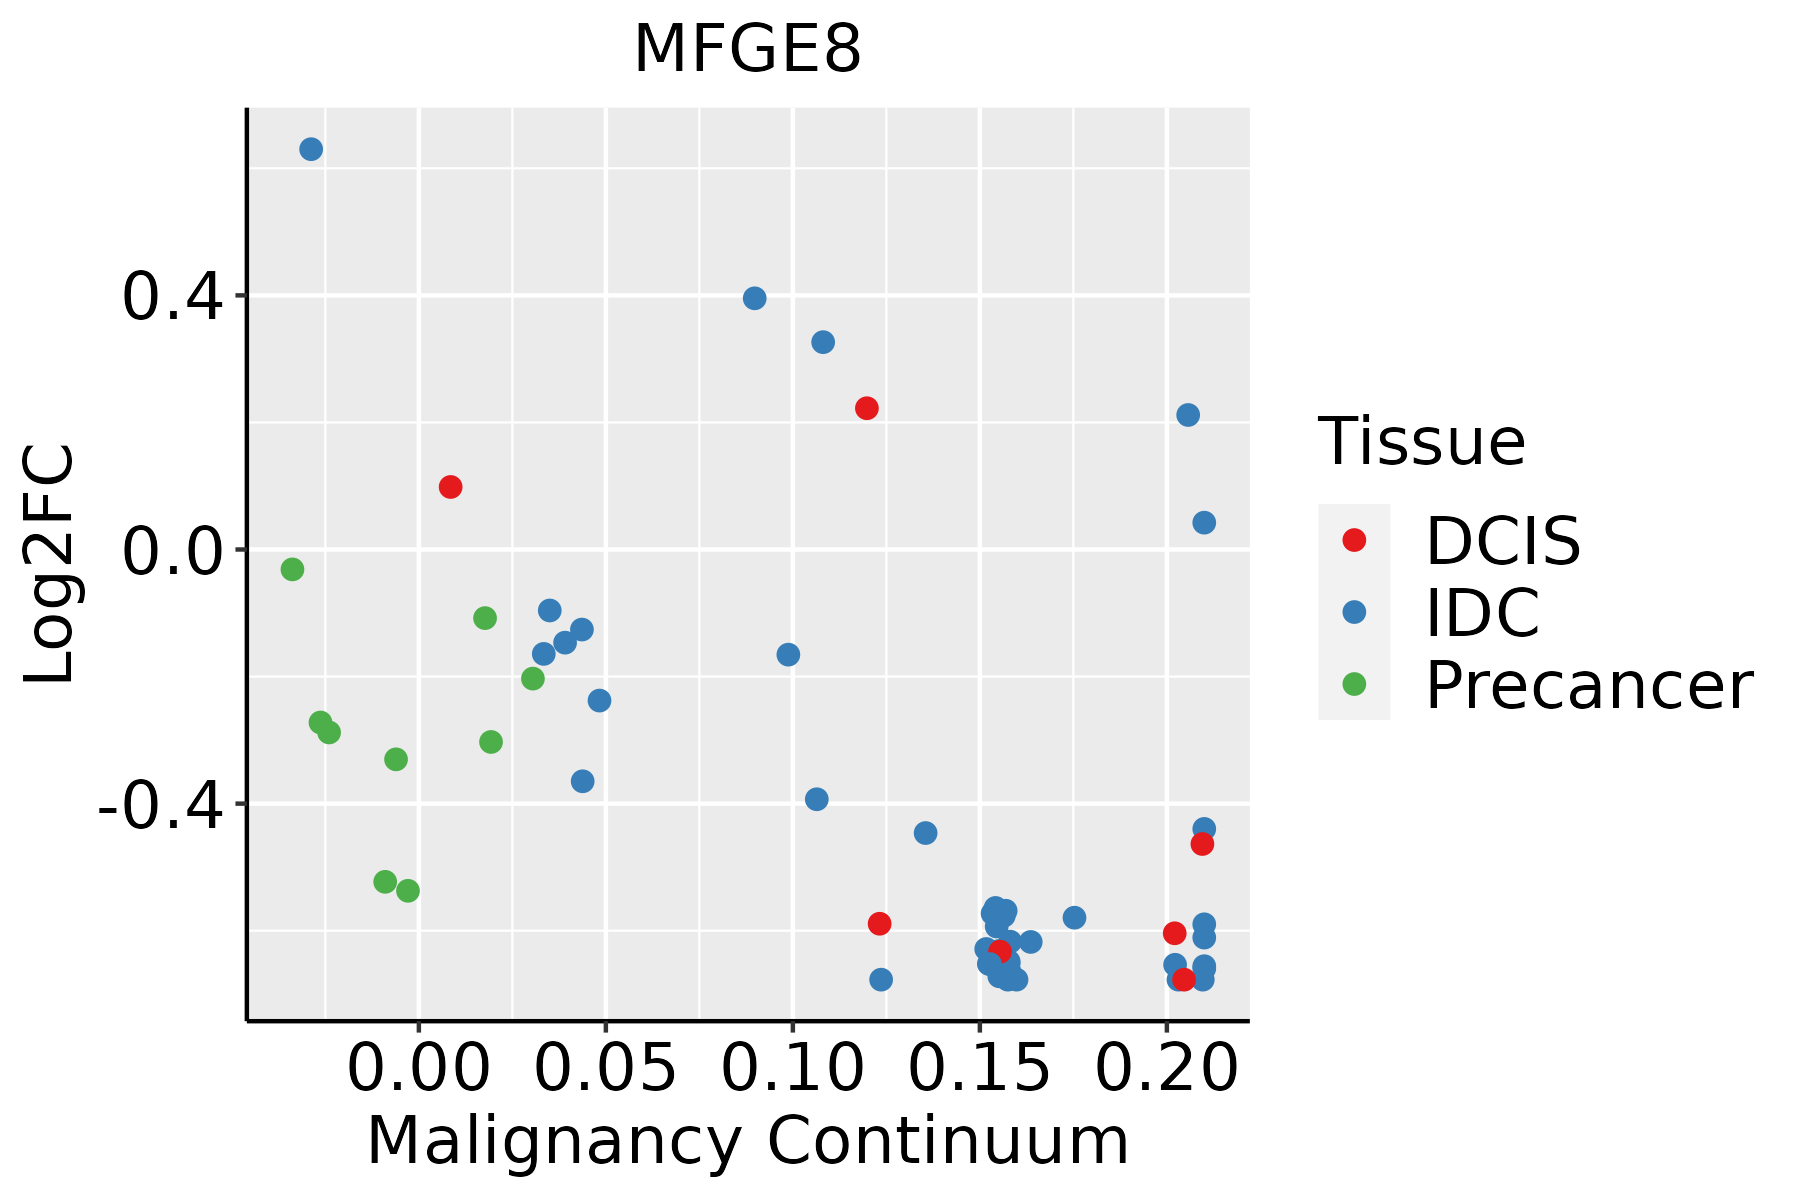 | IDC: Invasive ductal carcinoma |
| DCIS: Ductal carcinoma in situ | ||
| Precancer(BRCA1-mut): Precancerous lesion from BRCA1 mutation carriers | ||
| Endometrium | 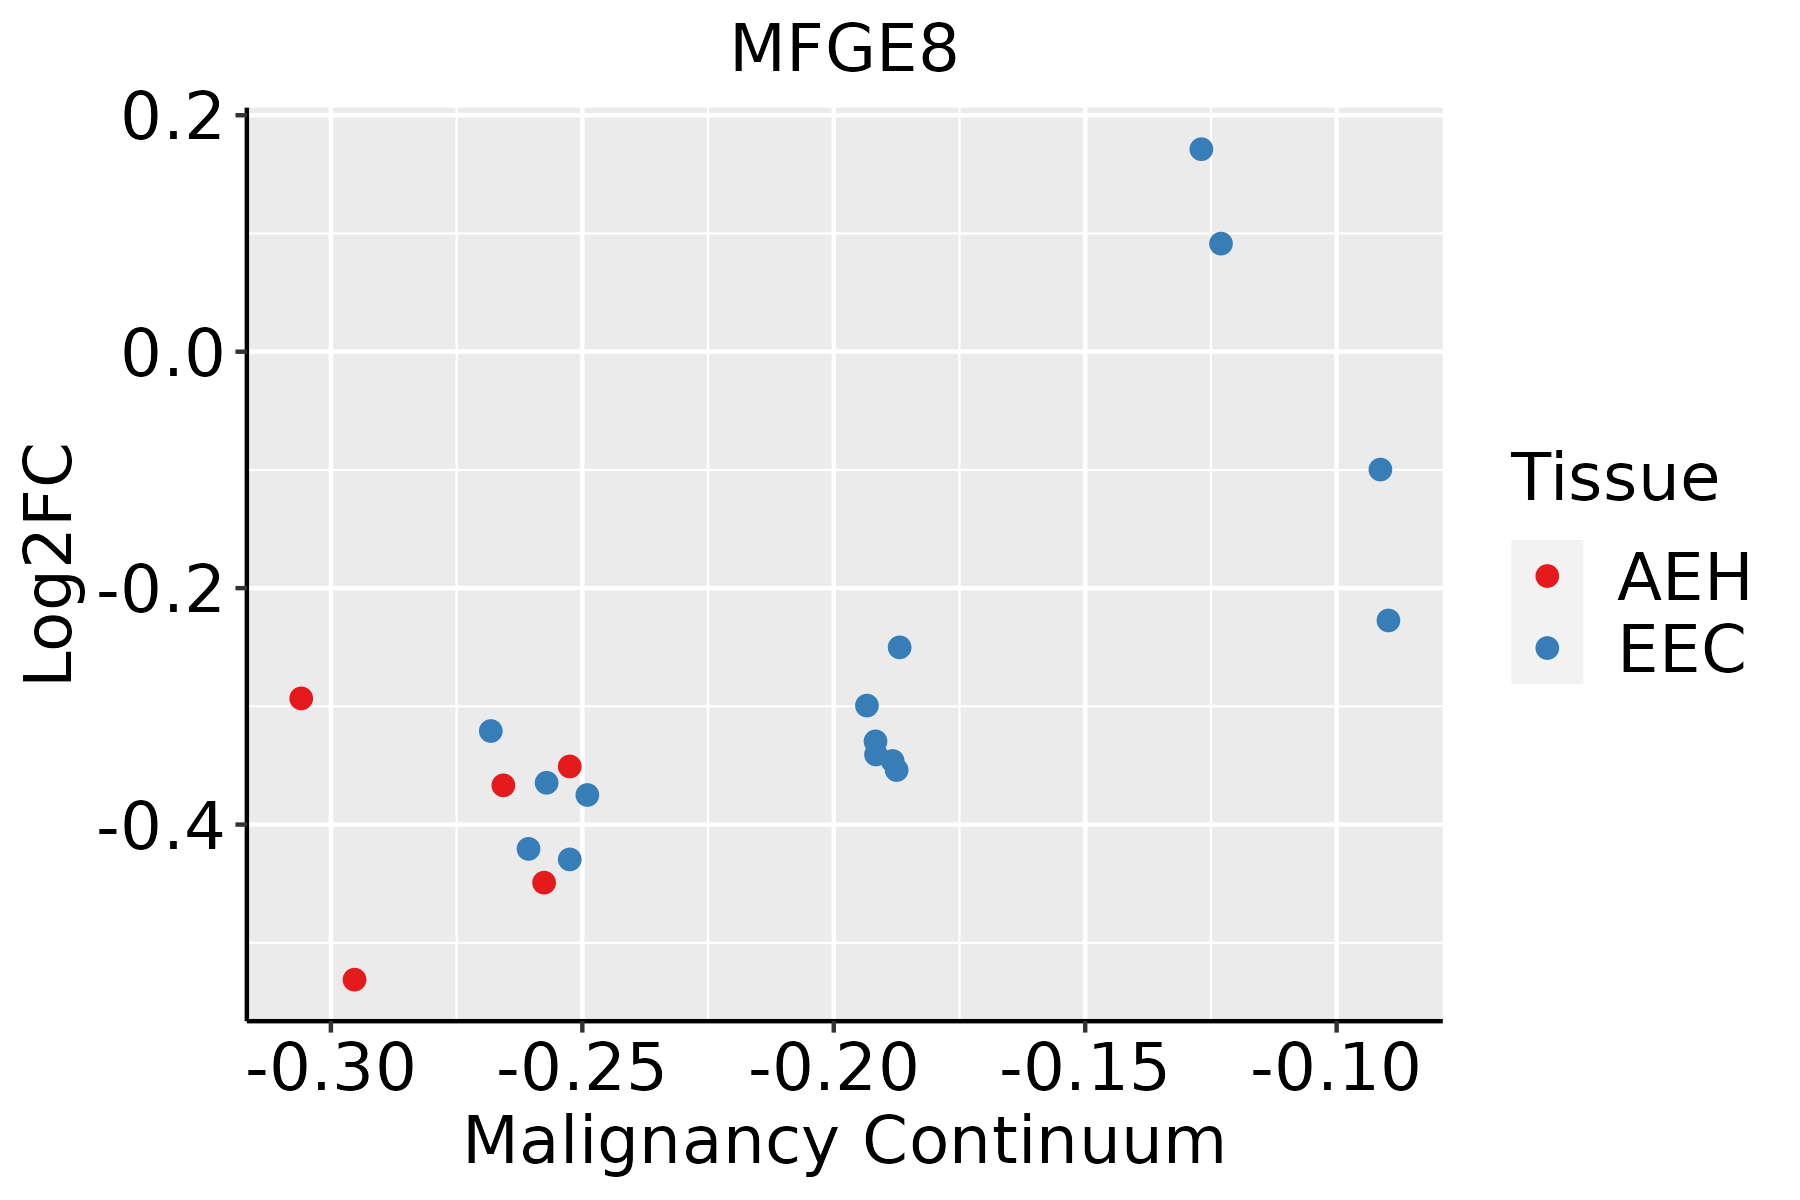 | AEH: Atypical endometrial hyperplasia |
| EEC: Endometrioid Cancer | ||
| Esophagus | 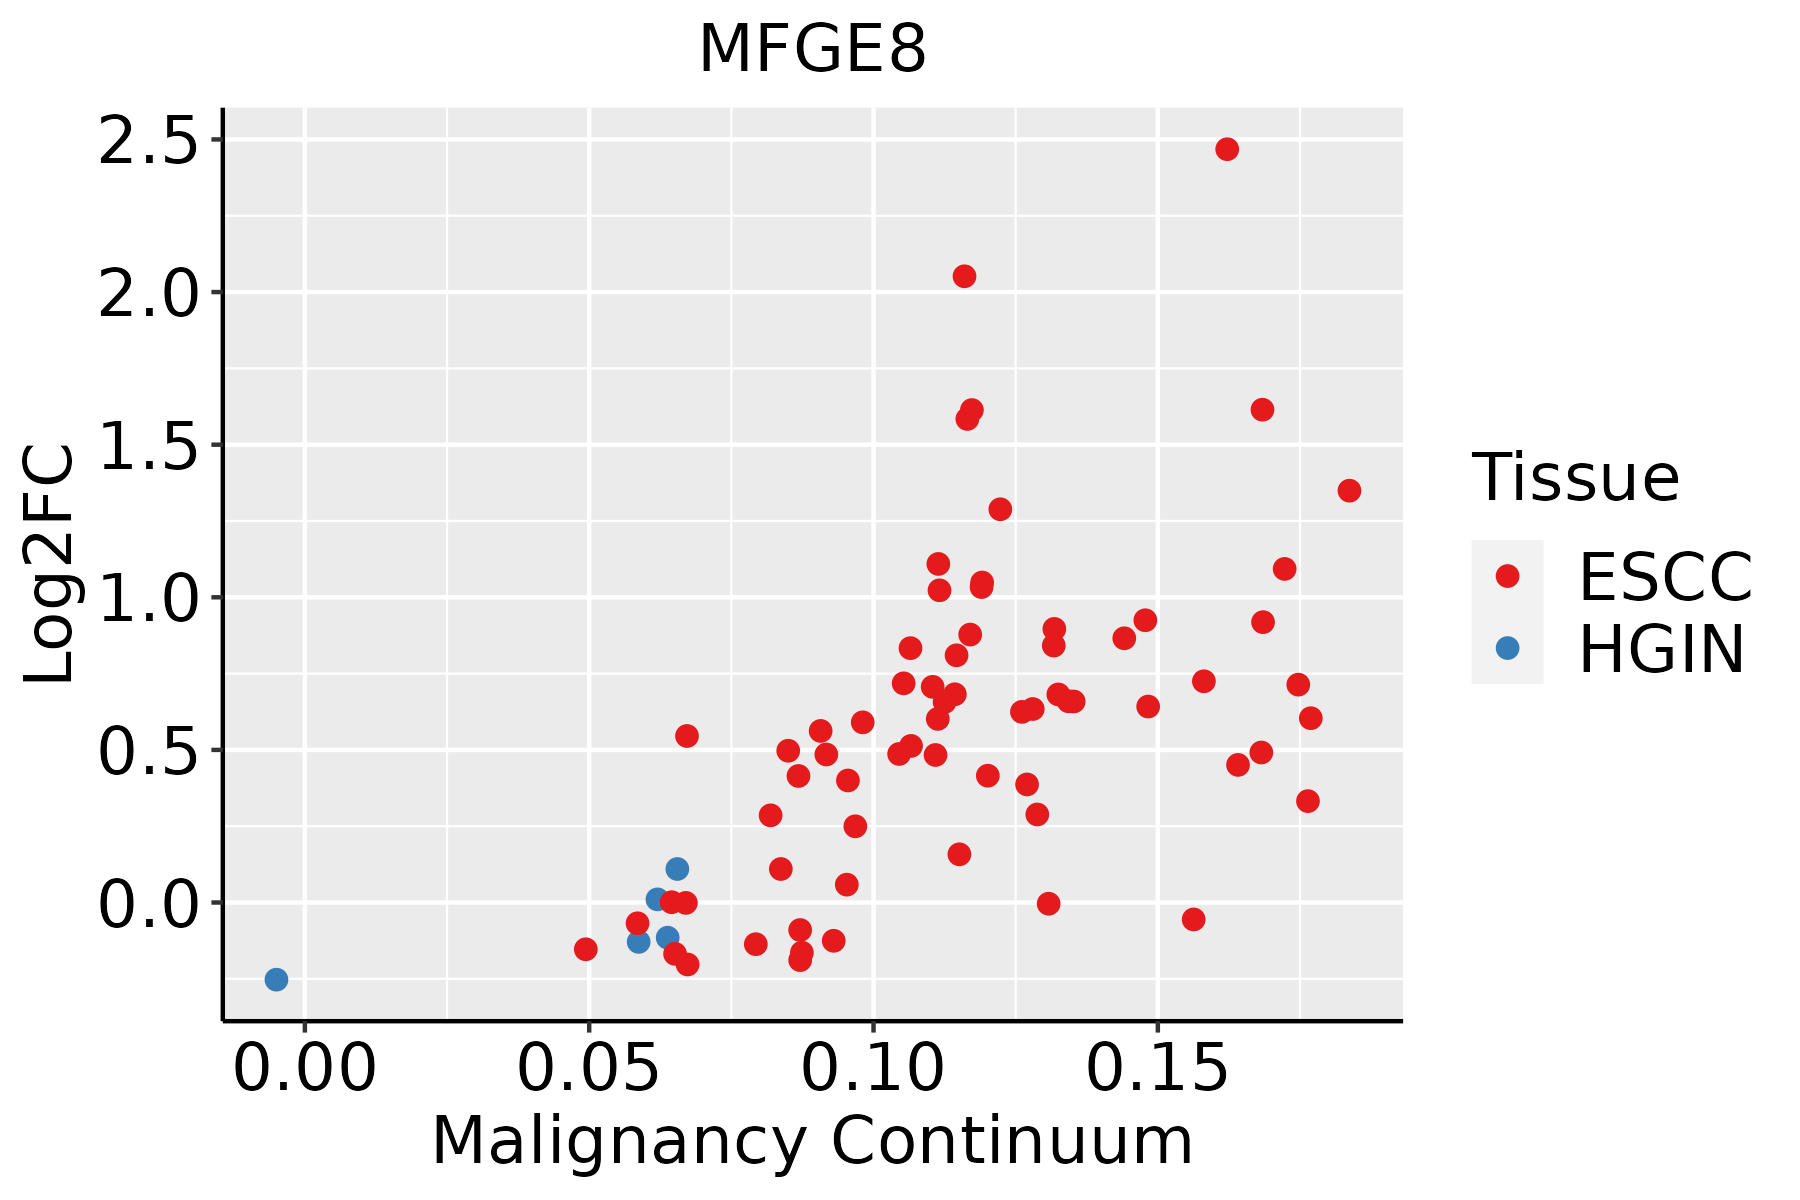 | ESCC: Esophageal squamous cell carcinoma |
| HGIN: High-grade intraepithelial neoplasias | ||
| LGIN: Low-grade intraepithelial neoplasias | ||
| Liver | 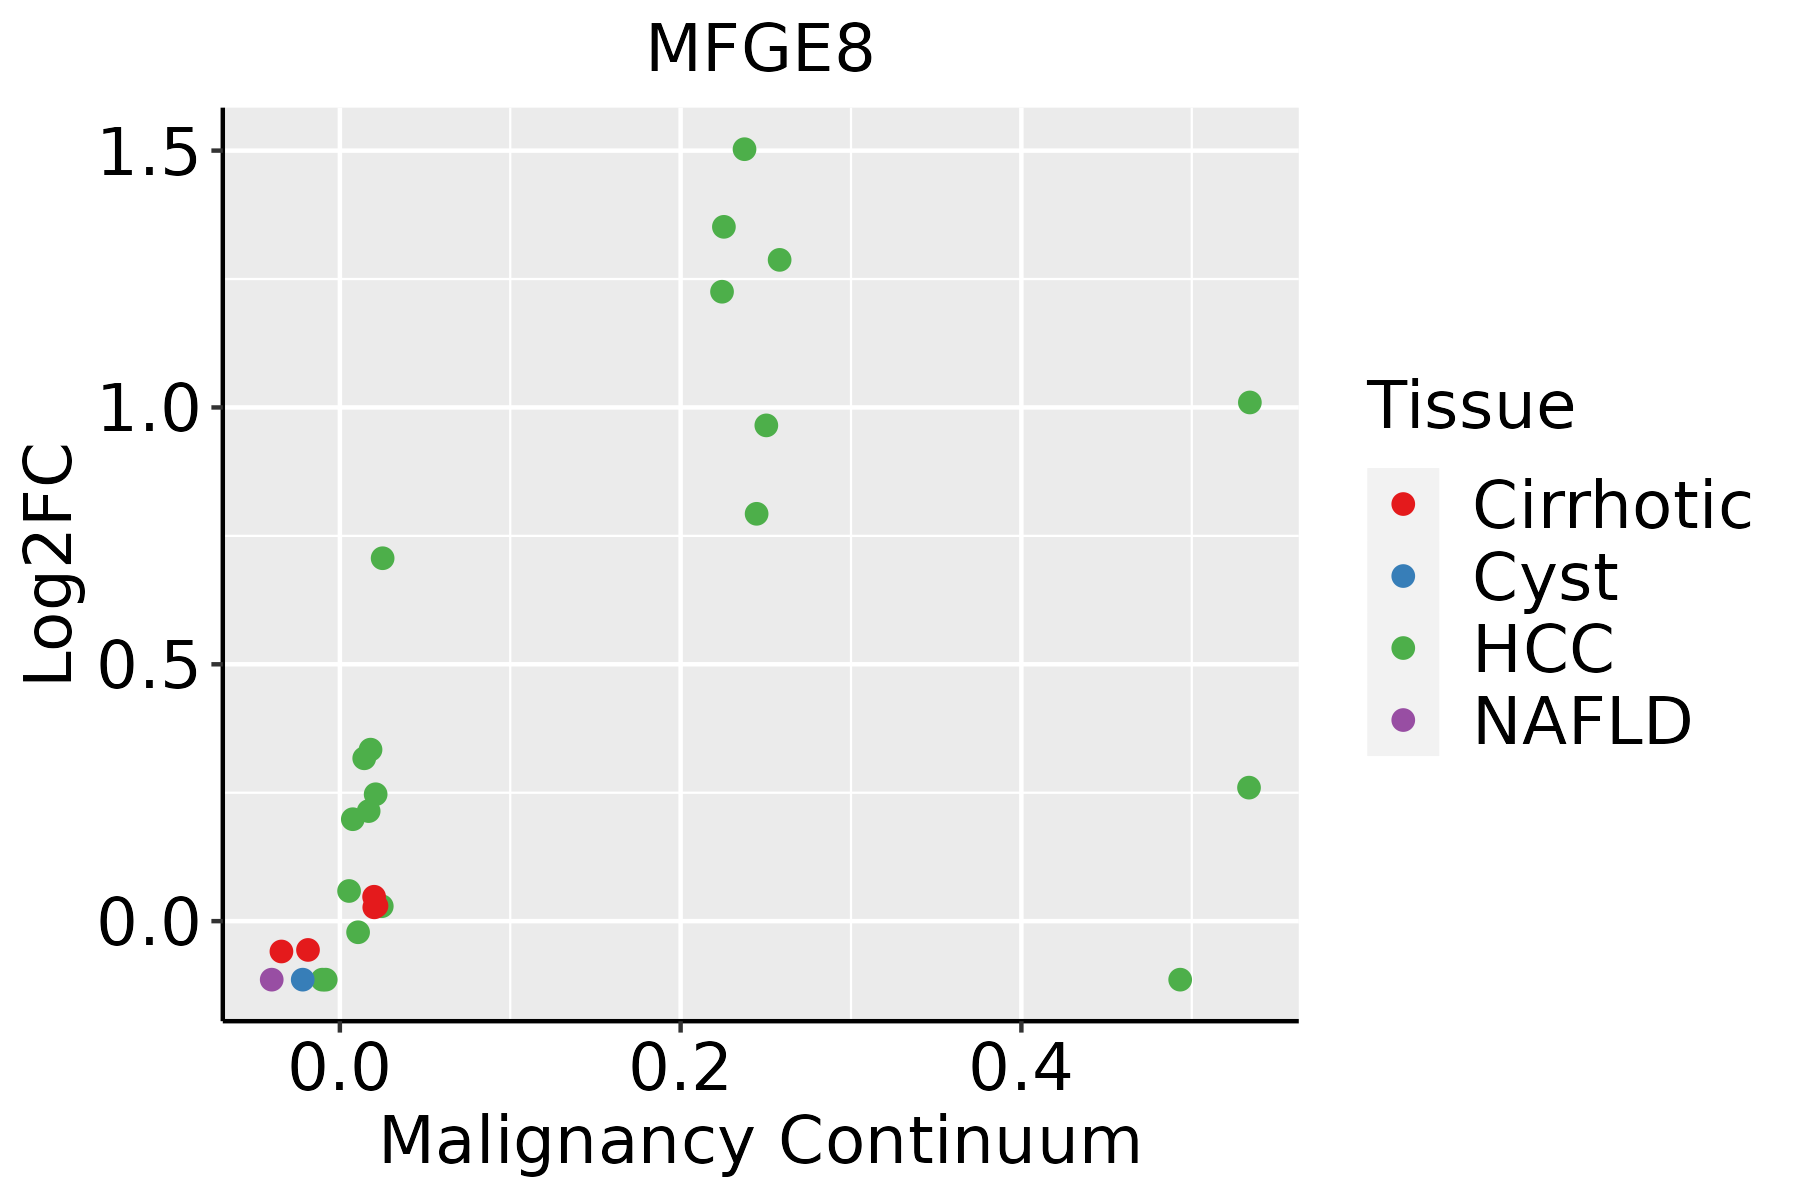 | HCC: Hepatocellular carcinoma |
| NAFLD: Non-alcoholic fatty liver disease | ||
| Oral Cavity | 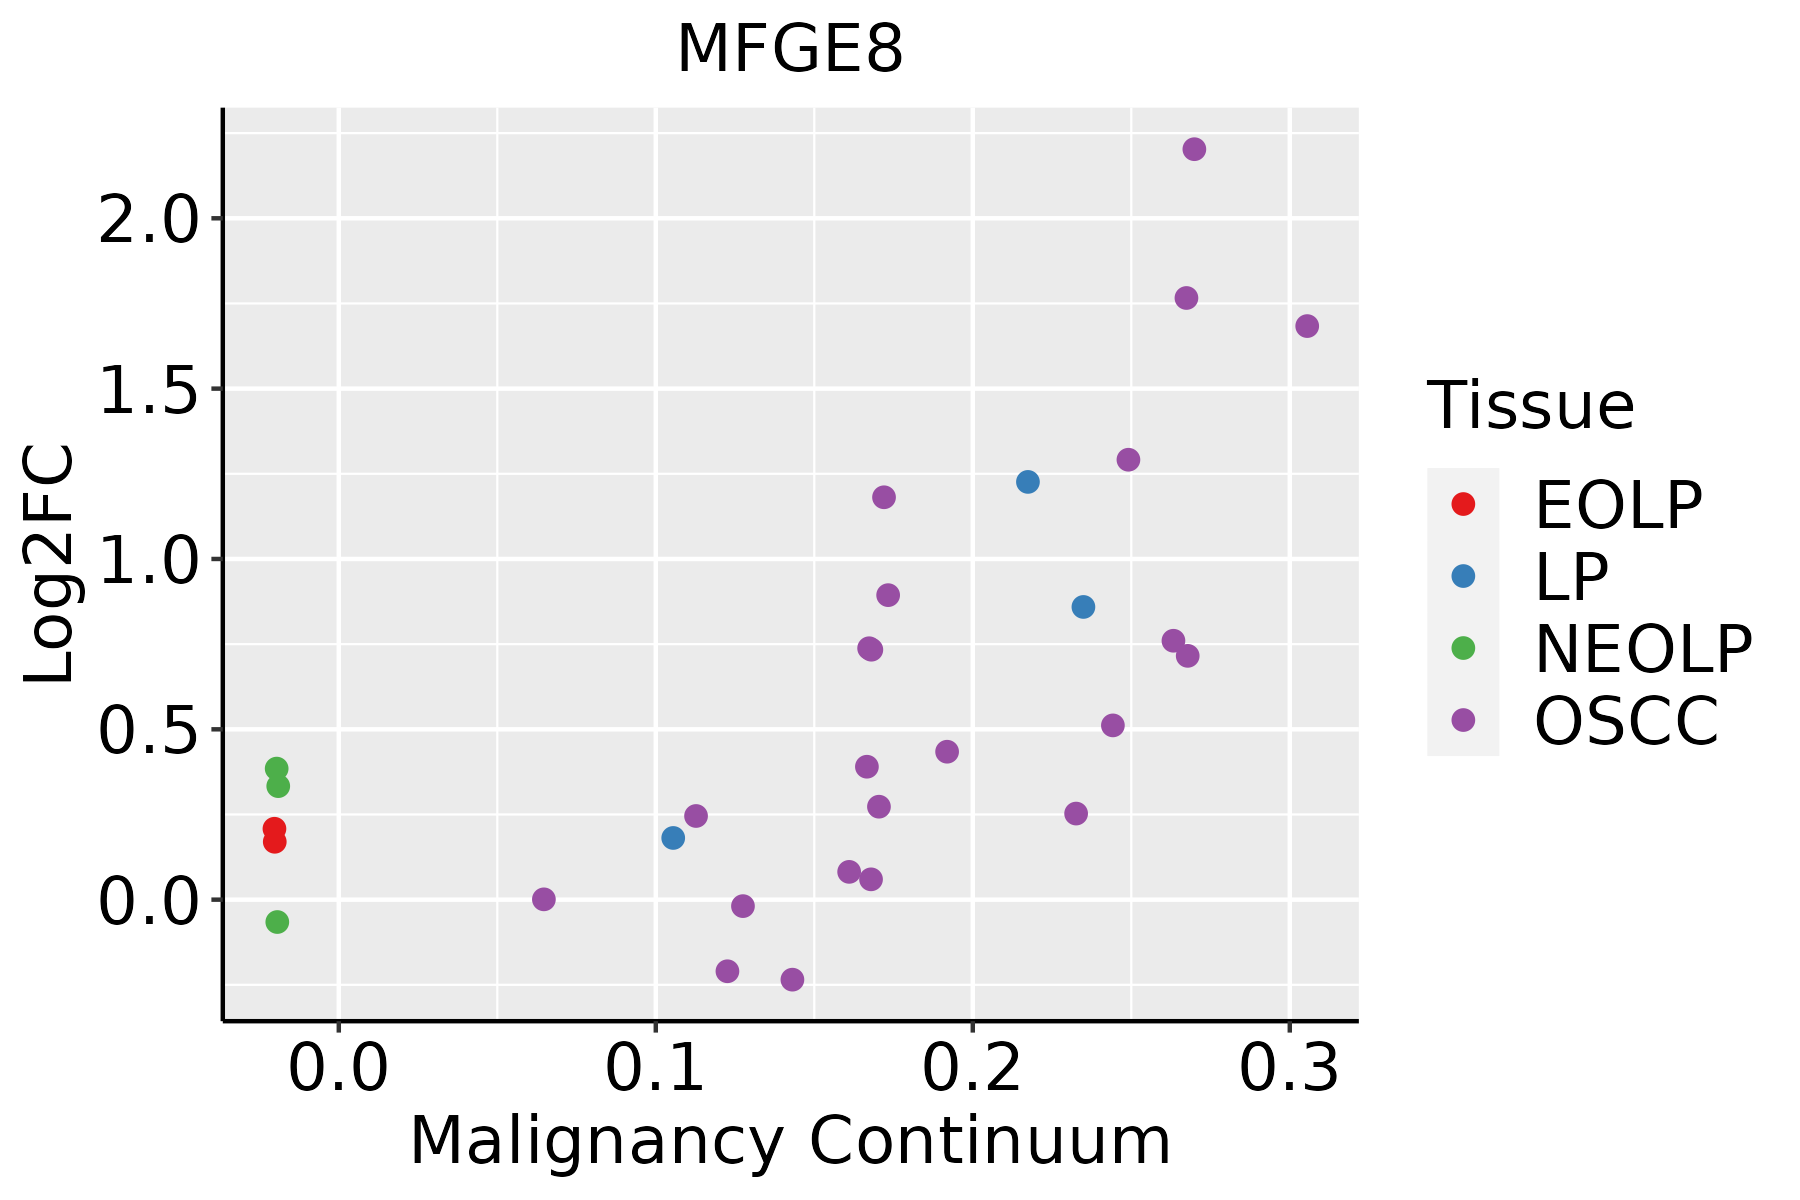 | EOLP: Erosive Oral lichen planus |
| LP: leukoplakia | ||
| NEOLP: Non-erosive oral lichen planus | ||
| OSCC: Oral squamous cell carcinoma | ||
| Thyroid | 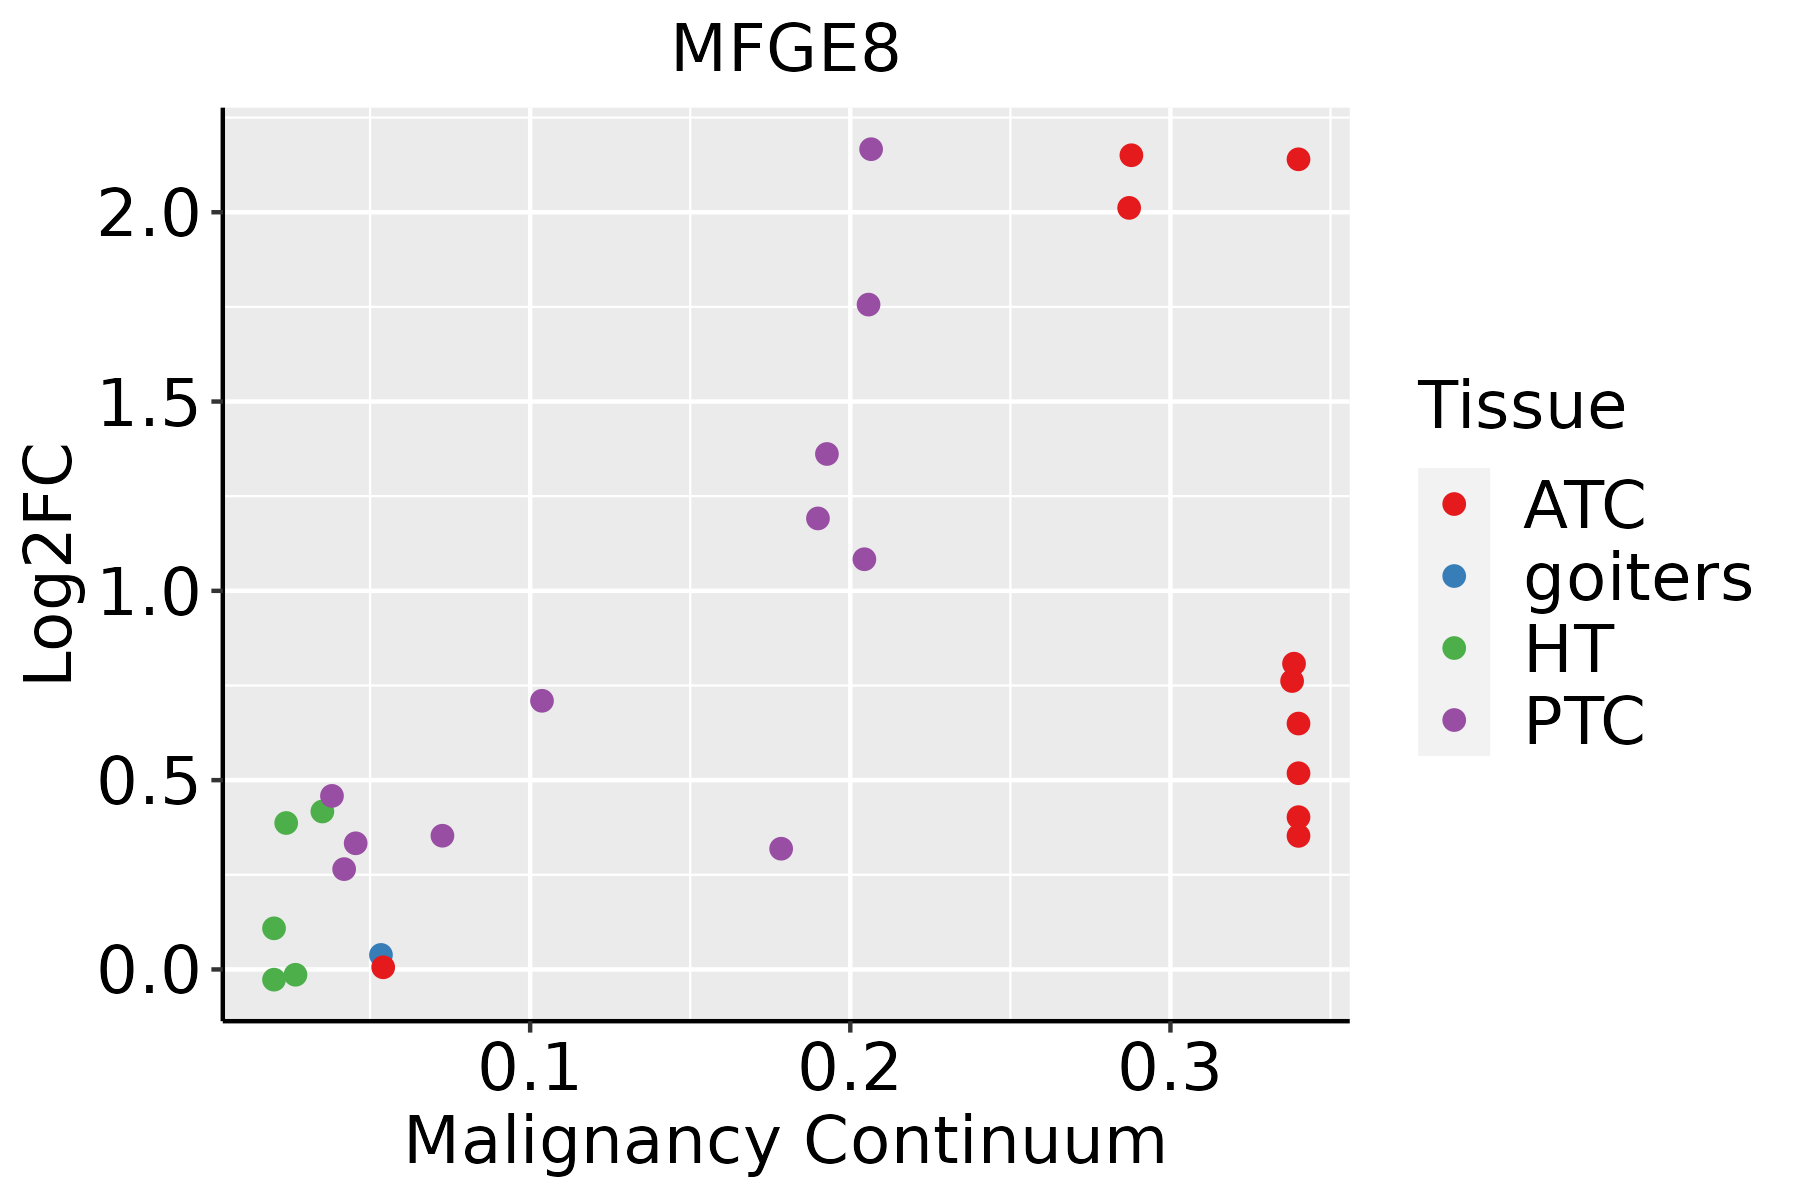 | ATC: Anaplastic thyroid cancer |
| HT: Hashimoto's thyroiditis | ||
| PTC: Papillary thyroid cancer |
| ∗log2FC in expression of this searched gene in stem-like cells from each diseased tissue sample relative to stem-like cells in normal samples in each tissue plotted against the malignancy continuum. Samples are colored based on if they are from different disease stage. |
Top |
Malignant transformation related pathway analysis |
| Find out the enriched GO biological processes and KEGG pathways involved in transition from healthy to precancer to cancer |
| Tissue | Disease Stage | Enriched GO biological Processes |
| Colorectum | AD |  |
| Colorectum | SER |  |
| Colorectum | MSS |  |
| Colorectum | MSI-H |  |
| Colorectum | FAP |  |
| ∗Top 15 enriched GO BP terms are showed in the bar plot of each disease state in each tissue. Each row represents a significant GO biological process which is colored according to the -log10(p.adjust). |
| Page: 1 2 3 4 5 6 7 8 9 |
| GO ID | Tissue | Disease Stage | Description | Gene Ratio | Bg Ratio | pvalue | p.adjust | Count |
| GO:00507643 | Oral cavity | OSCC | regulation of phagocytosis | 48/7305 | 95/18723 | 1.47e-02 | 4.77e-02 | 48 |
| GO:00080371 | Thyroid | HT | cell recognition | 31/1272 | 225/18723 | 1.35e-04 | 2.12e-03 | 31 |
| GO:00069094 | Thyroid | HT | phagocytosis | 34/1272 | 308/18723 | 3.59e-03 | 2.73e-02 | 34 |
| GO:00103244 | Thyroid | HT | membrane invagination | 19/1272 | 144/18723 | 4.08e-03 | 2.99e-02 | 19 |
| GO:00990243 | Thyroid | HT | plasma membrane invagination | 18/1272 | 136/18723 | 4.93e-03 | 3.35e-02 | 18 |
| GO:00069113 | Thyroid | HT | phagocytosis, engulfment | 17/1272 | 127/18723 | 5.51e-03 | 3.63e-02 | 17 |
| Page: 1 |
| Pathway ID | Tissue | Disease Stage | Description | Gene Ratio | Bg Ratio | pvalue | p.adjust | qvalue | Count |
| Page: 1 |
Top |
Cell-cell communication analysis |
| Identification of potential cell-cell interactions between two cell types and their ligand-receptor pairs for different disease states |
| Ligand | Receptor | LRpair | Pathway | Tissue | Disease Stage |
| Page: 1 |
Top |
Single-cell gene regulatory network inference analysis |
| Find out the significant the regulons (TFs) and the target genes of each regulon across cell types for different disease states |
| TF | Cell Type | Tissue | Disease Stage | Target Gene | RSS | Regulon Activity |
| ∗The dot plots of a searched regulon are shown for all cell subpopulations in each disease state of each tissue based on the regulon specific score inferred using pySCENIC and by calculating the average expression. |
| Page: 1 |
Top |
Somatic mutation of malignant transformation related genes |
| Annotation of somatic variants for genes involved in malignant transformation |
| Hugo Symbol | Variant Class | Variant Classification | dbSNP RS | HGVSc | HGVSp | HGVSp Short | SWISSPROT | BIOTYPE | SIFT | PolyPhen | Tumor Sample Barcode | Tissue | Histology | Sex | Age | Stage | Therapy Types | Drugs | Outcome |
| MFGE8 | SNV | Missense_Mutation | rs776606175 | c.400C>T | p.Arg134Trp | p.R134W | Q08431 | protein_coding | deleterious(0) | probably_damaging(0.999) | TCGA-D8-A140-01 | Breast | breast invasive carcinoma | Female | <65 | I/II | Chemotherapy | doxorubicin+cyclophosphamid | SD |
| MFGE8 | insertion | Nonsense_Mutation | novel | c.562_563insGATGACCATGACTTGGGGTGAGGGGAGAGAGCAAGACAAGGACTGC | p.Lys188ArgfsTer2 | p.K188Rfs*2 | Q08431 | protein_coding | TCGA-A8-A07G-01 | Breast | breast invasive carcinoma | Female | >=65 | I/II | Chemotherapy | 5-fluorouracil | CR | ||
| MFGE8 | SNV | Missense_Mutation | rs769108892 | c.502N>A | p.Glu168Lys | p.E168K | Q08431 | protein_coding | tolerated(1) | benign(0) | TCGA-FU-A3HZ-01 | Cervix | cervical & endocervical cancer | Female | <65 | I/II | Chemotherapy | cisplatin | CR |
| MFGE8 | SNV | Missense_Mutation | c.983C>T | p.Ala328Val | p.A328V | Q08431 | protein_coding | tolerated(0.49) | benign(0.001) | TCGA-A6-6648-01 | Colorectum | colon adenocarcinoma | Male | <65 | I/II | Chemotherapy | oxaliplatin | PD | |
| MFGE8 | SNV | Missense_Mutation | rs751746916 | c.1062G>T | p.Lys354Asn | p.K354N | Q08431 | protein_coding | deleterious(0.05) | probably_damaging(0.976) | TCGA-AA-3510-01 | Colorectum | colon adenocarcinoma | Male | >=65 | I/II | Unknown | Unknown | SD |
| MFGE8 | SNV | Missense_Mutation | rs769108892 | c.502G>A | p.Glu168Lys | p.E168K | Q08431 | protein_coding | tolerated(1) | benign(0) | TCGA-AA-3510-01 | Colorectum | colon adenocarcinoma | Male | >=65 | I/II | Unknown | Unknown | SD |
| MFGE8 | SNV | Missense_Mutation | c.95G>A | p.Cys32Tyr | p.C32Y | Q08431 | protein_coding | deleterious(0) | probably_damaging(1) | TCGA-AA-3864-01 | Colorectum | colon adenocarcinoma | Male | >=65 | I/II | Unknown | Unknown | SD | |
| MFGE8 | SNV | Missense_Mutation | rs769108892 | c.502N>A | p.Glu168Lys | p.E168K | Q08431 | protein_coding | tolerated(1) | benign(0) | TCGA-AA-3984-01 | Colorectum | colon adenocarcinoma | Female | <65 | I/II | Unknown | Unknown | SD |
| MFGE8 | SNV | Missense_Mutation | novel | c.1065N>T | p.Lys355Asn | p.K355N | Q08431 | protein_coding | deleterious(0) | probably_damaging(0.982) | TCGA-AA-A00N-01 | Colorectum | colon adenocarcinoma | Male | >=65 | I/II | Unknown | Unknown | PD |
| MFGE8 | SNV | Missense_Mutation | rs780674687 | c.508G>A | p.Asp170Asn | p.D170N | Q08431 | protein_coding | tolerated(0.34) | benign(0.001) | TCGA-AA-A010-01 | Colorectum | colon adenocarcinoma | Female | <65 | I/II | Chemotherapy | folinic | CR |
| Page: 1 2 3 4 5 6 7 |
Top |
Related drugs of malignant transformation related genes |
| Identification of chemicals and drugs interact with genes involved in malignant transfromation |
| (DGIdb 4.0) |
| Entrez ID | Symbol | Category | Interaction Types | Drug Claim Name | Drug Name | PMIDs |
| 4240 | MFGE8 | DRUGGABLE GENOME, EXTERNAL SIDE OF PLASMA MEMBRANE | TRIAB |
| Page: 1 |

Copyright 2023-Present -The University of Texas Health Science Center at Houston |