
|
|||||
|
 | |
| |
| |
| |
| |
| |
|
Gene: MFAP4 |
Gene summary for MFAP4 |
| Gene information | Species | Human | Gene symbol | MFAP4 | Gene ID | 4239 |
| Gene name | microfibril associated protein 4 | |
| Gene Alias | MFAP4 | |
| Cytomap | 17p11.2 | |
| Gene Type | protein-coding | GO ID | GO:0001867 | UniProtAcc | A0A024QZ34 |
Top |
Malignant transformation analysis |
| Identification of the aberrant gene expression in precancerous and cancerous lesions by comparing the gene expression of stem-like cells in diseased tissues with normal stem cells |
| Entrez ID | Symbol | Replicates | Species | Organ | Tissue | Adj P-value | Log2FC | Malignancy |
| 4239 | MFAP4 | LZE2T | Human | Esophagus | ESCC | 1.15e-14 | 2.80e-01 | 0.082 |
| 4239 | MFAP4 | LZE4T | Human | Esophagus | ESCC | 5.39e-04 | -4.15e-01 | 0.0811 |
| 4239 | MFAP4 | LZE8T | Human | Esophagus | ESCC | 8.10e-05 | -1.82e-01 | 0.067 |
| 4239 | MFAP4 | LZE20T | Human | Esophagus | ESCC | 1.62e-03 | -4.15e-01 | 0.0662 |
| 4239 | MFAP4 | LZE24T | Human | Esophagus | ESCC | 3.09e-05 | -4.07e-01 | 0.0596 |
| 4239 | MFAP4 | P2T-E | Human | Esophagus | ESCC | 1.91e-26 | 1.36e+00 | 0.1177 |
| 4239 | MFAP4 | P10T-E | Human | Esophagus | ESCC | 4.11e-34 | 1.35e+00 | 0.116 |
| 4239 | MFAP4 | P12T-E | Human | Esophagus | ESCC | 4.65e-08 | -3.22e-01 | 0.1122 |
| 4239 | MFAP4 | P20T-E | Human | Esophagus | ESCC | 4.21e-03 | -1.94e-01 | 0.1124 |
| 4239 | MFAP4 | P21T-E | Human | Esophagus | ESCC | 2.77e-07 | -3.98e-01 | 0.1617 |
| 4239 | MFAP4 | P24T-E | Human | Esophagus | ESCC | 3.17e-05 | -2.75e-01 | 0.1287 |
| 4239 | MFAP4 | P26T-E | Human | Esophagus | ESCC | 1.22e-30 | -3.70e-01 | 0.1276 |
| 4239 | MFAP4 | P27T-E | Human | Esophagus | ESCC | 1.04e-02 | -1.24e-01 | 0.1055 |
| 4239 | MFAP4 | P28T-E | Human | Esophagus | ESCC | 4.82e-07 | -4.06e-01 | 0.1149 |
| 4239 | MFAP4 | P30T-E | Human | Esophagus | ESCC | 1.89e-03 | 4.38e-01 | 0.137 |
| 4239 | MFAP4 | P31T-E | Human | Esophagus | ESCC | 8.17e-03 | -3.41e-01 | 0.1251 |
| 4239 | MFAP4 | P32T-E | Human | Esophagus | ESCC | 2.39e-03 | 1.21e-02 | 0.1666 |
| 4239 | MFAP4 | P36T-E | Human | Esophagus | ESCC | 2.55e-04 | 4.20e-01 | 0.1187 |
| 4239 | MFAP4 | P39T-E | Human | Esophagus | ESCC | 1.69e-06 | -2.71e-01 | 0.0894 |
| 4239 | MFAP4 | P40T-E | Human | Esophagus | ESCC | 9.53e-06 | -2.32e-01 | 0.109 |
| Page: 1 2 3 4 |
| Tissue | Expression Dynamics | Abbreviation |
| Esophagus | 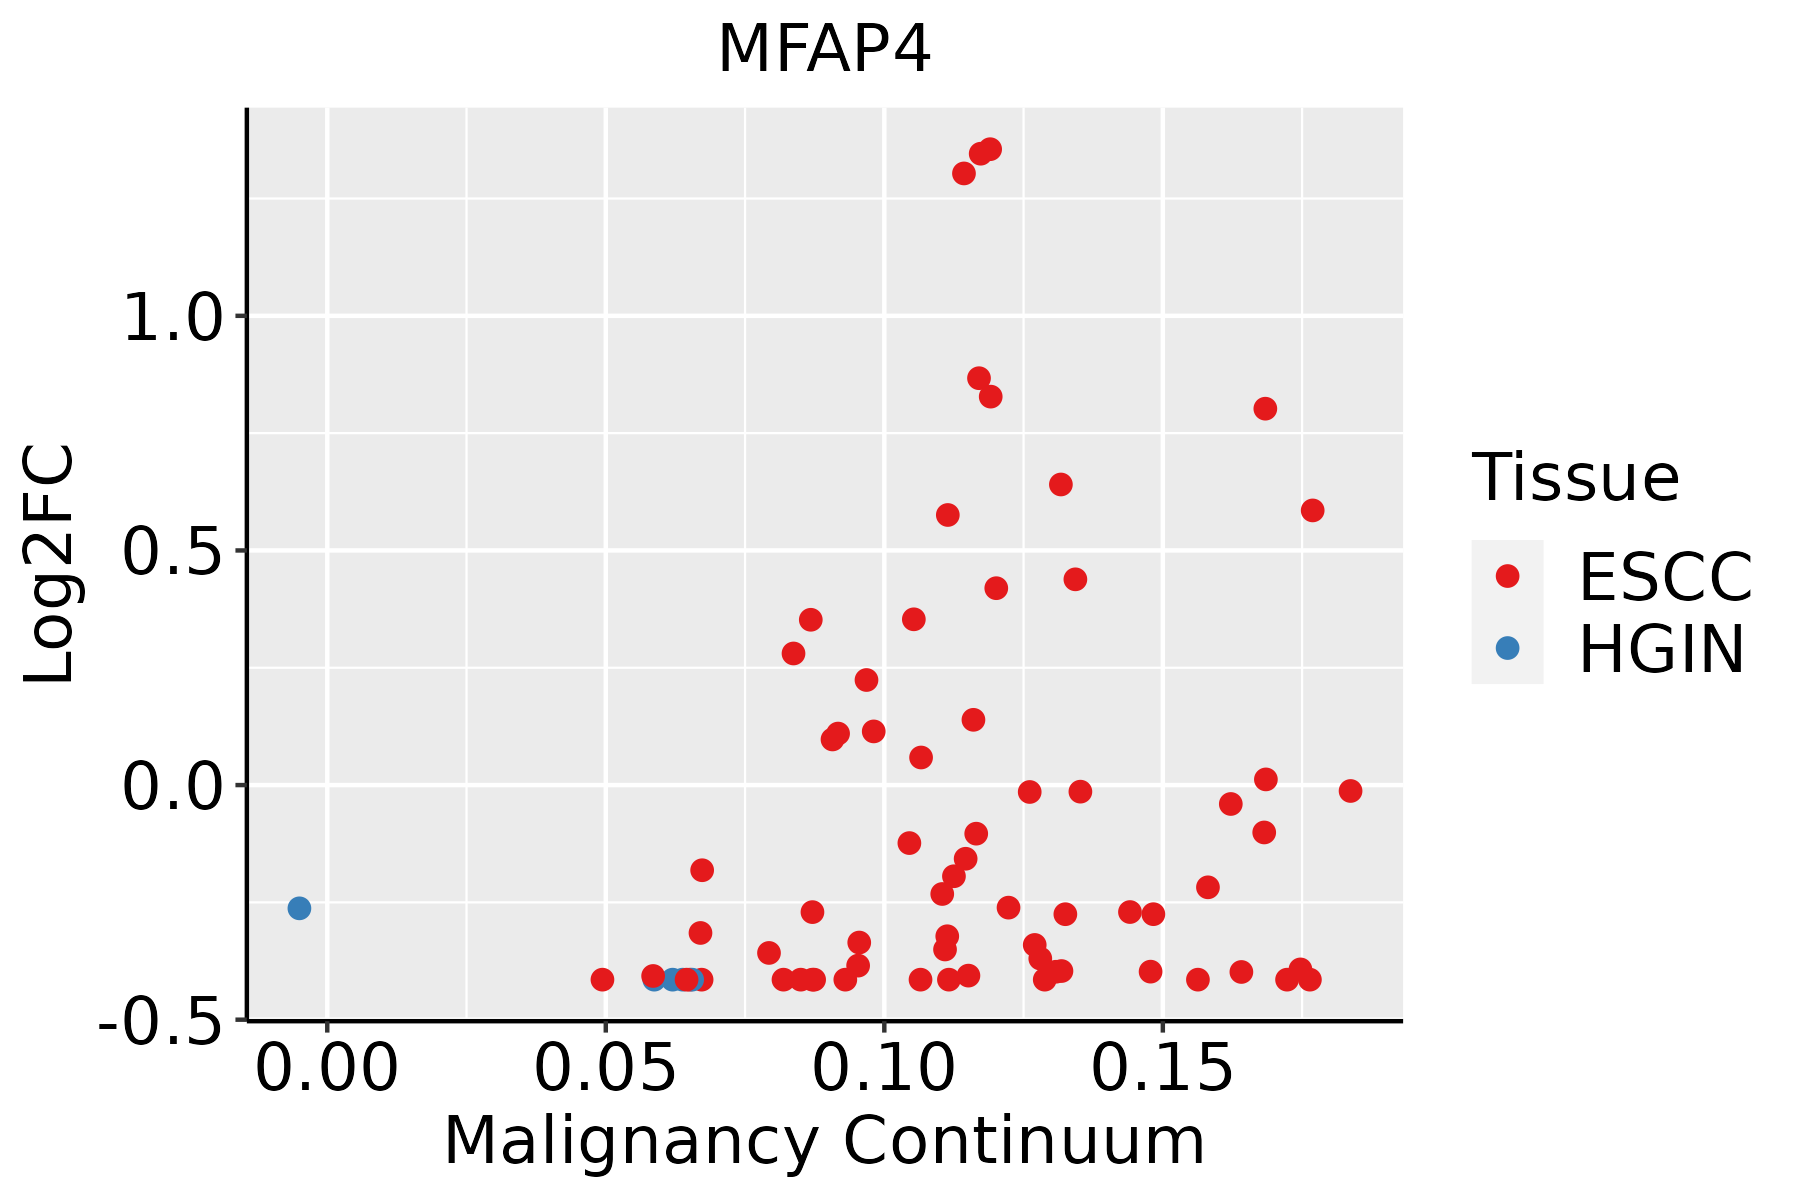 | ESCC: Esophageal squamous cell carcinoma |
| HGIN: High-grade intraepithelial neoplasias | ||
| LGIN: Low-grade intraepithelial neoplasias | ||
| Oral Cavity | 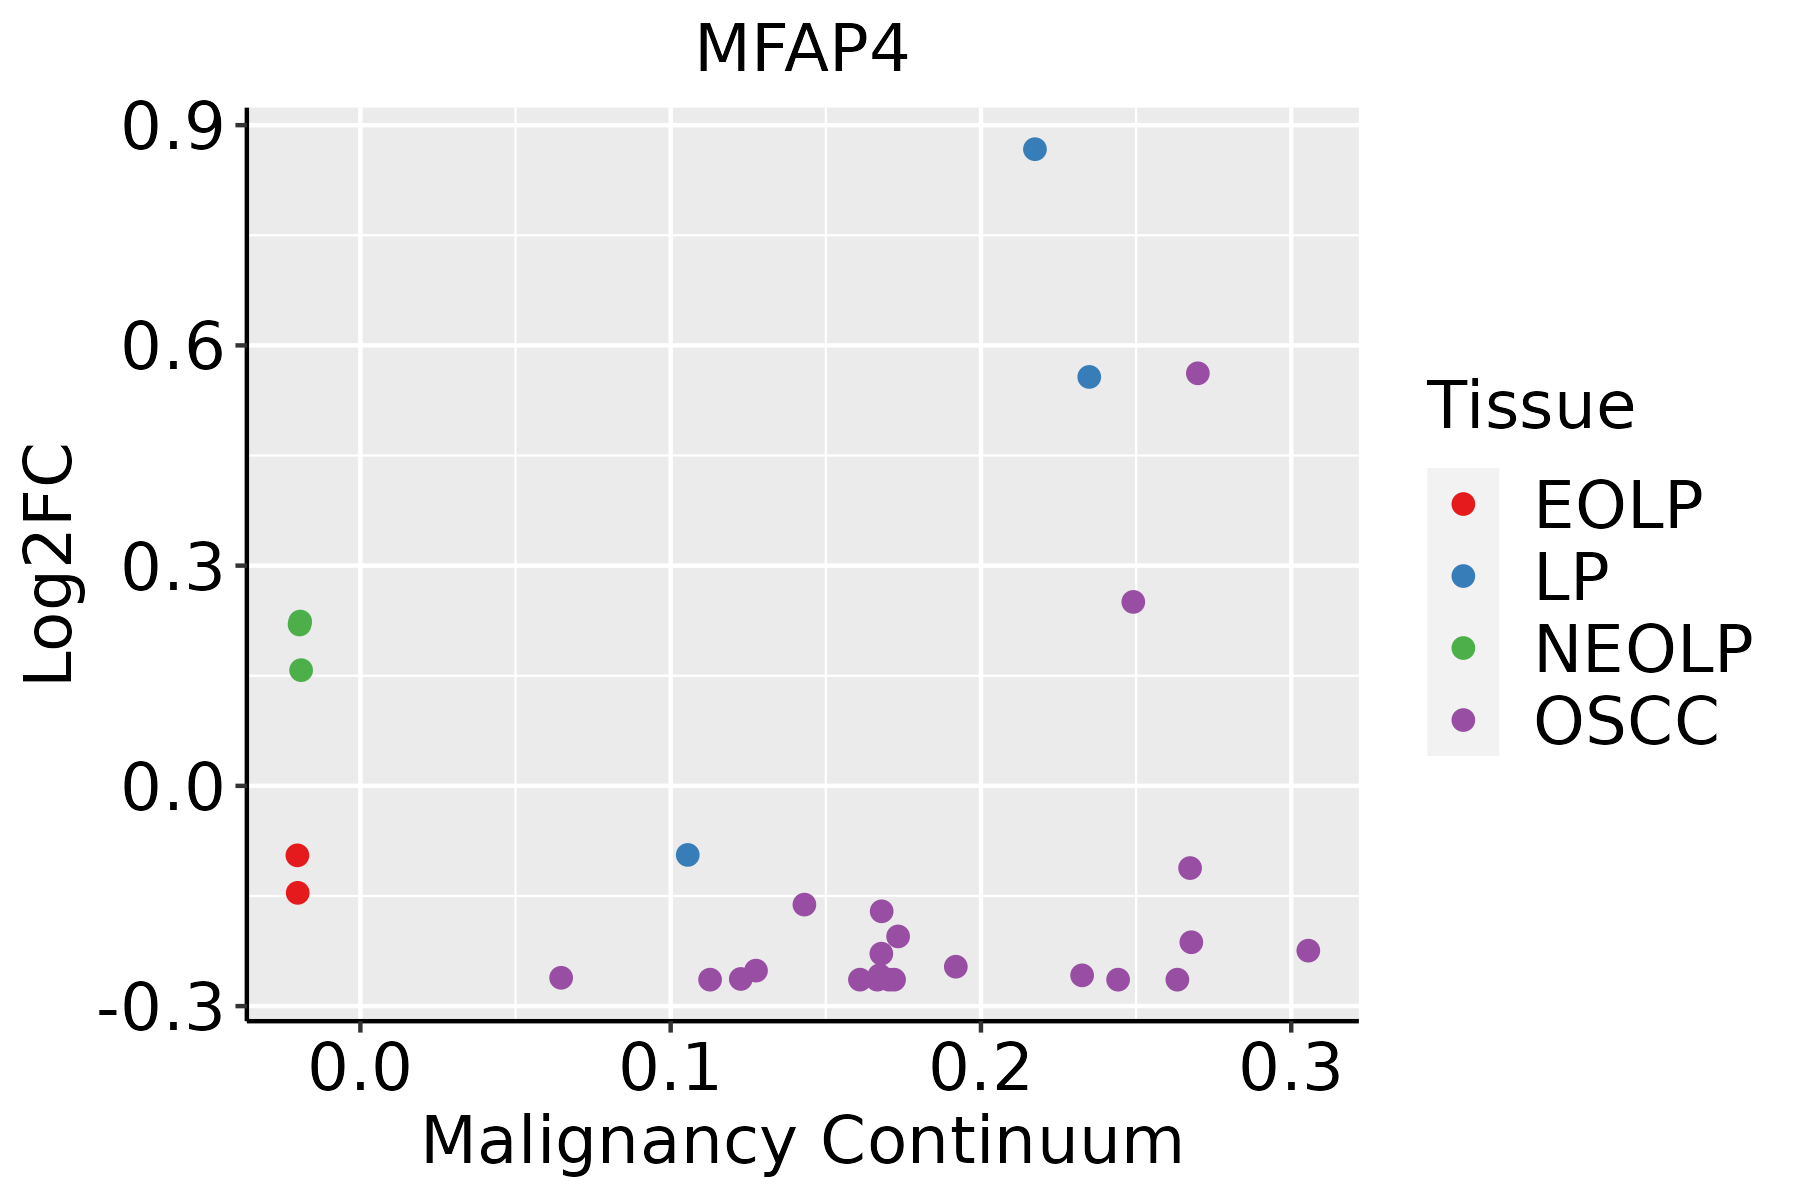 | EOLP: Erosive Oral lichen planus |
| LP: leukoplakia | ||
| NEOLP: Non-erosive oral lichen planus | ||
| OSCC: Oral squamous cell carcinoma | ||
| Skin | 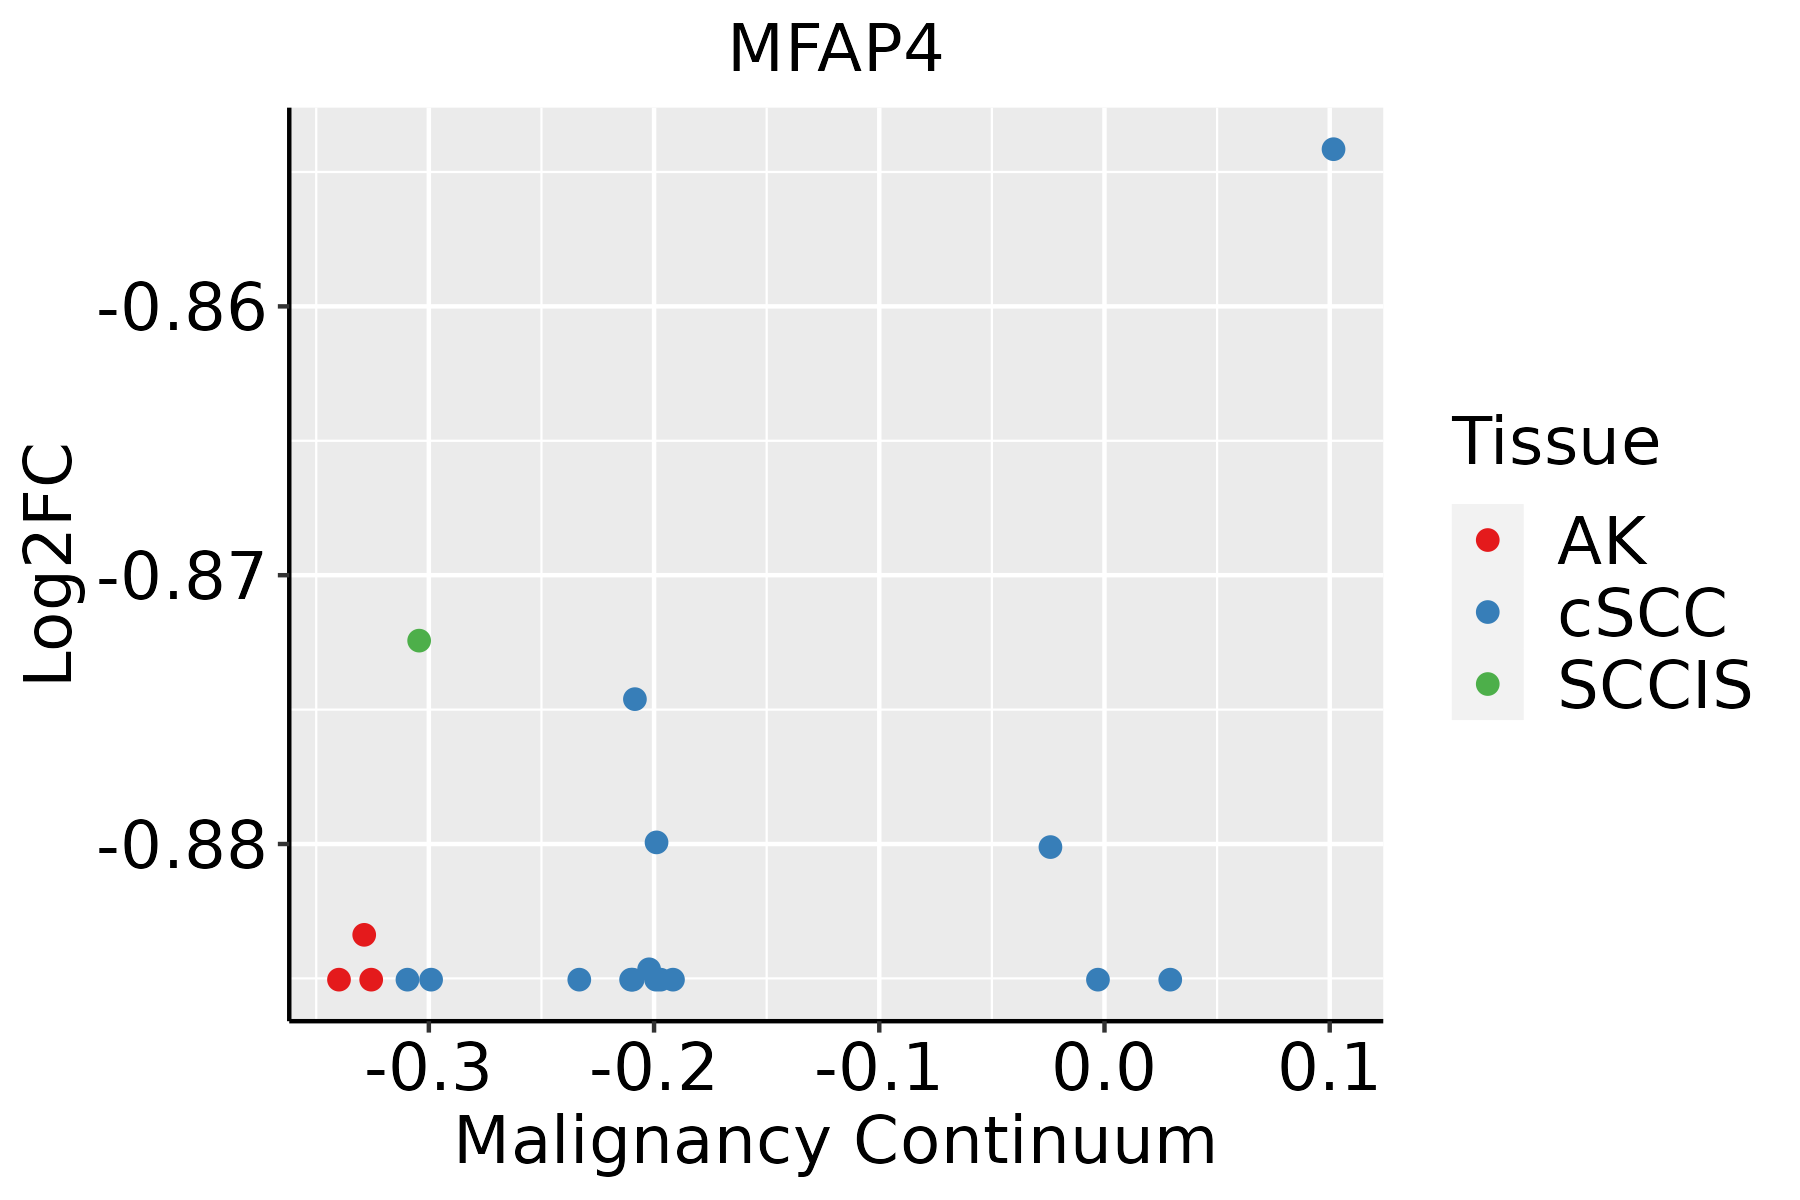 | AK: Actinic keratosis |
| cSCC: Cutaneous squamous cell carcinoma | ||
| SCCIS:squamous cell carcinoma in situ | ||
| Thyroid | 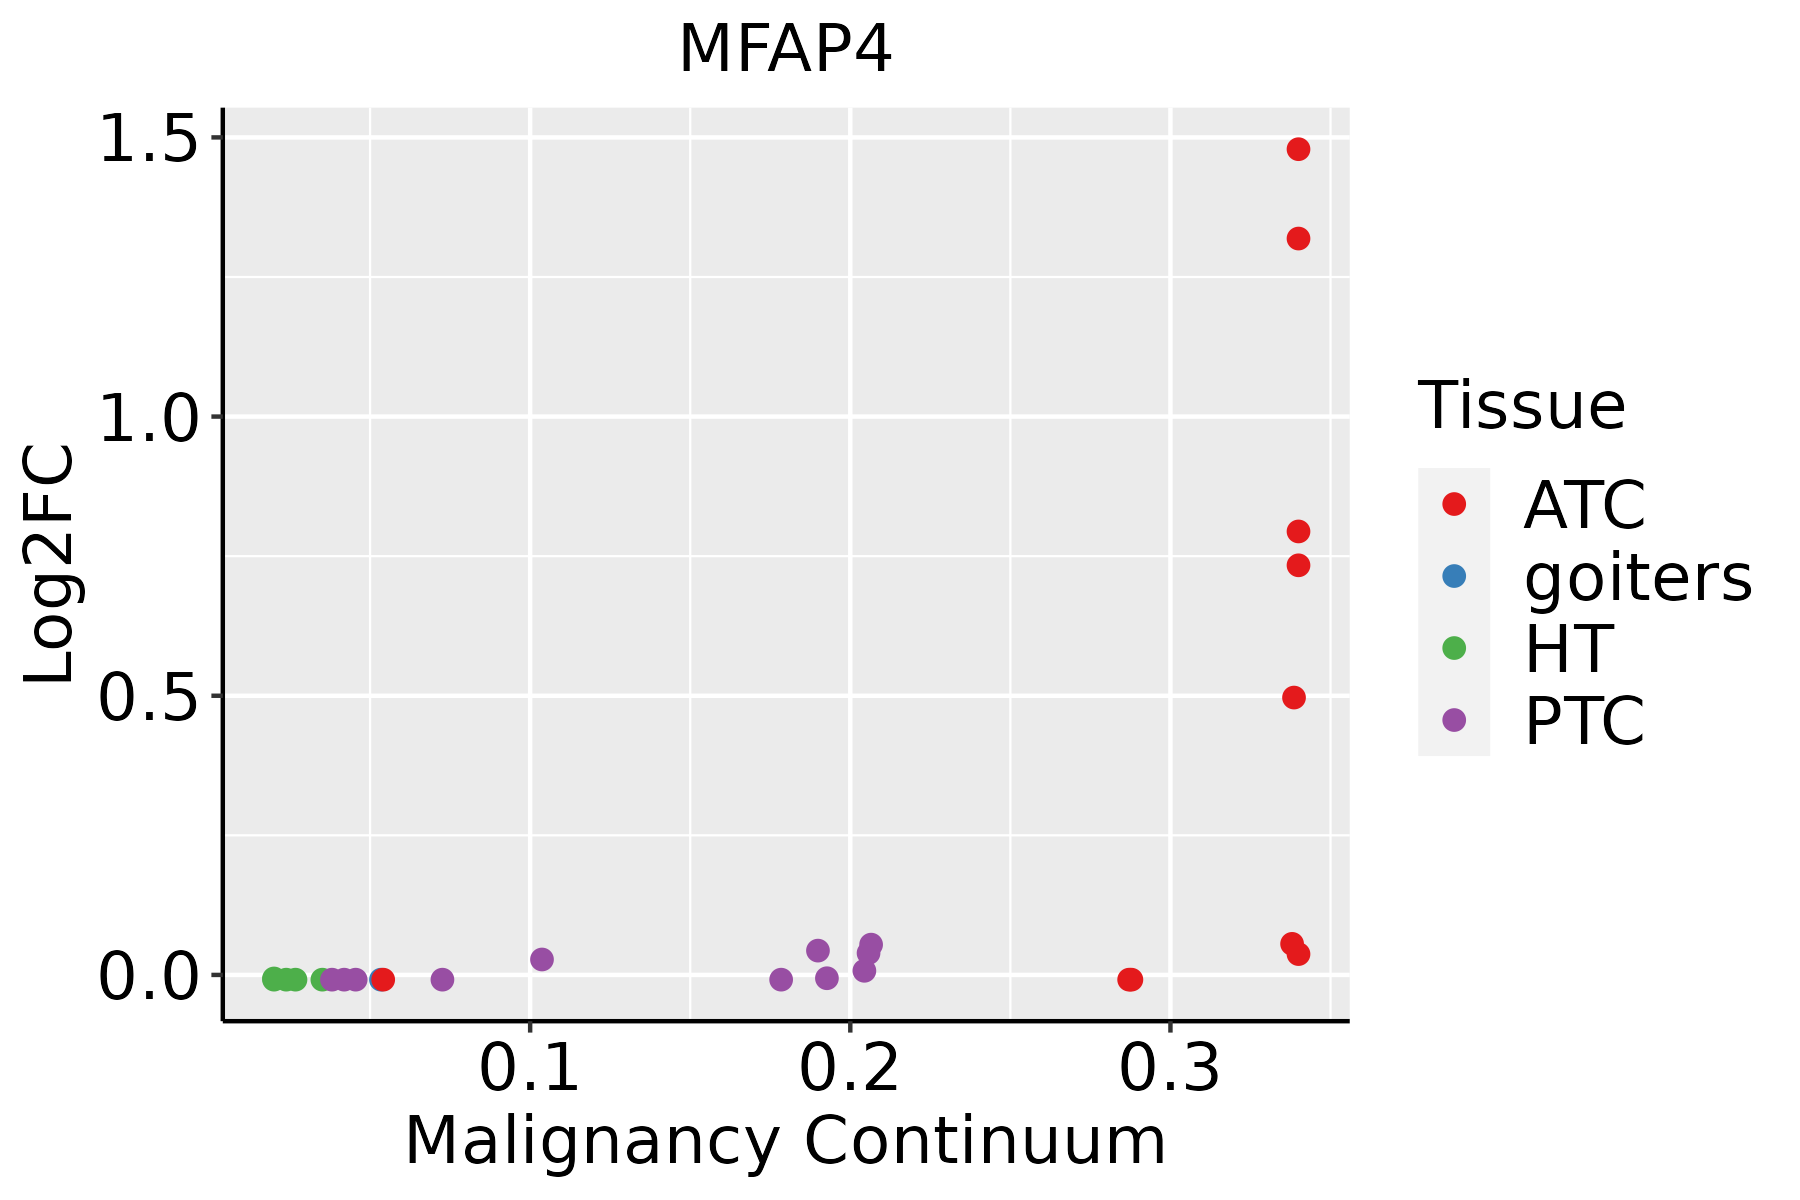 | ATC: Anaplastic thyroid cancer |
| HT: Hashimoto's thyroiditis | ||
| PTC: Papillary thyroid cancer |
| ∗log2FC in expression of this searched gene in stem-like cells from each diseased tissue sample relative to stem-like cells in normal samples in each tissue plotted against the malignancy continuum. Samples are colored based on if they are from different disease stage. |
Top |
Malignant transformation related pathway analysis |
| Find out the enriched GO biological processes and KEGG pathways involved in transition from healthy to precancer to cancer |
| Tissue | Disease Stage | Enriched GO biological Processes |
| Colorectum | AD |  |
| Colorectum | SER |  |
| Colorectum | MSS |  |
| Colorectum | MSI-H |  |
| Colorectum | FAP |  |
| ∗Top 15 enriched GO BP terms are showed in the bar plot of each disease state in each tissue. Each row represents a significant GO biological process which is colored according to the -log10(p.adjust). |
| Page: 1 2 3 4 5 6 7 8 9 |
| GO ID | Tissue | Disease Stage | Description | Gene Ratio | Bg Ratio | pvalue | p.adjust | Count |
| GO:000941113 | Esophagus | ESCC | response to UV | 115/8552 | 149/18723 | 3.29e-15 | 1.93e-13 | 115 |
| GO:000931419 | Esophagus | ESCC | response to radiation | 277/8552 | 456/18723 | 4.42e-11 | 1.43e-09 | 277 |
| GO:003464413 | Esophagus | ESCC | cellular response to UV | 70/8552 | 90/18723 | 4.59e-10 | 1.20e-08 | 70 |
| GO:007121419 | Esophagus | ESCC | cellular response to abiotic stimulus | 206/8552 | 331/18723 | 7.52e-10 | 1.88e-08 | 206 |
| GO:010400419 | Esophagus | ESCC | cellular response to environmental stimulus | 206/8552 | 331/18723 | 7.52e-10 | 1.88e-08 | 206 |
| GO:007147816 | Esophagus | ESCC | cellular response to radiation | 122/8552 | 186/18723 | 3.07e-08 | 5.73e-07 | 122 |
| GO:000941611 | Esophagus | ESCC | response to light stimulus | 183/8552 | 320/18723 | 2.03e-05 | 1.76e-04 | 183 |
| GO:00301984 | Esophagus | ESCC | extracellular matrix organization | 171/8552 | 301/18723 | 6.08e-05 | 4.67e-04 | 171 |
| GO:00430624 | Esophagus | ESCC | extracellular structure organization | 171/8552 | 302/18723 | 7.73e-05 | 5.76e-04 | 171 |
| GO:00452294 | Esophagus | ESCC | external encapsulating structure organization | 172/8552 | 304/18723 | 7.80e-05 | 5.80e-04 | 172 |
| GO:00714821 | Esophagus | ESCC | cellular response to light stimulus | 75/8552 | 123/18723 | 4.45e-04 | 2.50e-03 | 75 |
| GO:0009650 | Esophagus | ESCC | UV protection | 12/8552 | 13/18723 | 6.18e-04 | 3.32e-03 | 12 |
| GO:00329631 | Esophagus | ESCC | collagen metabolic process | 62/8552 | 104/18723 | 2.90e-03 | 1.22e-02 | 62 |
| GO:00850292 | Esophagus | ESCC | extracellular matrix assembly | 29/8552 | 45/18723 | 8.63e-03 | 3.04e-02 | 29 |
| GO:00094114 | Oral cavity | OSCC | response to UV | 99/7305 | 149/18723 | 1.01e-11 | 3.70e-10 | 99 |
| GO:007121416 | Oral cavity | OSCC | cellular response to abiotic stimulus | 186/7305 | 331/18723 | 1.38e-10 | 4.10e-09 | 186 |
| GO:010400416 | Oral cavity | OSCC | cellular response to environmental stimulus | 186/7305 | 331/18723 | 1.38e-10 | 4.10e-09 | 186 |
| GO:000931416 | Oral cavity | OSCC | response to radiation | 241/7305 | 456/18723 | 9.76e-10 | 2.40e-08 | 241 |
| GO:00346444 | Oral cavity | OSCC | cellular response to UV | 63/7305 | 90/18723 | 2.42e-09 | 5.60e-08 | 63 |
| GO:00714788 | Oral cavity | OSCC | cellular response to radiation | 109/7305 | 186/18723 | 4.54e-08 | 8.45e-07 | 109 |
| Page: 1 2 3 4 |
| Pathway ID | Tissue | Disease Stage | Description | Gene Ratio | Bg Ratio | pvalue | p.adjust | qvalue | Count |
| Page: 1 |
Top |
Cell-cell communication analysis |
| Identification of potential cell-cell interactions between two cell types and their ligand-receptor pairs for different disease states |
| Ligand | Receptor | LRpair | Pathway | Tissue | Disease Stage |
| Page: 1 |
Top |
Single-cell gene regulatory network inference analysis |
| Find out the significant the regulons (TFs) and the target genes of each regulon across cell types for different disease states |
| TF | Cell Type | Tissue | Disease Stage | Target Gene | RSS | Regulon Activity |
| ∗The dot plots of a searched regulon are shown for all cell subpopulations in each disease state of each tissue based on the regulon specific score inferred using pySCENIC and by calculating the average expression. |
| Page: 1 |
Top |
Somatic mutation of malignant transformation related genes |
| Annotation of somatic variants for genes involved in malignant transformation |
| Hugo Symbol | Variant Class | Variant Classification | dbSNP RS | HGVSc | HGVSp | HGVSp Short | SWISSPROT | BIOTYPE | SIFT | PolyPhen | Tumor Sample Barcode | Tissue | Histology | Sex | Age | Stage | Therapy Types | Drugs | Outcome |
| MFAP4 | SNV | Missense_Mutation | rs749288701 | c.229G>A | p.Gly77Ser | p.G77S | P55083 | protein_coding | deleterious(0) | probably_damaging(0.997) | TCGA-LL-A6FQ-01 | Breast | breast invasive carcinoma | Female | >=65 | III/IV | Unknown | Unknown | SD |
| MFAP4 | SNV | Missense_Mutation | rs755308604 | c.541G>A | p.Glu181Lys | p.E181K | P55083 | protein_coding | deleterious(0) | probably_damaging(1) | TCGA-C5-A1ML-01 | Cervix | cervical & endocervical cancer | Female | <65 | I/II | Unknown | Unknown | PD |
| MFAP4 | SNV | Missense_Mutation | c.251N>G | p.Ser84Trp | p.S84W | P55083 | protein_coding | tolerated(0.05) | probably_damaging(0.942) | TCGA-DR-A0ZM-01 | Cervix | cervical & endocervical cancer | Female | <65 | III/IV | Unspecific | Cisplatin | SD | |
| MFAP4 | SNV | Missense_Mutation | rs372745312 | c.149N>A | p.Arg50Gln | p.R50Q | P55083 | protein_coding | tolerated(0.19) | benign(0.257) | TCGA-IR-A3LA-01 | Cervix | cervical & endocervical cancer | Female | <65 | I/II | Chemotherapy | cisplatin | CR |
| MFAP4 | SNV | Missense_Mutation | c.143G>T | p.Gly48Val | p.G48V | P55083 | protein_coding | tolerated(0.1) | benign(0.053) | TCGA-LP-A4AV-01 | Cervix | cervical & endocervical cancer | Female | <65 | I/II | Unknown | Unknown | SD | |
| MFAP4 | SNV | Missense_Mutation | novel | c.352N>T | p.Arg118Cys | p.R118C | P55083 | protein_coding | deleterious(0) | probably_damaging(0.995) | TCGA-AA-3845-01 | Colorectum | colon adenocarcinoma | Female | >=65 | I/II | Unknown | Unknown | PD |
| MFAP4 | SNV | Missense_Mutation | rs749288701 | c.229G>A | p.Gly77Ser | p.G77S | P55083 | protein_coding | deleterious(0) | probably_damaging(0.997) | TCGA-CK-4951-01 | Colorectum | colon adenocarcinoma | Female | >=65 | I/II | Unknown | Unknown | PD |
| MFAP4 | SNV | Missense_Mutation | rs769104779 | c.812N>A | p.Arg271His | p.R271H | P55083 | protein_coding | tolerated(0.56) | benign(0.031) | TCGA-NH-A5IV-01 | Colorectum | colon adenocarcinoma | Female | >=65 | I/II | Unknown | Unknown | SD |
| MFAP4 | SNV | Missense_Mutation | novel | c.313N>A | p.Val105Ile | p.V105I | P55083 | protein_coding | deleterious(0.01) | probably_damaging(0.999) | TCGA-A5-A0G1-01 | Endometrium | uterine corpus endometrioid carcinoma | Female | >=65 | I/II | Unknown | Unknown | SD |
| MFAP4 | SNV | Missense_Mutation | novel | c.458N>A | p.Arg153Gln | p.R153Q | P55083 | protein_coding | deleterious(0.03) | probably_damaging(0.972) | TCGA-A5-A2K5-01 | Endometrium | uterine corpus endometrioid carcinoma | Female | >=65 | I/II | Unknown | Unknown | SD |
| Page: 1 2 3 |
Top |
Related drugs of malignant transformation related genes |
| Identification of chemicals and drugs interact with genes involved in malignant transfromation |
| (DGIdb 4.0) |
| Entrez ID | Symbol | Category | Interaction Types | Drug Claim Name | Drug Name | PMIDs |
| Page: 1 |

Copyright 2023-Present -The University of Texas Health Science Center at Houston |