Schematic overview of the cellular and molecular mechanisms involved in the cancer progression, including the proposed cellular and molecular mechanisms in cancer cells trajectory. AT1: alveolar type 1 cells; AT2: alveolar type 2 cells; AAH: atypical adenomatous hyperplasia; AIS: adenocarcinoma in situ; MIA: minimally invasive adenocarcinoma; IA: invasive adenocarcinoma; EMT: epithelial-mesenchymal transition

Home

Download

Statistics

Help

Contact

Center for Computational Systems Medicine
leaf

Gene summary

leaf

Malignant transformation analysis

leaf

Malignant transformation related pathway analysis

leaf

Cell-cell communication analysis

leaf

Single-cell gene regulatory network inference analysis

leaf

Somatic mutation of malignant transformation related genes

leaf

Related drugs of malignant transformation related genes

Gene: MFAP2

Gene summary for MFAP2

check button Gene summary.

Gene informationSpeciesHuman
Gene symbol

MFAP2

Gene ID

4237

Gene namemicrofibril associated protein 2
Gene AliasMAGP
Cytomap1p36.13
Gene Typeprotein-coding
GO ID

GO:0001654

UniProtAcc

P55001


Top

Malignant transformation analysis

check button Identification of the aberrant gene expression in precancerous and cancerous lesions by comparing the gene expression of stem-like cells in diseased tissues with normal stem cells
check button Malignant transformation involving gene list.
Entrez IDSymbolReplicatesSpeciesOrganTissueAdj P-valueLog2FCMalignancy
4237MFAP2GSM4909281HumanBreastIDC4.81e-396.09e-010.21
4237MFAP2GSM4909282HumanBreastIDC1.75e-062.20e-01-0.0288
4237MFAP2GSM4909285HumanBreastIDC1.17e-041.43e-010.21
4237MFAP2GSM4909286HumanBreastIDC5.01e-051.55e-010.1081
4237MFAP2GSM4909287HumanBreastIDC7.68e-153.91e-010.2057
4237MFAP2GSM4909293HumanBreastIDC4.78e-021.30e-010.1581
4237MFAP2GSM4909295HumanBreastIDC9.82e-165.37e-010.0898
4237MFAP2LZE4THumanEsophagusESCC1.07e-218.21e-010.0811
4237MFAP2LZE5THumanEsophagusESCC1.23e-065.76e-010.0514
4237MFAP2LZE7THumanEsophagusESCC3.72e-107.65e-010.0667
4237MFAP2LZE8THumanEsophagusESCC2.46e-124.53e-010.067
4237MFAP2LZE20THumanEsophagusESCC6.47e-083.52e-010.0662
4237MFAP2LZE22THumanEsophagusESCC8.43e-111.68e+000.068
4237MFAP2LZE24THumanEsophagusESCC4.55e-421.31e+000.0596
4237MFAP2LZE21THumanEsophagusESCC2.16e-055.00e-010.0655
4237MFAP2LZE6THumanEsophagusESCC1.13e-104.95e-010.0845
4237MFAP2P1T-EHumanEsophagusESCC1.21e-109.35e-010.0875
4237MFAP2P2T-EHumanEsophagusESCC2.49e-911.86e+000.1177
4237MFAP2P4T-EHumanEsophagusESCC2.05e-801.88e+000.1323
4237MFAP2P5T-EHumanEsophagusESCC6.50e-209.00e-010.1327
Page: 1 2 3 4 5 6 

check button Transcriptomic changes along malignancy continuum.
TissueExpression DynamicsAbbreviation
BreastThe image shows the transcriptomic changes along malignancy continuum.log2FC in expression of this searched gene in stem-like cells from each diseased tissue sample relative to stem-like cells in normal samples in each tissue plotted against the malignancy continuum. Samples are colored based on if they are from different disease stage.
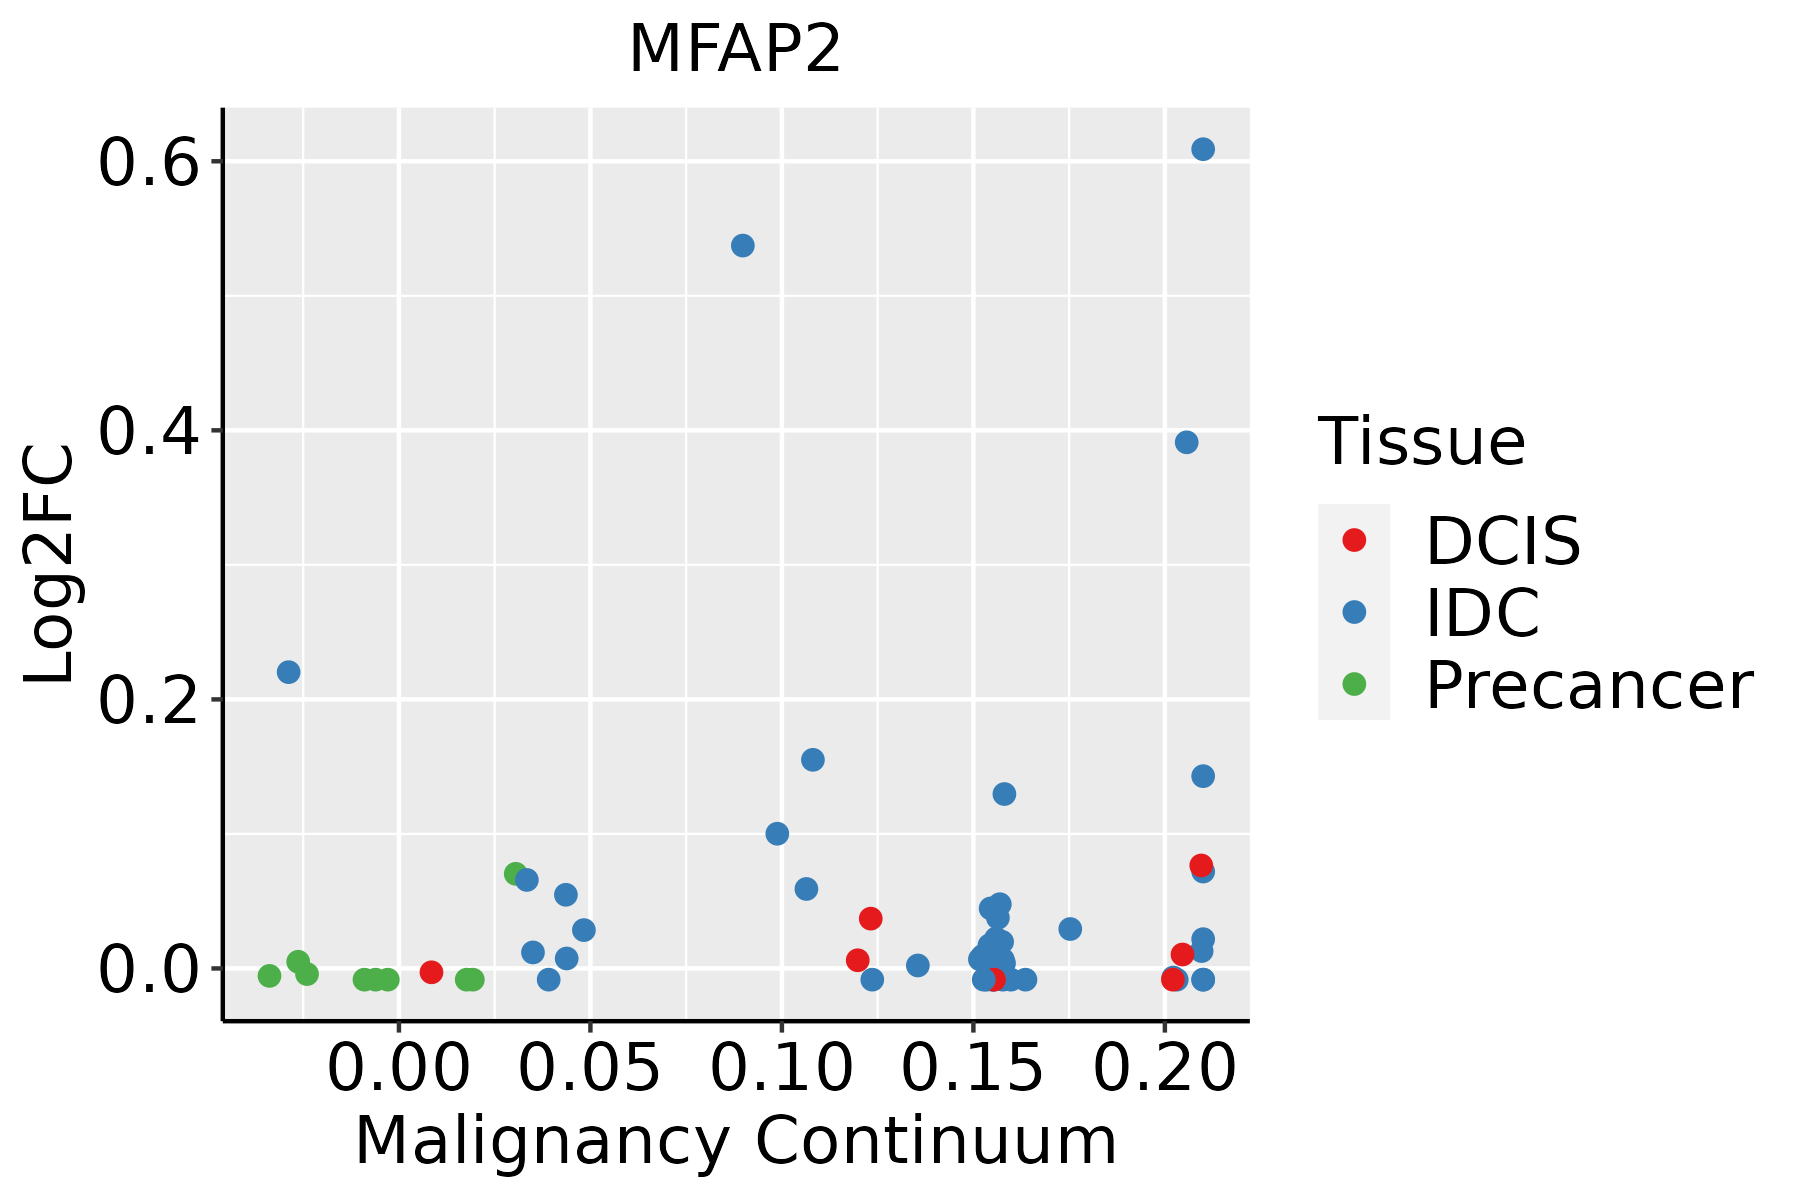
IDC: Invasive ductal carcinoma
DCIS: Ductal carcinoma in situ
Precancer(BRCA1-mut): Precancerous lesion from BRCA1 mutation carriers
EsophagusThe image shows the transcriptomic changes along malignancy continuum.log2FC in expression of this searched gene in stem-like cells from each diseased tissue sample relative to stem-like cells in normal samples in each tissue plotted against the malignancy continuum. Samples are colored based on if they are from different disease stage.ESCC: Esophageal squamous cell carcinoma
HGIN: High-grade intraepithelial neoplasias
LGIN: Low-grade intraepithelial neoplasias
LiverThe image shows the transcriptomic changes along malignancy continuum.log2FC in expression of this searched gene in stem-like cells from each diseased tissue sample relative to stem-like cells in normal samples in each tissue plotted against the malignancy continuum. Samples are colored based on if they are from different disease stage.HCC: Hepatocellular carcinoma
NAFLD: Non-alcoholic fatty liver disease
Oral CavityThe image shows the transcriptomic changes along malignancy continuum.log2FC in expression of this searched gene in stem-like cells from each diseased tissue sample relative to stem-like cells in normal samples in each tissue plotted against the malignancy continuum. Samples are colored based on if they are from different disease stage.EOLP: Erosive Oral lichen planus
LP: leukoplakia
NEOLP: Non-erosive oral lichen planus
OSCC: Oral squamous cell carcinoma
SkinThe image shows the transcriptomic changes along malignancy continuum.log2FC in expression of this searched gene in stem-like cells from each diseased tissue sample relative to stem-like cells in normal samples in each tissue plotted against the malignancy continuum. Samples are colored based on if they are from different disease stage.
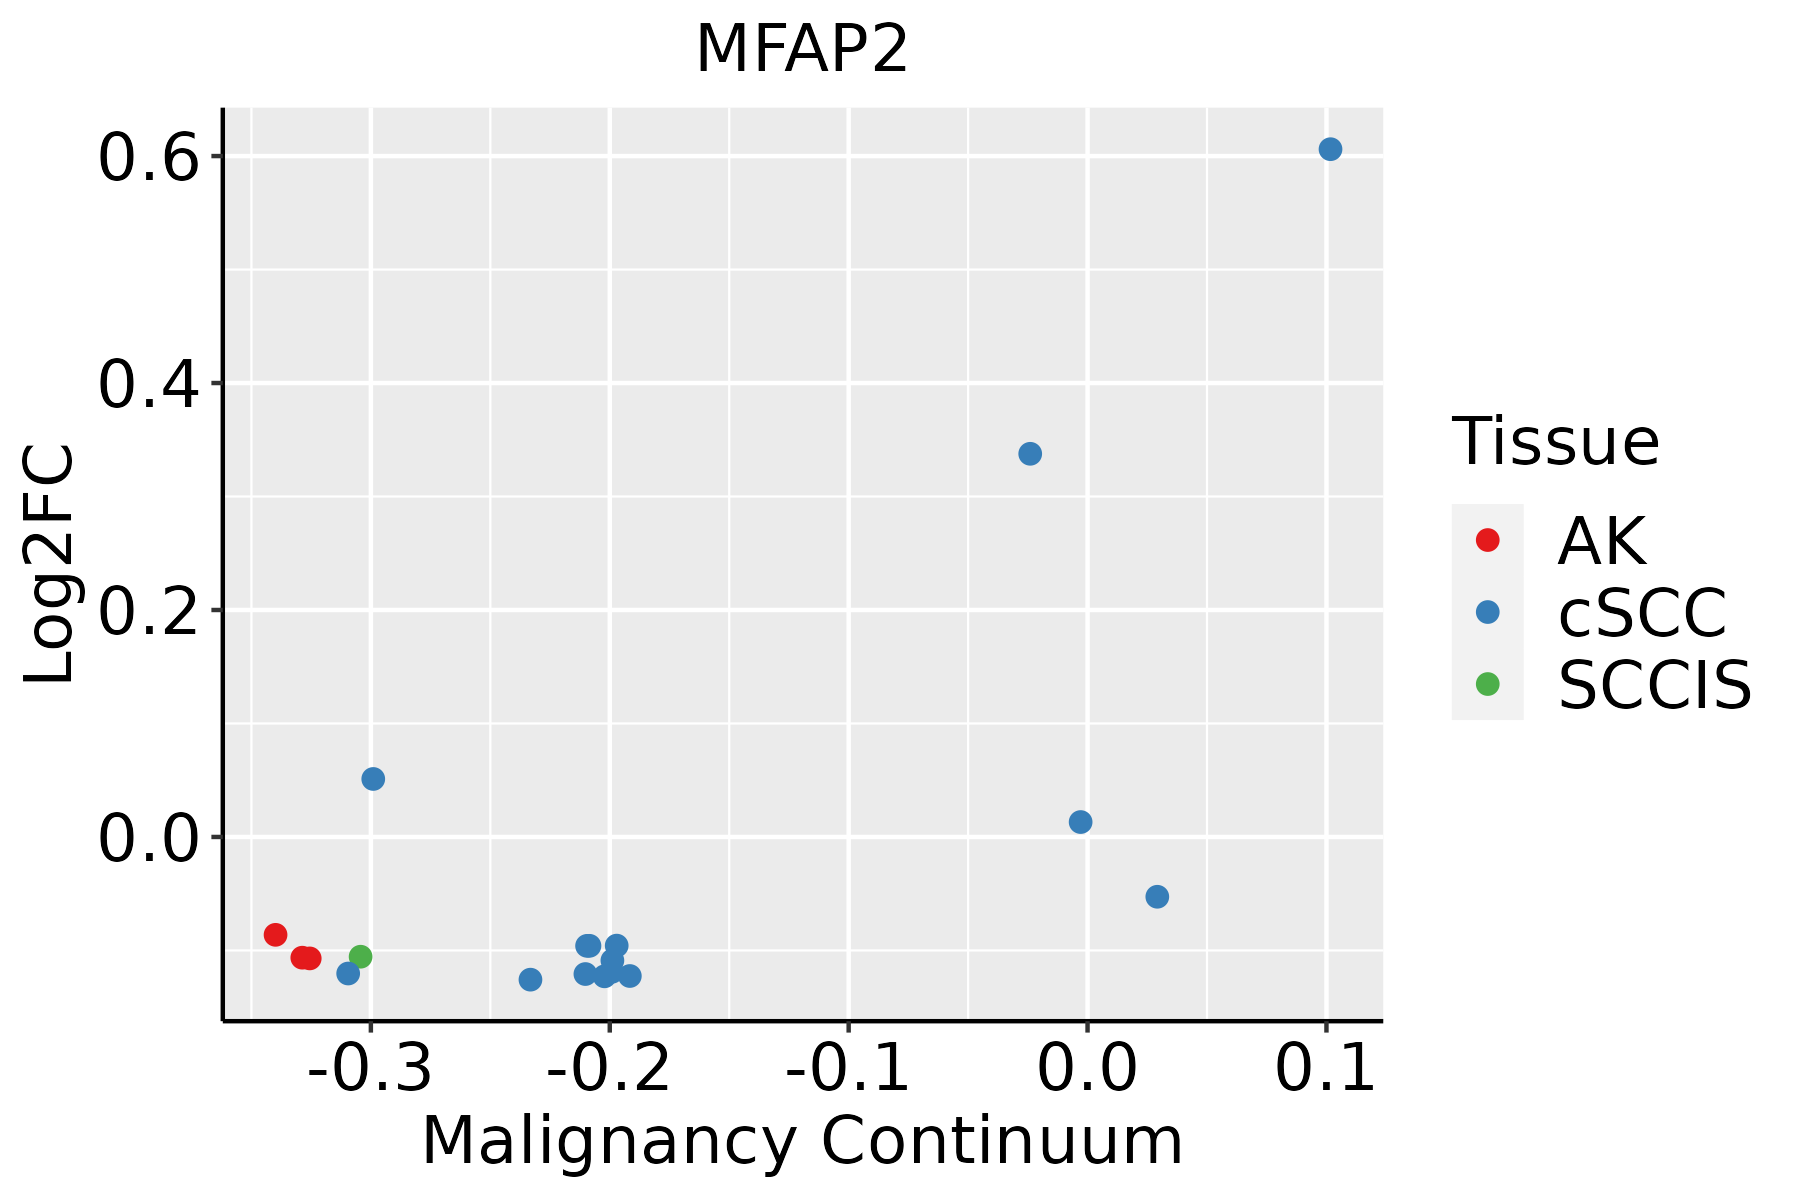
AK: Actinic keratosis
cSCC: Cutaneous squamous cell carcinoma
SCCIS:squamous cell carcinoma in situ
ThyroidThe image shows the transcriptomic changes along malignancy continuum.log2FC in expression of this searched gene in stem-like cells from each diseased tissue sample relative to stem-like cells in normal samples in each tissue plotted against the malignancy continuum. Samples are colored based on if they are from different disease stage.ATC: Anaplastic thyroid cancer
HT: Hashimoto's thyroiditis
PTC: Papillary thyroid cancer
∗log2FC in expression of this searched gene in stem-like cells from each diseased tissue sample relative to stem-like cells in normal samples in each tissue plotted against the malignancy continuum. Samples are colored based on if they are from different disease stage.

Top

Malignant transformation related pathway analysis

check buttonFind out the enriched GO biological processes and KEGG pathways involved in transition from healthy to precancer to cancer
check button Figure of enriched GO biological processes.
TissueDisease StageEnriched GO biological Processes
ColorectumADGO analysis - Figure of enriched GO biological processes: Top 15 enriched GO BP terms are showed in the bar plot of each disease state in each tissue. Each row represents a significant GO biological process which is colored according to the -log10(p.adjust).
ColorectumSERGO analysis - Figure of enriched GO biological processes: Top 15 enriched GO BP terms are showed in the bar plot of each disease state in each tissue. Each row represents a significant GO biological process which is colored according to the -log10(p.adjust).
ColorectumMSSGO analysis - Figure of enriched GO biological processes: Top 15 enriched GO BP terms are showed in the bar plot of each disease state in each tissue. Each row represents a significant GO biological process which is colored according to the -log10(p.adjust).
ColorectumMSI-HGO analysis - Figure of enriched GO biological processes: Top 15 enriched GO BP terms are showed in the bar plot of each disease state in each tissue. Each row represents a significant GO biological process which is colored according to the -log10(p.adjust).
ColorectumFAPGO analysis - Figure of enriched GO biological processes: Top 15 enriched GO BP terms are showed in the bar plot of each disease state in each tissue. Each row represents a significant GO biological process which is colored according to the -log10(p.adjust).
∗Top 15 enriched GO BP terms are showed in the bar plot of each disease state in each tissue. Each row represents a significant GO biological process which is colored according to the -log10(p.adjust).
Page: 1 2 3 4 5 6 7 8 9 

check button Enriched GO biological processes.
GO IDTissueDisease StageDescriptionGene RatioBg Ratiopvaluep.adjustCount
GO:00097919EsophagusESCCpost-embryonic development56/855280/187239.08e-068.71e-0556
GO:00485687EsophagusESCCembryonic organ development228/8552427/187237.28e-043.79e-03228
GO:01201624EsophagusESCCpositive regulation of cold-induced thermogenesis57/855297/187236.43e-032.35e-0257
GO:00485694EsophagusESCCpost-embryonic animal organ development12/855215/187237.31e-032.63e-0212
GO:01061066EsophagusESCCcold-induced thermogenesis80/8552144/187231.07e-023.65e-0280
GO:01201616EsophagusESCCregulation of cold-induced thermogenesis80/8552144/187231.07e-023.65e-0280
GO:010610611LiverHCCcold-induced thermogenesis76/7958144/187238.07e-033.18e-0276
GO:012016111LiverHCCregulation of cold-induced thermogenesis76/7958144/187238.07e-033.18e-0276
GO:199084511LiverHCCadaptive thermogenesis81/7958157/187231.32e-024.72e-0281
GO:00097918Oral cavityOSCCpost-embryonic development51/730580/187236.43e-067.13e-0551
GO:00485693Oral cavityOSCCpost-embryonic animal organ development13/730515/187232.07e-041.36e-0313
GO:01061065Oral cavityOSCCcold-induced thermogenesis71/7305144/187237.51e-032.75e-0271
GO:01201615Oral cavityOSCCregulation of cold-induced thermogenesis71/7305144/187237.51e-032.75e-0271
GO:00016594Oral cavityOSCCtemperature homeostasis84/7305174/187237.84e-032.87e-0284
GO:19908454Oral cavityOSCCadaptive thermogenesis76/7305157/187231.02e-023.52e-0276
GO:000979112Oral cavityLPpost-embryonic development31/462380/187233.69e-032.44e-0231
GO:004856911Oral cavityLPpost-embryonic animal organ development9/462315/187233.82e-032.48e-029
GO:004856912SkincSCCpost-embryonic animal organ development10/486415/187231.10e-037.24e-0310
GO:000979122SkincSCCpost-embryonic development32/486480/187234.18e-032.21e-0232
GO:000979114ThyroidPTCpost-embryonic development48/596880/187231.99e-073.56e-0648
Page: 1 2 

check button Enriched KEGG pathways.
Pathway IDTissueDisease StageDescriptionGene RatioBg Ratiopvaluep.adjustqvalueCount
Page: 1 

Top

Cell-cell communication analysis

check buttonIdentification of potential cell-cell interactions between two cell types and their ligand-receptor pairs for different disease states
LigandReceptorLRpairPathwayTissueDisease Stage
Page: 1 

Top

Single-cell gene regulatory network inference analysis

check buttonFind out the significant the regulons (TFs) and the target genes of each regulon across cell types for different disease states
TFCell TypeTissueDisease StageTarget GeneRSSRegulon Activity
∗The dot plots of a searched regulon are shown for all cell subpopulations in each disease state of each tissue based on the regulon specific score inferred using pySCENIC and by calculating the average expression.
Page: 1 

Top

Somatic mutation of malignant transformation related genes

check buttonAnnotation of somatic variants for genes involved in malignant transformation
Hugo SymbolVariant ClassVariant ClassificationdbSNP RSHGVScHGVSpHGVSp ShortSWISSPROTBIOTYPESIFTPolyPhenTumor Sample BarcodeTissueHistologySexAgeStageTherapy TypesDrugsOutcome
MFAP2SNVMissense_Mutationnovelc.409T>Gp.Cys137Glyp.C137GP55001protein_codingdeleterious(0)probably_damaging(0.998)TCGA-2W-A8YY-01Cervixcervical & endocervical cancerFemale<65I/IIChemotherapycisplatinCR
MFAP2SNVMissense_Mutationrs767651569c.118G>Ap.Asp40Asnp.D40NP55001protein_codingdeleterious_low_confidence(0.01)benign(0.001)TCGA-AZ-4315-01Colorectumcolon adenocarcinomaMale<65I/IIUnknownUnknownSD
MFAP2SNVMissense_Mutationc.169N>Tp.Pro57Serp.P57SP55001protein_codingtolerated_low_confidence(0.15)benign(0)TCGA-G4-6302-01Colorectumcolon adenocarcinomaFemale>=65I/IIUnknownUnknownSD
MFAP2SNVMissense_Mutationrs759929375c.305N>Cp.Tyr102Serp.Y102SP55001protein_codingdeleterious(0)possibly_damaging(0.784)TCGA-NH-A8F8-01Colorectumcolon adenocarcinomaMale>=65III/IVChemotherapyfluorouracilPD
MFAP2SNVMissense_Mutationnovelc.76N>Ap.Leu26Metp.L26MP55001protein_codingtolerated_low_confidence(0.16)possibly_damaging(0.825)TCGA-A5-A0G2-01Endometriumuterine corpus endometrioid carcinomaFemale<65III/IVUnknownUnknownSD
MFAP2SNVMissense_Mutationc.427G>Ap.Ala143Thrp.A143TP55001protein_codingdeleterious(0.01)probably_damaging(0.975)TCGA-AP-A051-01Endometriumuterine corpus endometrioid carcinomaFemale>=65I/IIUnknownUnknownSD
MFAP2SNVMissense_Mutationrs373562256c.383G>Ap.Arg128Hisp.R128HP55001protein_codingdeleterious(0.02)probably_damaging(0.999)TCGA-AP-A056-01Endometriumuterine corpus endometrioid carcinomaFemale<65I/IIUnknownUnknownSD
MFAP2SNVMissense_Mutationc.308N>Ap.Pro103Glnp.P103QP55001protein_codingdeleterious(0)probably_damaging(0.91)TCGA-AP-A1DK-01Endometriumuterine corpus endometrioid carcinomaFemale<65I/IIUnknownUnknownSD
MFAP2SNVMissense_Mutationnovelc.209N>Cp.Val70Alap.V70AP55001protein_codingtolerated(0.21)benign(0.026)TCGA-B5-A3FA-01Endometriumuterine corpus endometrioid carcinomaFemale>=65I/IIUnknownUnknownSD
MFAP2SNVMissense_Mutationnovelc.471N>Ap.Phe157Leup.F157LP55001protein_codingdeleterious_low_confidence(0.04)benign(0.306)TCGA-BS-A0UF-01Endometriumuterine corpus endometrioid carcinomaFemale>=65I/IIUnknownUnknownSD
Page: 1 2 

Top

Related drugs of malignant transformation related genes

check buttonIdentification of chemicals and drugs interact with genes involved in malignant transfromation
(DGIdb 4.0)
Entrez IDSymbolCategoryInteraction TypesDrug Claim NameDrug NamePMIDs
Page: 1