
|
|||||
|
 | |
| |
| |
| |
| |
| |
|
Gene: MEX3A |
Gene summary for MEX3A |
| Gene information | Species | Human | Gene symbol | MEX3A | Gene ID | 92312 |
| Gene name | mex-3 RNA binding family member A | |
| Gene Alias | MEX-3A | |
| Cytomap | 1q22 | |
| Gene Type | protein-coding | GO ID | GO:0000932 | UniProtAcc | A1L020 |
Top |
Malignant transformation analysis |
| Identification of the aberrant gene expression in precancerous and cancerous lesions by comparing the gene expression of stem-like cells in diseased tissues with normal stem cells |
| Entrez ID | Symbol | Replicates | Species | Organ | Tissue | Adj P-value | Log2FC | Malignancy |
| 92312 | MEX3A | LZE7T | Human | Esophagus | ESCC | 1.20e-03 | 3.75e-01 | 0.0667 |
| 92312 | MEX3A | P2T-E | Human | Esophagus | ESCC | 6.55e-31 | 5.37e-01 | 0.1177 |
| 92312 | MEX3A | P4T-E | Human | Esophagus | ESCC | 3.64e-05 | 2.11e-01 | 0.1323 |
| 92312 | MEX3A | P10T-E | Human | Esophagus | ESCC | 2.05e-30 | 6.28e-01 | 0.116 |
| 92312 | MEX3A | P12T-E | Human | Esophagus | ESCC | 2.33e-11 | 1.69e-01 | 0.1122 |
| 92312 | MEX3A | P16T-E | Human | Esophagus | ESCC | 1.60e-24 | 4.70e-01 | 0.1153 |
| 92312 | MEX3A | P21T-E | Human | Esophagus | ESCC | 4.66e-07 | 4.73e-02 | 0.1617 |
| 92312 | MEX3A | P22T-E | Human | Esophagus | ESCC | 1.71e-03 | 7.01e-03 | 0.1236 |
| 92312 | MEX3A | P24T-E | Human | Esophagus | ESCC | 2.67e-05 | 1.98e-01 | 0.1287 |
| 92312 | MEX3A | P26T-E | Human | Esophagus | ESCC | 1.24e-10 | 9.17e-02 | 0.1276 |
| 92312 | MEX3A | P27T-E | Human | Esophagus | ESCC | 3.25e-10 | 1.31e-01 | 0.1055 |
| 92312 | MEX3A | P28T-E | Human | Esophagus | ESCC | 1.03e-08 | 3.59e-02 | 0.1149 |
| 92312 | MEX3A | P31T-E | Human | Esophagus | ESCC | 1.73e-12 | 1.70e-01 | 0.1251 |
| 92312 | MEX3A | P32T-E | Human | Esophagus | ESCC | 6.32e-06 | 1.02e-01 | 0.1666 |
| 92312 | MEX3A | P39T-E | Human | Esophagus | ESCC | 7.92e-08 | 1.34e-02 | 0.0894 |
| 92312 | MEX3A | P42T-E | Human | Esophagus | ESCC | 3.59e-03 | 8.74e-02 | 0.1175 |
| 92312 | MEX3A | P47T-E | Human | Esophagus | ESCC | 1.73e-03 | -1.21e-02 | 0.1067 |
| 92312 | MEX3A | P48T-E | Human | Esophagus | ESCC | 3.39e-09 | 6.51e-02 | 0.0959 |
| 92312 | MEX3A | P49T-E | Human | Esophagus | ESCC | 2.51e-02 | 1.94e-01 | 0.1768 |
| 92312 | MEX3A | P56T-E | Human | Esophagus | ESCC | 8.86e-09 | 1.12e+00 | 0.1613 |
| Page: 1 2 |
| Tissue | Expression Dynamics | Abbreviation |
| Esophagus | 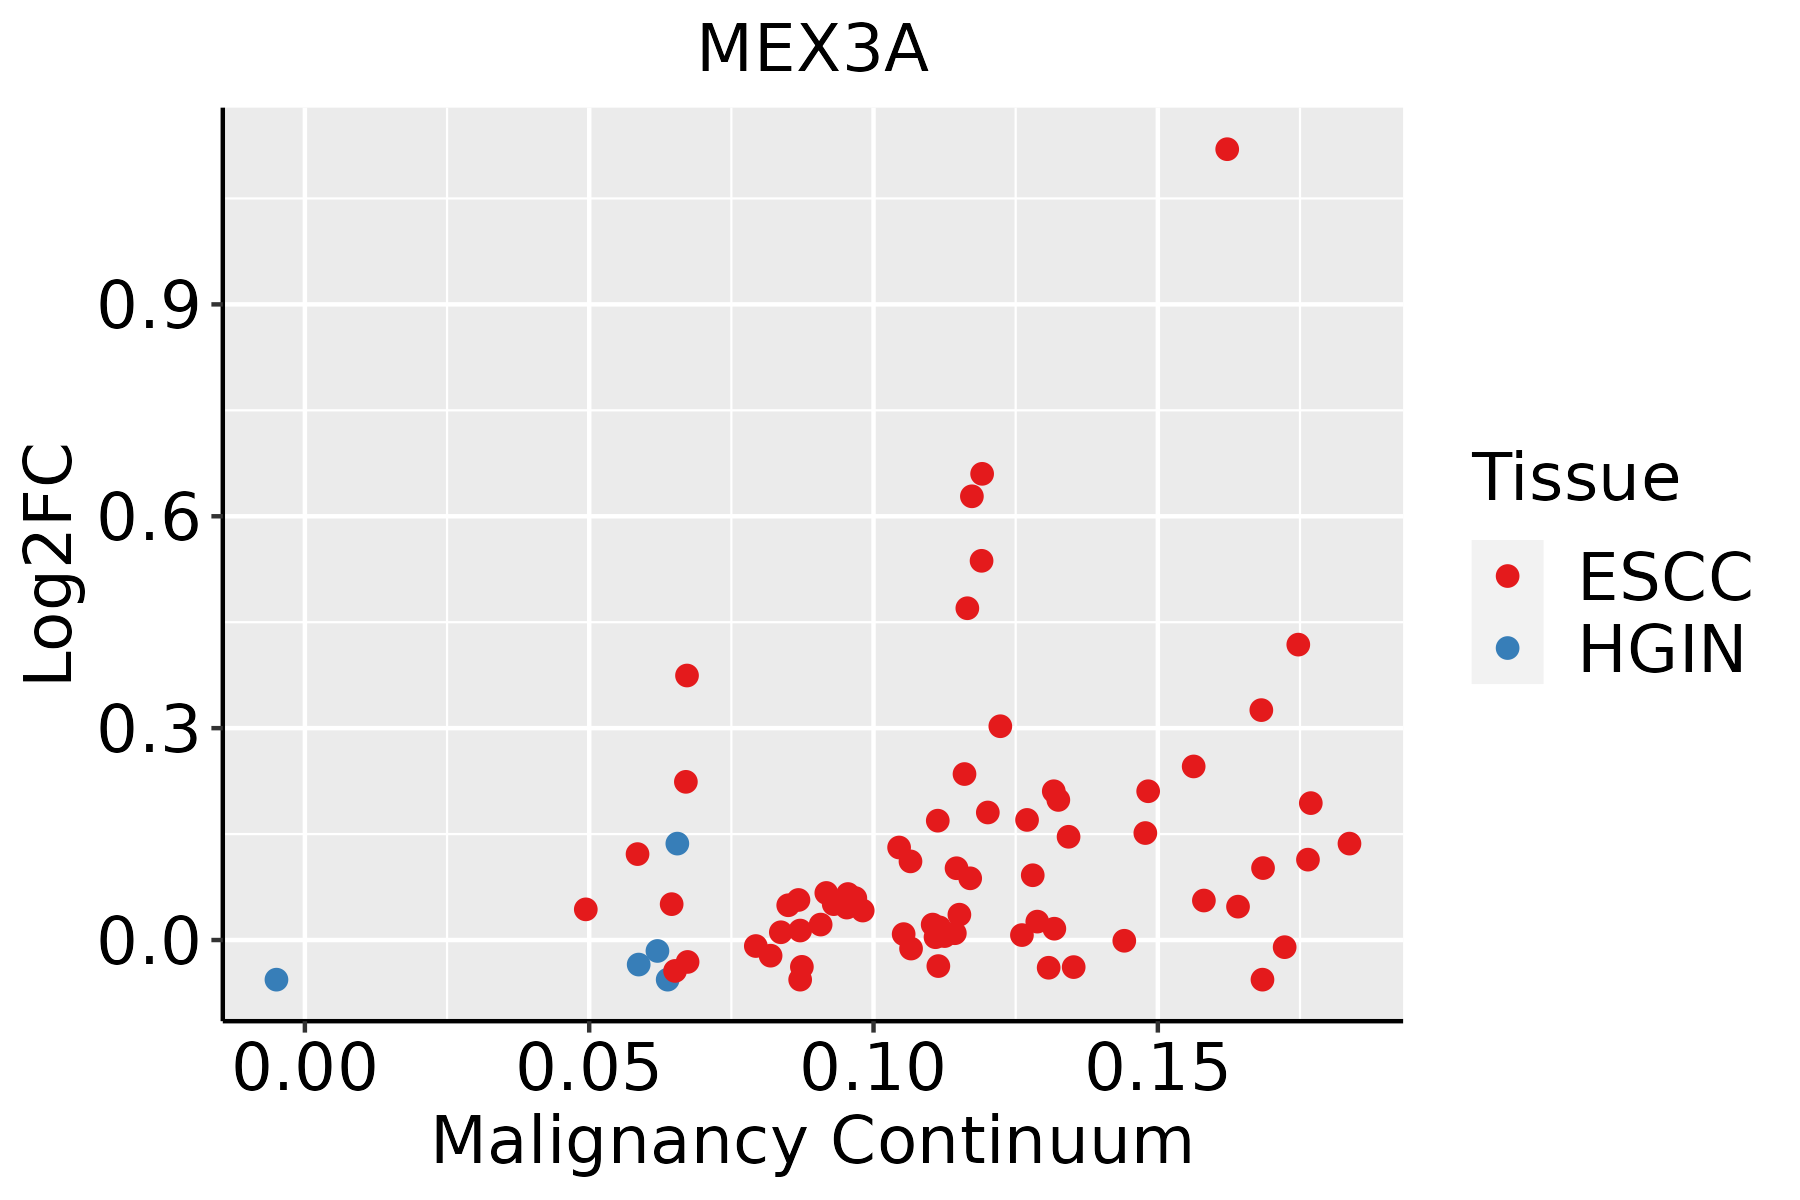 | ESCC: Esophageal squamous cell carcinoma |
| HGIN: High-grade intraepithelial neoplasias | ||
| LGIN: Low-grade intraepithelial neoplasias | ||
| Thyroid |  | ATC: Anaplastic thyroid cancer |
| HT: Hashimoto's thyroiditis | ||
| PTC: Papillary thyroid cancer |
| ∗log2FC in expression of this searched gene in stem-like cells from each diseased tissue sample relative to stem-like cells in normal samples in each tissue plotted against the malignancy continuum. Samples are colored based on if they are from different disease stage. |
Top |
Malignant transformation related pathway analysis |
| Find out the enriched GO biological processes and KEGG pathways involved in transition from healthy to precancer to cancer |
| Tissue | Disease Stage | Enriched GO biological Processes |
| Colorectum | AD |  |
| Colorectum | SER |  |
| Colorectum | MSS |  |
| Colorectum | MSI-H |  |
| Colorectum | FAP |  |
| ∗Top 15 enriched GO BP terms are showed in the bar plot of each disease state in each tissue. Each row represents a significant GO biological process which is colored according to the -log10(p.adjust). |
| Page: 1 2 3 4 5 6 7 8 9 |
| GO ID | Tissue | Disease Stage | Description | Gene Ratio | Bg Ratio | pvalue | p.adjust | Count |
| Page: 1 |
| Pathway ID | Tissue | Disease Stage | Description | Gene Ratio | Bg Ratio | pvalue | p.adjust | qvalue | Count |
| Page: 1 |
Top |
Cell-cell communication analysis |
| Identification of potential cell-cell interactions between two cell types and their ligand-receptor pairs for different disease states |
| Ligand | Receptor | LRpair | Pathway | Tissue | Disease Stage |
| Page: 1 |
Top |
Single-cell gene regulatory network inference analysis |
| Find out the significant the regulons (TFs) and the target genes of each regulon across cell types for different disease states |
| TF | Cell Type | Tissue | Disease Stage | Target Gene | RSS | Regulon Activity |
| ∗The dot plots of a searched regulon are shown for all cell subpopulations in each disease state of each tissue based on the regulon specific score inferred using pySCENIC and by calculating the average expression. |
| Page: 1 |
Top |
Somatic mutation of malignant transformation related genes |
| Annotation of somatic variants for genes involved in malignant transformation |
| Hugo Symbol | Variant Class | Variant Classification | dbSNP RS | HGVSc | HGVSp | HGVSp Short | SWISSPROT | BIOTYPE | SIFT | PolyPhen | Tumor Sample Barcode | Tissue | Histology | Sex | Age | Stage | Therapy Types | Drugs | Outcome |
| MEX3A | SNV | Missense_Mutation | c.1441N>T | p.Leu481Phe | p.L481F | A1L020 | protein_coding | deleterious(0) | probably_damaging(0.999) | TCGA-BH-A0DZ-01 | Breast | breast invasive carcinoma | Female | <65 | I/II | Chemotherapy | docetaxel | SD | |
| MEX3A | SNV | Missense_Mutation | c.82N>A | p.Asp28Asn | p.D28N | A1L020 | protein_coding | tolerated_low_confidence(0.17) | benign(0.234) | TCGA-EK-A2PM-01 | Cervix | cervical & endocervical cancer | Female | >=65 | I/II | Unknown | Unknown | SD | |
| MEX3A | SNV | Missense_Mutation | rs143845685 | c.1192N>A | p.Ala398Thr | p.A398T | A1L020 | protein_coding | tolerated(0.89) | benign(0.015) | TCGA-AA-3492-01 | Colorectum | colon adenocarcinoma | Female | >=65 | I/II | Unknown | Unknown | SD |
| MEX3A | SNV | Missense_Mutation | novel | c.680G>A | p.Arg227His | p.R227H | A1L020 | protein_coding | deleterious(0.02) | probably_damaging(0.919) | TCGA-AA-A02R-01 | Colorectum | colon adenocarcinoma | Female | >=65 | I/II | Unknown | Unknown | PD |
| MEX3A | SNV | Missense_Mutation | c.1381C>T | p.Arg461Trp | p.R461W | A1L020 | protein_coding | deleterious(0.02) | probably_damaging(0.928) | TCGA-CK-4951-01 | Colorectum | colon adenocarcinoma | Female | >=65 | I/II | Unknown | Unknown | PD | |
| MEX3A | SNV | Missense_Mutation | rs143845685 | c.1192N>A | p.Ala398Thr | p.A398T | A1L020 | protein_coding | tolerated(0.89) | benign(0.015) | TCGA-G4-6320-01 | Colorectum | colon adenocarcinoma | Male | >=65 | III/IV | Chemotherapy | oxaliplatin | SD |
| MEX3A | SNV | Missense_Mutation | c.1448N>T | p.Pro483Leu | p.P483L | A1L020 | protein_coding | deleterious(0) | probably_damaging(0.999) | TCGA-G4-6628-01 | Colorectum | colon adenocarcinoma | Male | >=65 | I/II | Unknown | Unknown | SD | |
| MEX3A | SNV | Missense_Mutation | c.853N>A | p.Glu285Lys | p.E285K | A1L020 | protein_coding | deleterious(0.02) | probably_damaging(0.981) | TCGA-AF-6136-01 | Colorectum | rectum adenocarcinoma | Female | >=65 | III/IV | Chemotherapy | 5-fluorouracil | PD | |
| MEX3A | SNV | Missense_Mutation | rs758454571 | c.928G>A | p.Asp310Asn | p.D310N | A1L020 | protein_coding | tolerated(0.07) | benign(0.003) | TCGA-AG-A002-01 | Colorectum | rectum adenocarcinoma | Male | <65 | I/II | Unknown | Unknown | SD |
| MEX3A | SNV | Missense_Mutation | rs143845685 | c.1192N>A | p.Ala398Thr | p.A398T | A1L020 | protein_coding | tolerated(0.89) | benign(0.015) | TCGA-AG-A00C-01 | Colorectum | rectum adenocarcinoma | Female | <65 | III/IV | Chemotherapy | 5-fluorouracil | CR |
| Page: 1 2 3 4 |
Top |
Related drugs of malignant transformation related genes |
| Identification of chemicals and drugs interact with genes involved in malignant transfromation |
| (DGIdb 4.0) |
| Entrez ID | Symbol | Category | Interaction Types | Drug Claim Name | Drug Name | PMIDs |
| Page: 1 |

Copyright 2023-Present -The University of Texas Health Science Center at Houston |