
|
|||||
|
 | |
| |
| |
| |
| |
| |
|
Gene: METTL9 |
Gene summary for METTL9 |
| Gene information | Species | Human | Gene symbol | METTL9 | Gene ID | 51108 |
| Gene name | methyltransferase like 9 | |
| Gene Alias | CGI-81 | |
| Cytomap | 16p12.2 | |
| Gene Type | protein-coding | GO ID | GO:0008150 | UniProtAcc | Q9H1A3 |
Top |
Malignant transformation analysis |
| Identification of the aberrant gene expression in precancerous and cancerous lesions by comparing the gene expression of stem-like cells in diseased tissues with normal stem cells |
| Entrez ID | Symbol | Replicates | Species | Organ | Tissue | Adj P-value | Log2FC | Malignancy |
| 51108 | METTL9 | AEH-subject1 | Human | Endometrium | AEH | 7.07e-15 | -3.51e-01 | -0.3059 |
| 51108 | METTL9 | AEH-subject2 | Human | Endometrium | AEH | 1.47e-14 | -3.86e-01 | -0.2525 |
| 51108 | METTL9 | AEH-subject3 | Human | Endometrium | AEH | 8.09e-08 | -2.97e-01 | -0.2576 |
| 51108 | METTL9 | AEH-subject4 | Human | Endometrium | AEH | 1.00e-07 | -3.50e-01 | -0.2657 |
| 51108 | METTL9 | AEH-subject5 | Human | Endometrium | AEH | 7.26e-13 | -4.06e-01 | -0.2953 |
| 51108 | METTL9 | EEC-subject1 | Human | Endometrium | EEC | 2.87e-16 | -3.81e-01 | -0.2682 |
| 51108 | METTL9 | EEC-subject2 | Human | Endometrium | EEC | 5.16e-18 | -4.58e-01 | -0.2607 |
| 51108 | METTL9 | EEC-subject3 | Human | Endometrium | EEC | 8.91e-35 | -2.97e-01 | -0.2525 |
| 51108 | METTL9 | EEC-subject4 | Human | Endometrium | EEC | 1.66e-09 | -2.95e-01 | -0.2571 |
| 51108 | METTL9 | EEC-subject5 | Human | Endometrium | EEC | 5.68e-05 | -2.97e-01 | -0.249 |
| 51108 | METTL9 | GSM6177620_NYU_UCEC1_lib1_lib1 | Human | Endometrium | EEC | 1.46e-27 | -2.18e-01 | -0.1869 |
| 51108 | METTL9 | GSM6177620_NYU_UCEC1_lib2_lib2 | Human | Endometrium | EEC | 1.47e-31 | -2.76e-01 | -0.1875 |
| 51108 | METTL9 | GSM6177620_NYU_UCEC1_lib3_lib3 | Human | Endometrium | EEC | 1.13e-33 | -1.68e-01 | -0.1883 |
| 51108 | METTL9 | GSM6177621_NYU_UCEC2_lib1_lib1 | Human | Endometrium | EEC | 6.62e-34 | -3.34e-01 | -0.1934 |
| 51108 | METTL9 | GSM6177622_NYU_UCEC3_lib1_lib1 | Human | Endometrium | EEC | 5.99e-52 | -2.59e-01 | -0.1917 |
| 51108 | METTL9 | GSM6177622_NYU_UCEC3_lib2_lib2 | Human | Endometrium | EEC | 4.87e-49 | -3.54e-01 | -0.1916 |
| 51108 | METTL9 | GSM6177623_NYU_UCEC3_Vis | Human | Endometrium | EEC | 2.21e-10 | -3.15e-01 | -0.1269 |
| 51108 | METTL9 | LZE4T | Human | Esophagus | ESCC | 3.47e-14 | 4.56e-01 | 0.0811 |
| 51108 | METTL9 | LZE7T | Human | Esophagus | ESCC | 2.24e-02 | 1.35e-01 | 0.0667 |
| 51108 | METTL9 | LZE8T | Human | Esophagus | ESCC | 7.50e-06 | -2.08e-01 | 0.067 |
| Page: 1 2 3 4 5 6 7 |
| Tissue | Expression Dynamics | Abbreviation |
| Endometrium | 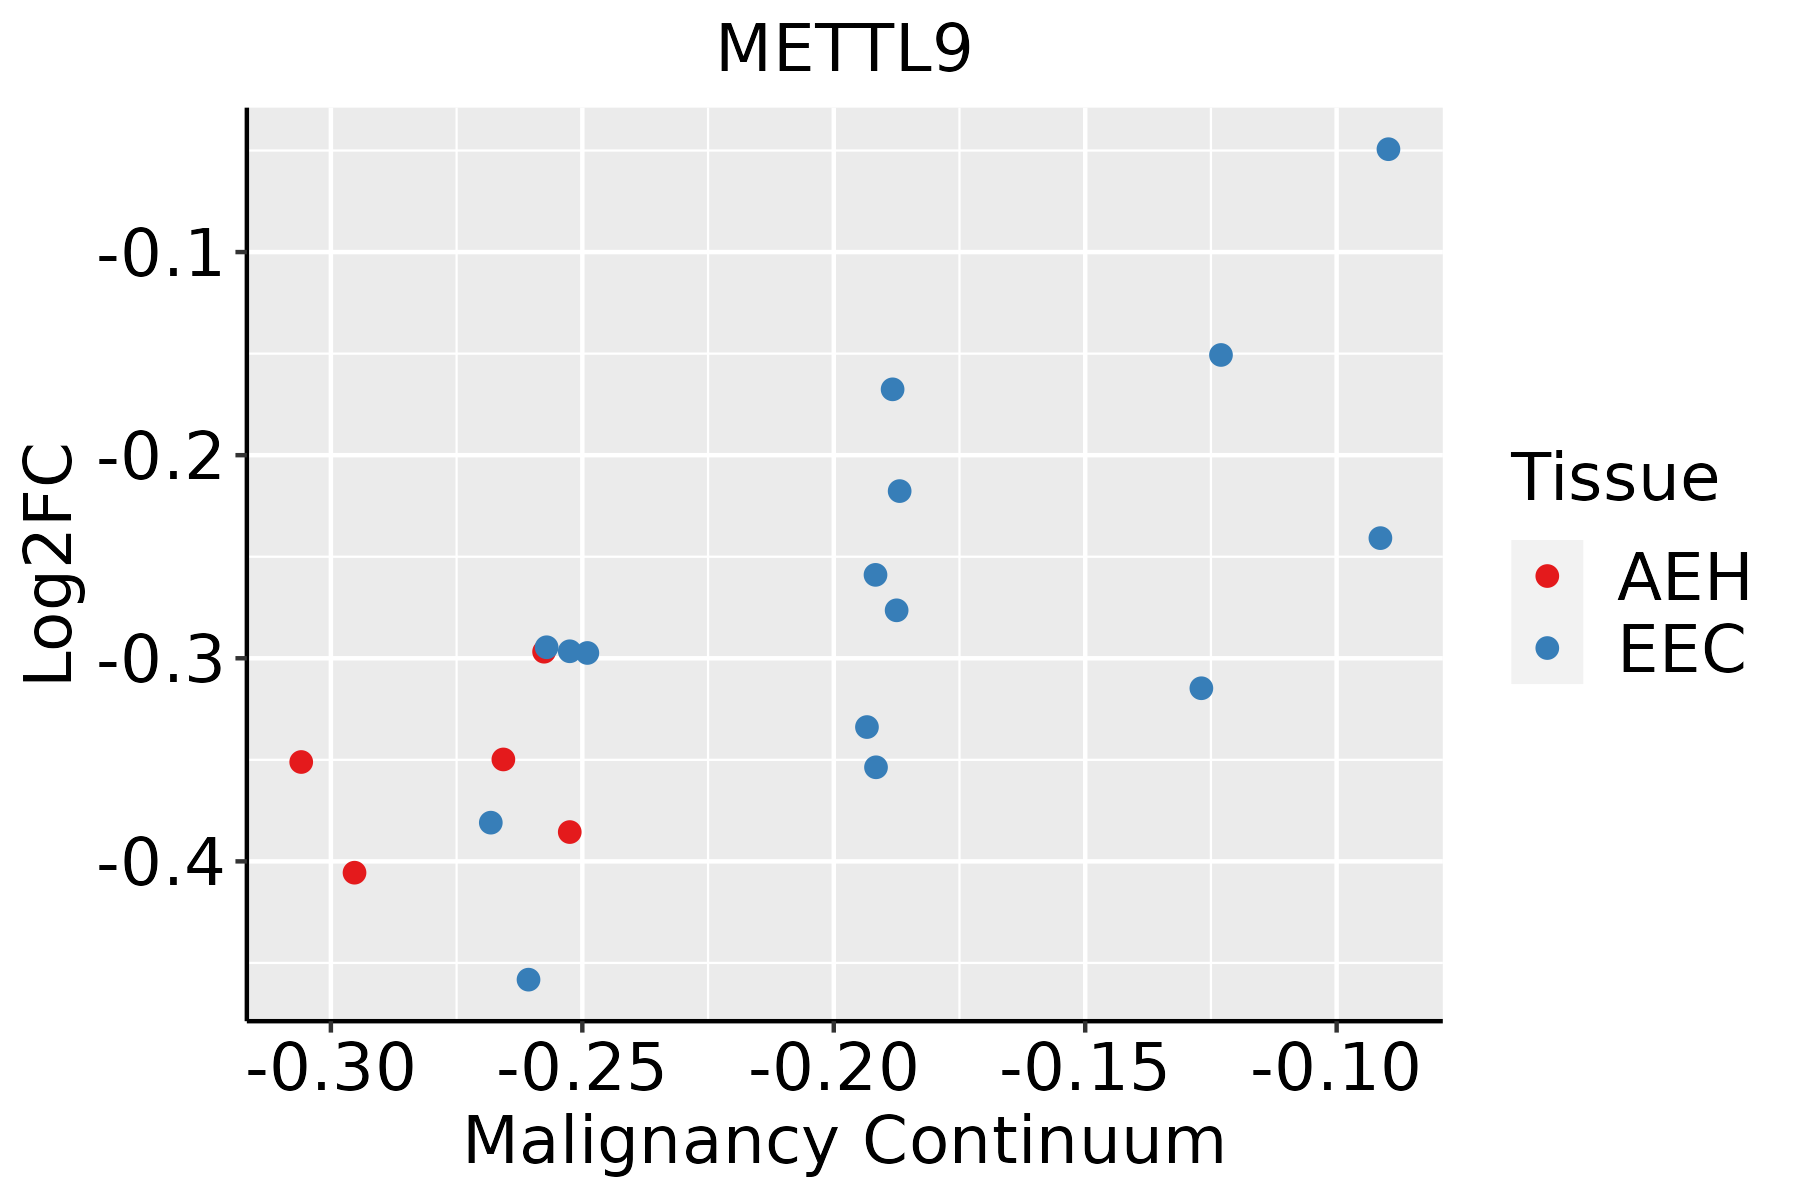 | AEH: Atypical endometrial hyperplasia |
| EEC: Endometrioid Cancer | ||
| Esophagus | 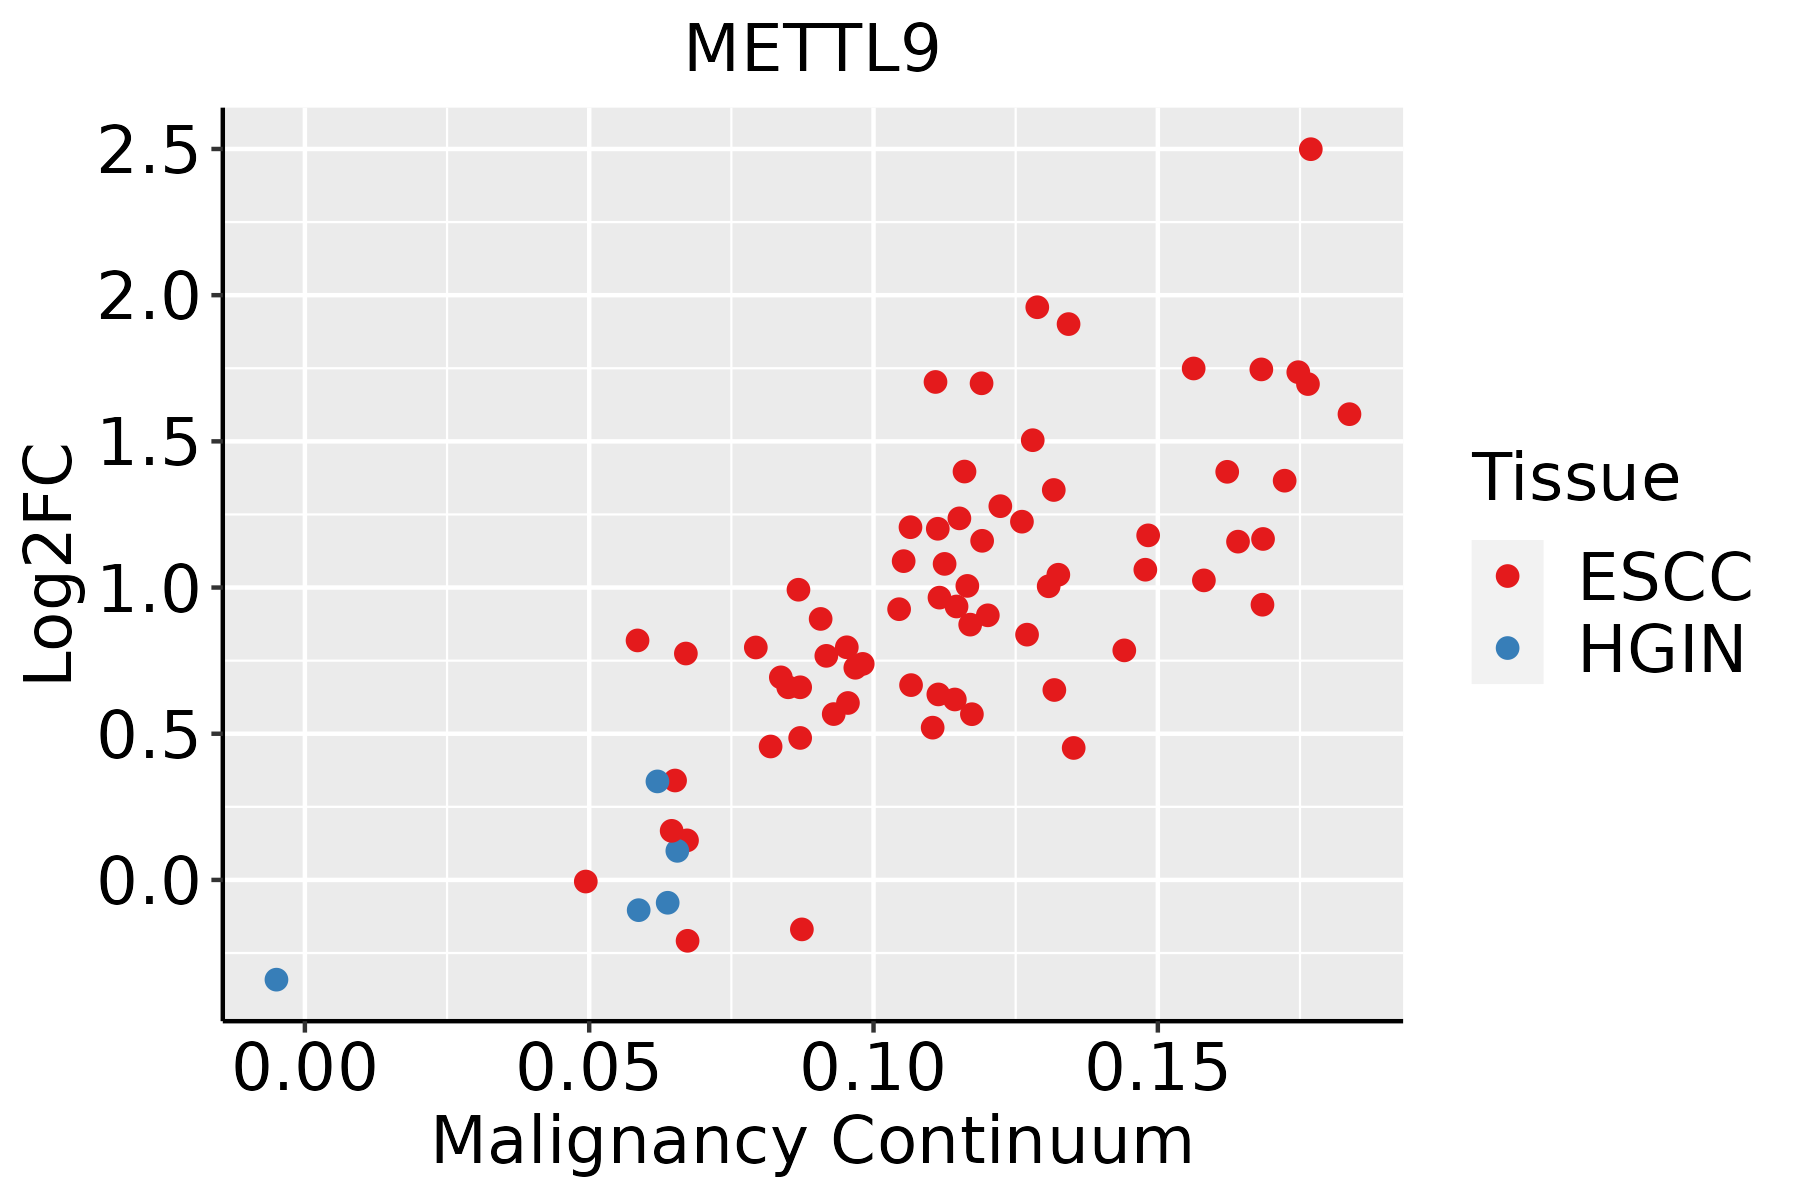 | ESCC: Esophageal squamous cell carcinoma |
| HGIN: High-grade intraepithelial neoplasias | ||
| LGIN: Low-grade intraepithelial neoplasias | ||
| Liver |  | HCC: Hepatocellular carcinoma |
| NAFLD: Non-alcoholic fatty liver disease | ||
| Oral Cavity | 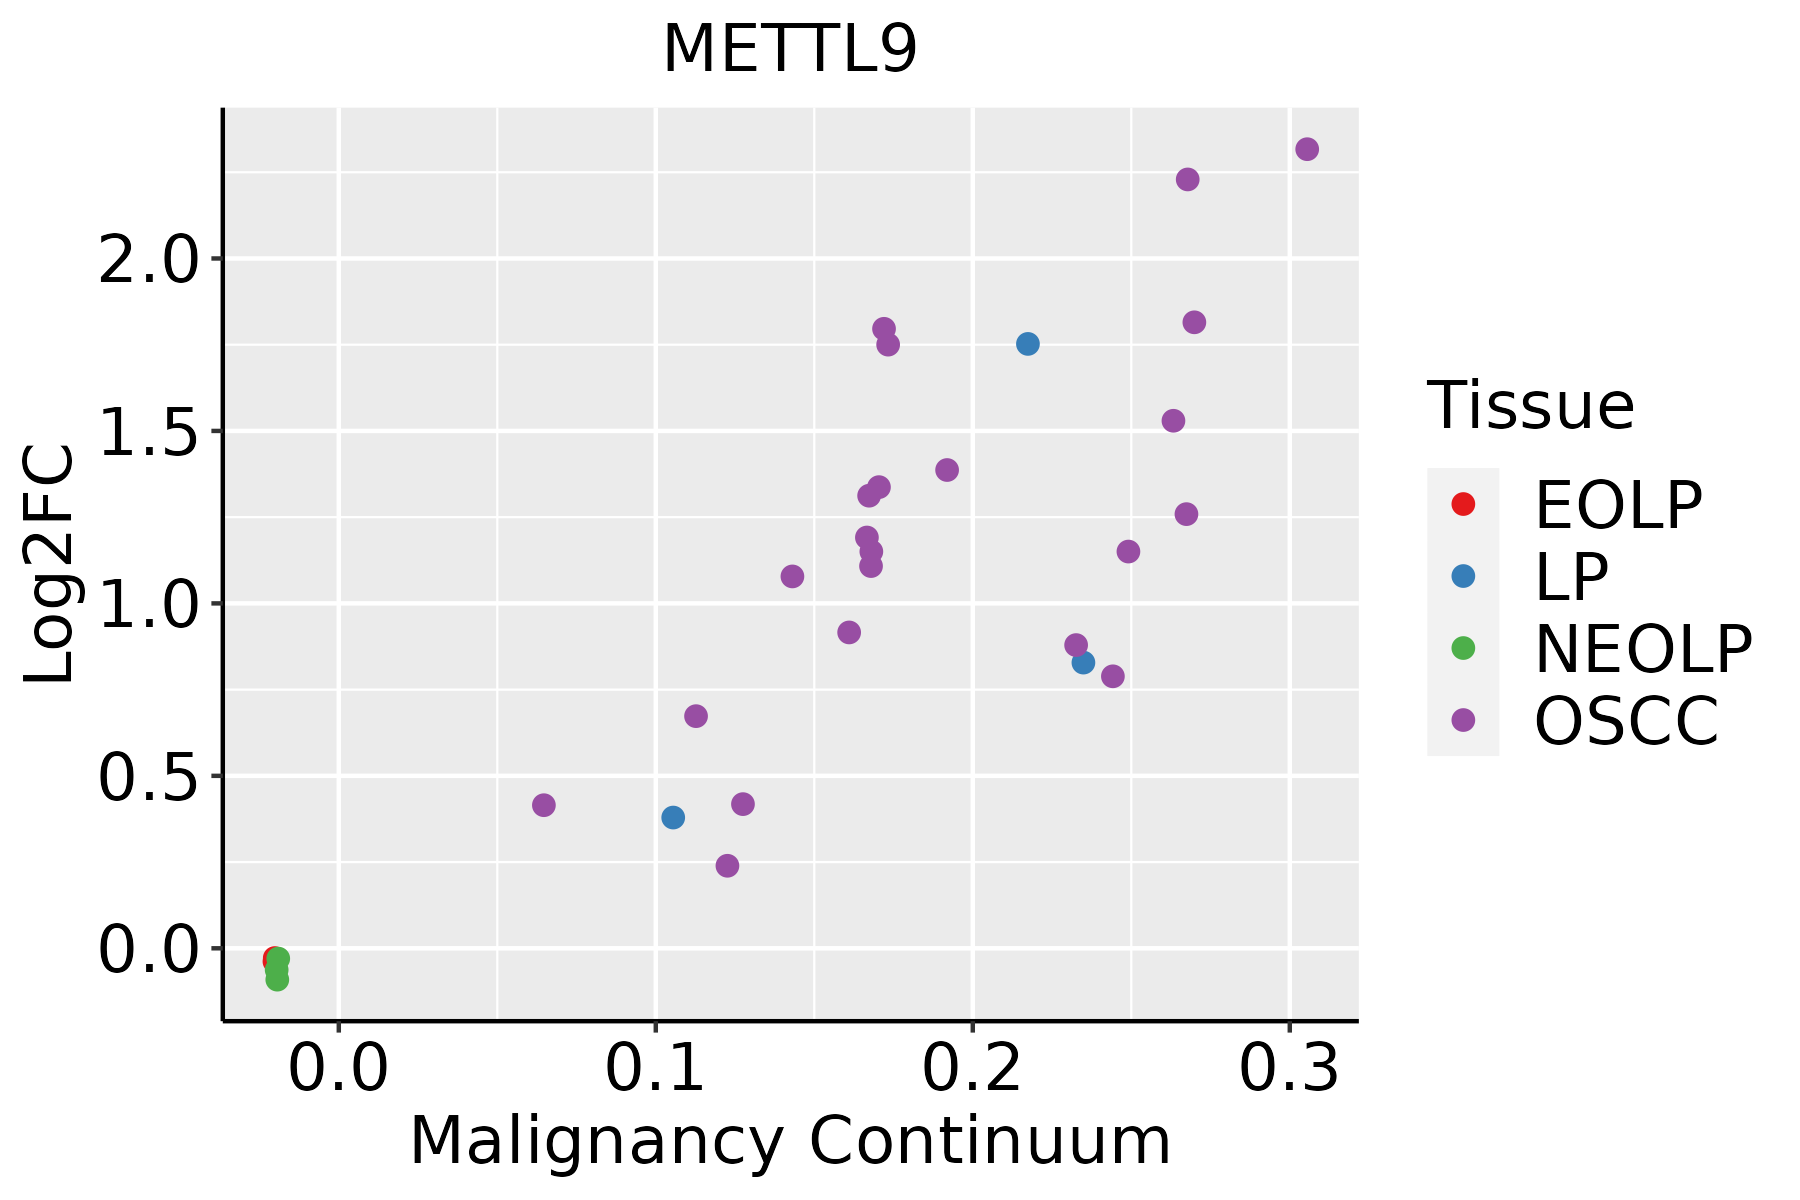 | EOLP: Erosive Oral lichen planus |
| LP: leukoplakia | ||
| NEOLP: Non-erosive oral lichen planus | ||
| OSCC: Oral squamous cell carcinoma | ||
| Prostate | 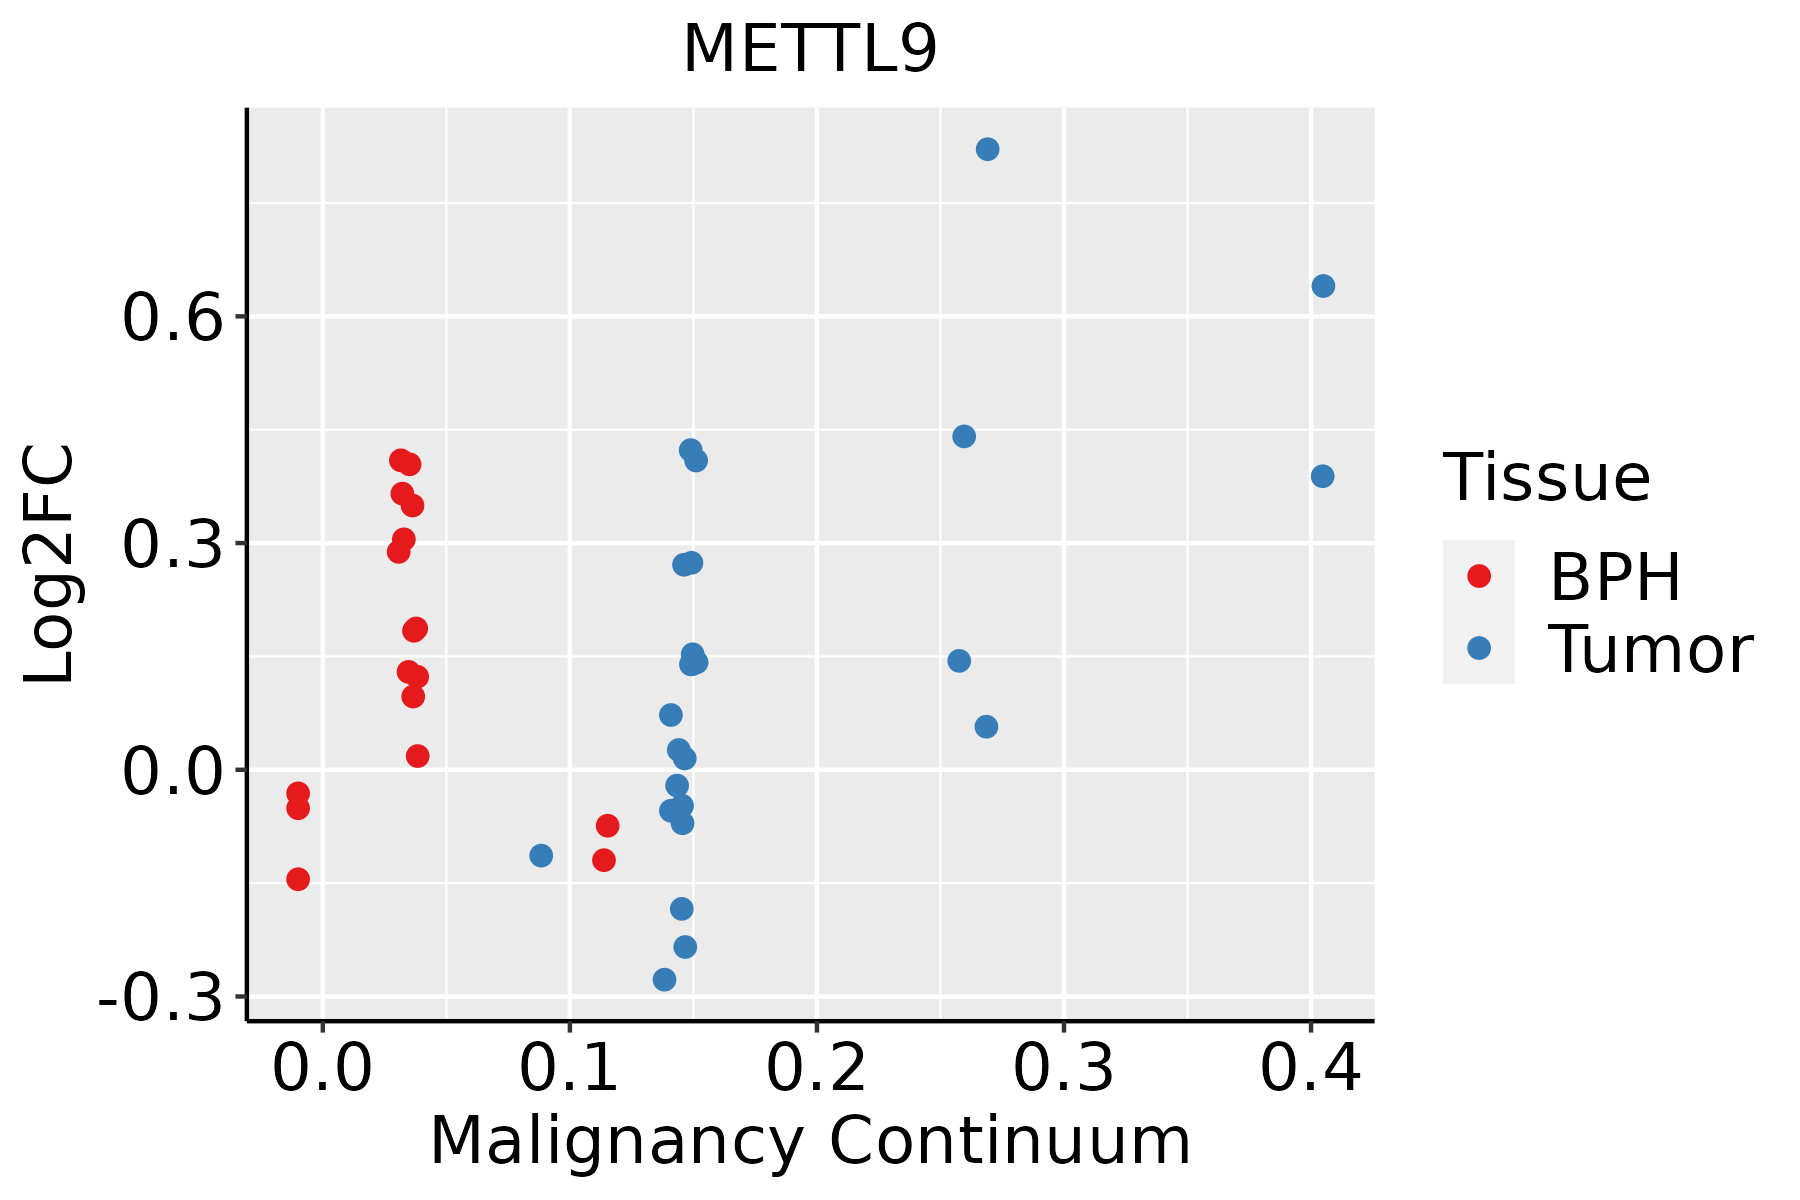 | BPH: Benign Prostatic Hyperplasia |
| Skin | 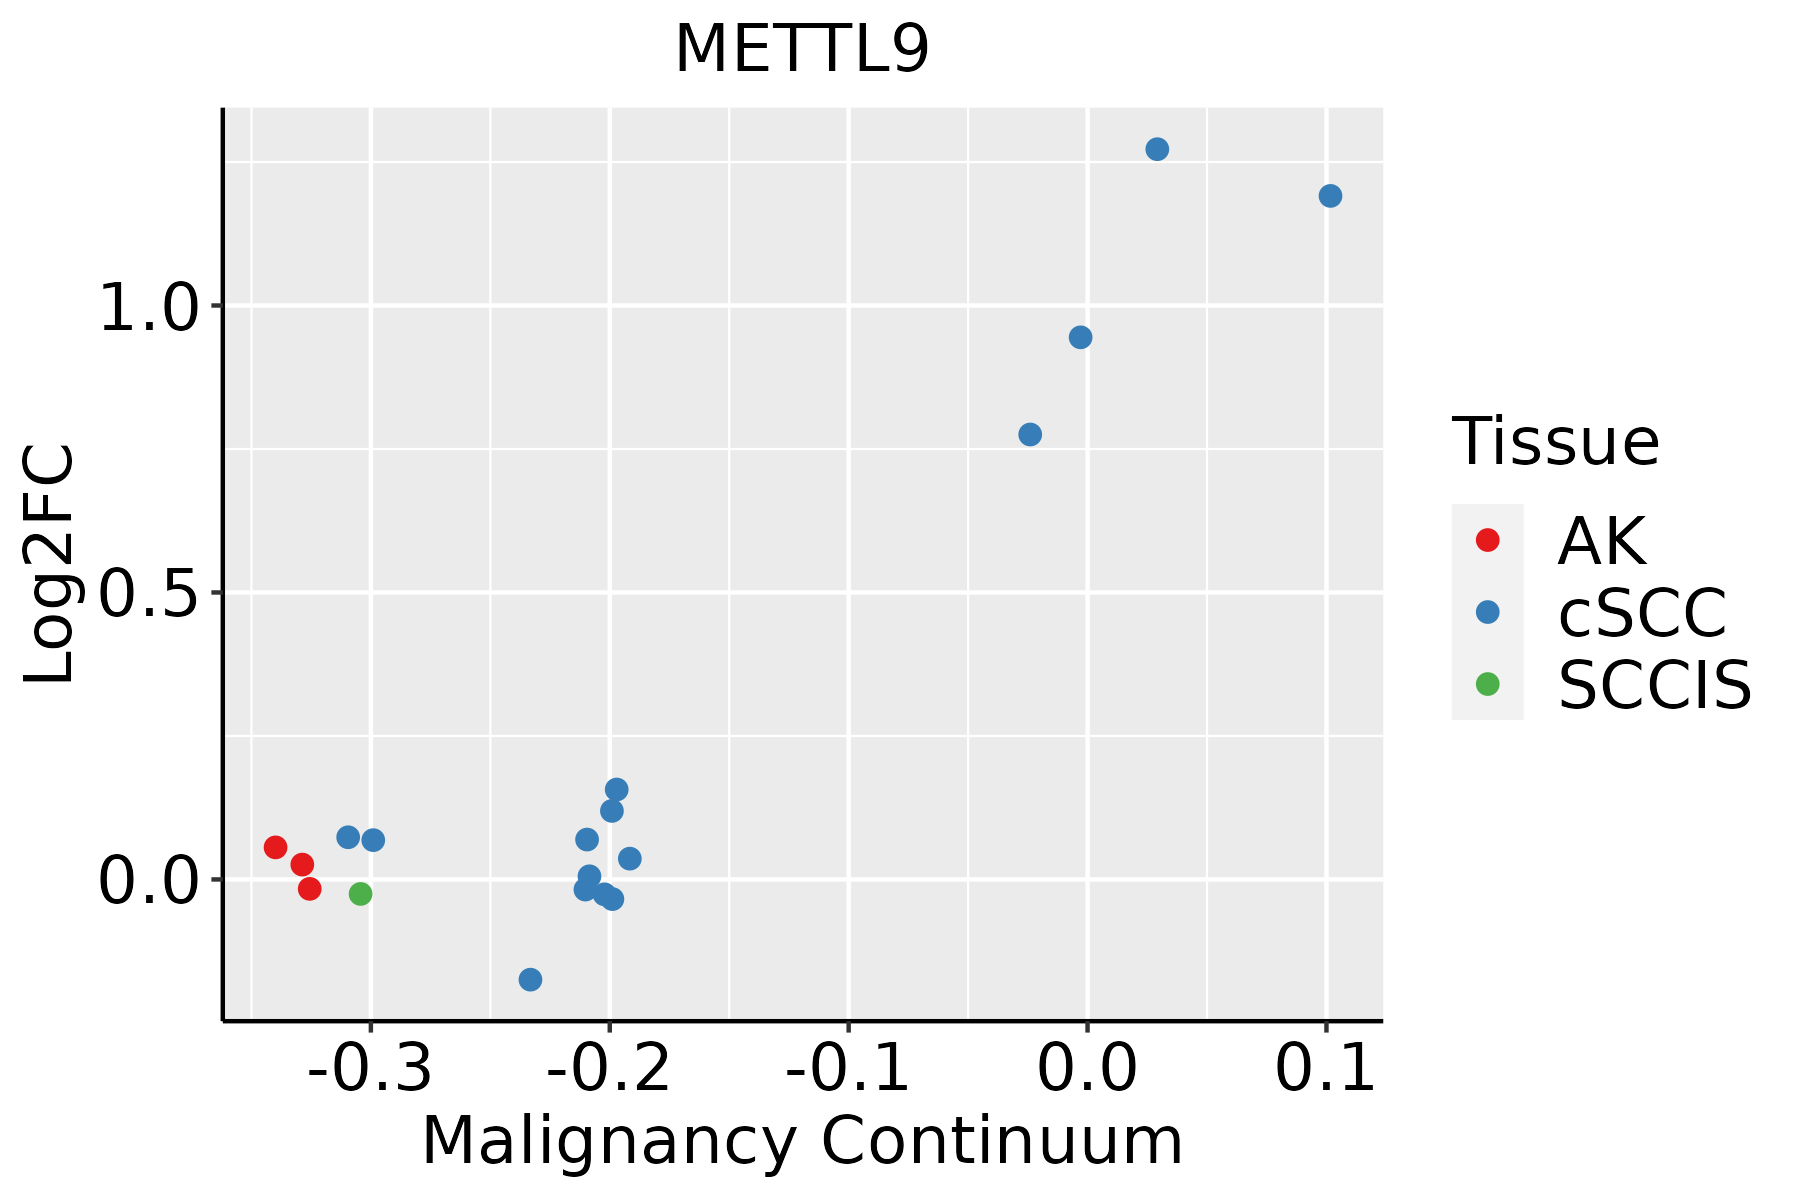 | AK: Actinic keratosis |
| cSCC: Cutaneous squamous cell carcinoma | ||
| SCCIS:squamous cell carcinoma in situ | ||
| Thyroid | 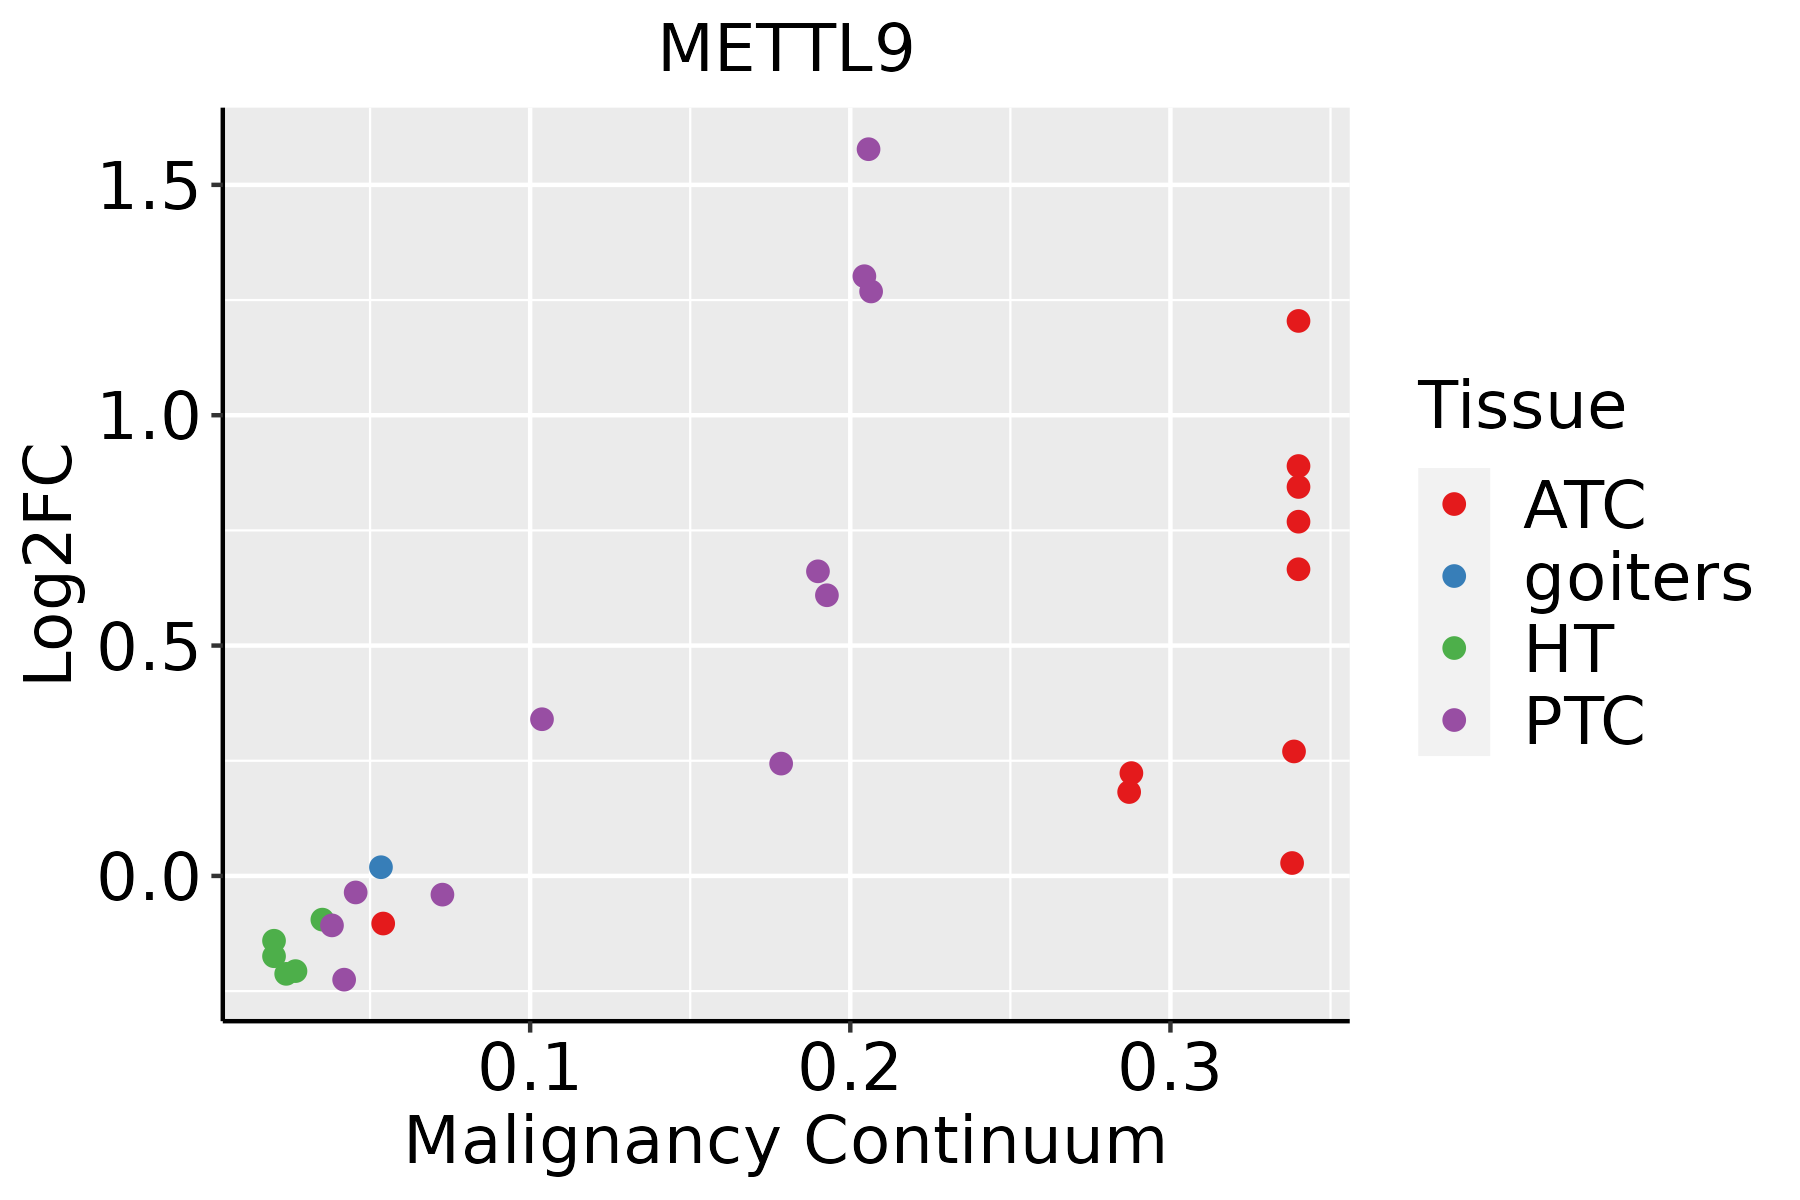 | ATC: Anaplastic thyroid cancer |
| HT: Hashimoto's thyroiditis | ||
| PTC: Papillary thyroid cancer |
| ∗log2FC in expression of this searched gene in stem-like cells from each diseased tissue sample relative to stem-like cells in normal samples in each tissue plotted against the malignancy continuum. Samples are colored based on if they are from different disease stage. |
Top |
Malignant transformation related pathway analysis |
| Find out the enriched GO biological processes and KEGG pathways involved in transition from healthy to precancer to cancer |
| Tissue | Disease Stage | Enriched GO biological Processes |
| Colorectum | AD |  |
| Colorectum | SER |  |
| Colorectum | MSS |  |
| Colorectum | MSI-H |  |
| Colorectum | FAP |  |
| ∗Top 15 enriched GO BP terms are showed in the bar plot of each disease state in each tissue. Each row represents a significant GO biological process which is colored according to the -log10(p.adjust). |
| Page: 1 2 3 4 5 6 7 8 9 |
| GO ID | Tissue | Disease Stage | Description | Gene Ratio | Bg Ratio | pvalue | p.adjust | Count |
| GO:00322592 | Esophagus | ESCC | methylation | 222/8552 | 364/18723 | 2.26e-09 | 5.09e-08 | 222 |
| GO:0032259 | Liver | HCC | methylation | 206/7958 | 364/18723 | 3.35e-08 | 7.53e-07 | 206 |
| GO:00322591 | Oral cavity | OSCC | methylation | 168/7305 | 364/18723 | 3.03e-03 | 1.31e-02 | 168 |
| GO:00322593 | Skin | cSCC | methylation | 120/4864 | 364/18723 | 1.61e-03 | 9.93e-03 | 120 |
| GO:00322594 | Thyroid | PTC | methylation | 146/5968 | 364/18723 | 4.99e-04 | 3.26e-03 | 146 |
| GO:003225911 | Thyroid | ATC | methylation | 148/6293 | 364/18723 | 2.69e-03 | 1.23e-02 | 148 |
| Page: 1 |
| Pathway ID | Tissue | Disease Stage | Description | Gene Ratio | Bg Ratio | pvalue | p.adjust | qvalue | Count |
| Page: 1 |
Top |
Cell-cell communication analysis |
| Identification of potential cell-cell interactions between two cell types and their ligand-receptor pairs for different disease states |
| Ligand | Receptor | LRpair | Pathway | Tissue | Disease Stage |
| Page: 1 |
Top |
Single-cell gene regulatory network inference analysis |
| Find out the significant the regulons (TFs) and the target genes of each regulon across cell types for different disease states |
| TF | Cell Type | Tissue | Disease Stage | Target Gene | RSS | Regulon Activity |
| ∗The dot plots of a searched regulon are shown for all cell subpopulations in each disease state of each tissue based on the regulon specific score inferred using pySCENIC and by calculating the average expression. |
| Page: 1 |
Top |
Somatic mutation of malignant transformation related genes |
| Annotation of somatic variants for genes involved in malignant transformation |
| Hugo Symbol | Variant Class | Variant Classification | dbSNP RS | HGVSc | HGVSp | HGVSp Short | SWISSPROT | BIOTYPE | SIFT | PolyPhen | Tumor Sample Barcode | Tissue | Histology | Sex | Age | Stage | Therapy Types | Drugs | Outcome |
| METTL9 | SNV | Missense_Mutation | c.698N>C | p.Arg233Thr | p.R233T | Q9H1A3 | protein_coding | tolerated(0.92) | benign(0.001) | TCGA-BH-A0H7-01 | Breast | breast invasive carcinoma | Female | >=65 | III/IV | Chemotherapy | doxorubicin | SD | |
| METTL9 | SNV | Missense_Mutation | novel | c.782T>A | p.Ile261Asn | p.I261N | Q9H1A3 | protein_coding | tolerated(0.29) | benign(0.054) | TCGA-OL-A66P-01 | Breast | breast invasive carcinoma | Female | >=65 | I/II | Chemotherapy | cytoxan | CR |
| METTL9 | SNV | Missense_Mutation | rs778358052 | c.919G>A | p.Val307Ile | p.V307I | Q9H1A3 | protein_coding | tolerated(0.15) | benign(0.141) | TCGA-AA-3697-01 | Colorectum | colon adenocarcinoma | Male | >=65 | I/II | Unknown | Unknown | SD |
| METTL9 | SNV | Missense_Mutation | novel | c.37G>A | p.Ala13Thr | p.A13T | Q9H1A3 | protein_coding | tolerated_low_confidence(0.08) | benign(0.01) | TCGA-AA-3984-01 | Colorectum | colon adenocarcinoma | Female | <65 | I/II | Unknown | Unknown | SD |
| METTL9 | SNV | Missense_Mutation | novel | c.606G>T | p.Gln202His | p.Q202H | Q9H1A3 | protein_coding | tolerated(0.07) | benign(0.009) | TCGA-CA-6717-01 | Colorectum | colon adenocarcinoma | Male | <65 | I/II | Chemotherapy | oxaliplatin | CR |
| METTL9 | SNV | Missense_Mutation | novel | c.558N>T | p.Lys186Asn | p.K186N | Q9H1A3 | protein_coding | deleterious(0.01) | possibly_damaging(0.723) | TCGA-EI-6917-01 | Colorectum | rectum adenocarcinoma | Male | <65 | III/IV | Chemotherapy | 5fluorouracil+oxaciplatina+l-folinian | SD |
| METTL9 | SNV | Missense_Mutation | novel | c.239N>T | p.Gly80Val | p.G80V | Q9H1A3 | protein_coding | deleterious(0.04) | possibly_damaging(0.616) | TCGA-A5-A0G2-01 | Endometrium | uterine corpus endometrioid carcinoma | Female | <65 | III/IV | Unknown | Unknown | SD |
| METTL9 | SNV | Missense_Mutation | novel | c.932N>A | p.Ala311Asp | p.A311D | Q9H1A3 | protein_coding | deleterious(0) | possibly_damaging(0.825) | TCGA-A5-A0G2-01 | Endometrium | uterine corpus endometrioid carcinoma | Female | <65 | III/IV | Unknown | Unknown | SD |
| METTL9 | SNV | Missense_Mutation | novel | c.224N>A | p.Ser75Asn | p.S75N | Q9H1A3 | protein_coding | tolerated(0.19) | benign(0.031) | TCGA-AJ-A3EK-01 | Endometrium | uterine corpus endometrioid carcinoma | Female | <65 | I/II | Chemotherapy | carboplatin | CR |
| METTL9 | SNV | Missense_Mutation | novel | c.407G>T | p.Arg136Ile | p.R136I | Q9H1A3 | protein_coding | deleterious(0.01) | possibly_damaging(0.69) | TCGA-AP-A1DV-01 | Endometrium | uterine corpus endometrioid carcinoma | Female | <65 | I/II | Unknown | Unknown | SD |
| Page: 1 2 3 |
Top |
Related drugs of malignant transformation related genes |
| Identification of chemicals and drugs interact with genes involved in malignant transfromation |
| (DGIdb 4.0) |
| Entrez ID | Symbol | Category | Interaction Types | Drug Claim Name | Drug Name | PMIDs |
| Page: 1 |

Copyright 2023-Present -The University of Texas Health Science Center at Houston |