
|
|||||
|
 | |
| |
| |
| |
| |
| |
|
Gene: METTL8 |
Gene summary for METTL8 |
| Gene information | Species | Human | Gene symbol | METTL8 | Gene ID | 79828 |
| Gene name | methyltransferase 8, methylcytidine | |
| Gene Alias | TIP | |
| Cytomap | 2q31.1 | |
| Gene Type | protein-coding | GO ID | GO:0001510 | UniProtAcc | B3KW44 |
Top |
Malignant transformation analysis |
| Identification of the aberrant gene expression in precancerous and cancerous lesions by comparing the gene expression of stem-like cells in diseased tissues with normal stem cells |
| Entrez ID | Symbol | Replicates | Species | Organ | Tissue | Adj P-value | Log2FC | Malignancy |
| 79828 | METTL8 | HTA11_1391_2000001011 | Human | Colorectum | AD | 1.59e-09 | 6.06e-01 | -0.059 |
| 79828 | METTL8 | HTA11_7663_2000001011 | Human | Colorectum | SER | 2.19e-02 | 6.27e-01 | 0.0131 |
| 79828 | METTL8 | HTA11_11156_2000001011 | Human | Colorectum | AD | 1.67e-03 | 8.04e-01 | 0.0397 |
| 79828 | METTL8 | HTA11_6818_2000001021 | Human | Colorectum | AD | 2.83e-08 | 6.83e-01 | 0.0588 |
| 79828 | METTL8 | HTA11_99999971662_82457 | Human | Colorectum | MSS | 1.46e-12 | 7.33e-01 | 0.3859 |
| 79828 | METTL8 | HTA11_99999974143_84620 | Human | Colorectum | MSS | 6.55e-08 | 5.12e-01 | 0.3005 |
| 79828 | METTL8 | A015-C-203 | Human | Colorectum | FAP | 1.90e-11 | -2.75e-01 | -0.1294 |
| 79828 | METTL8 | A002-C-201 | Human | Colorectum | FAP | 1.29e-02 | -1.14e-01 | 0.0324 |
| 79828 | METTL8 | A001-C-119 | Human | Colorectum | FAP | 2.57e-02 | -2.19e-01 | -0.1557 |
| 79828 | METTL8 | A001-C-108 | Human | Colorectum | FAP | 7.99e-06 | -3.52e-02 | -0.0272 |
| 79828 | METTL8 | A002-C-205 | Human | Colorectum | FAP | 1.14e-06 | -1.63e-01 | -0.1236 |
| 79828 | METTL8 | A015-C-006 | Human | Colorectum | FAP | 3.14e-04 | -1.47e-01 | -0.0994 |
| 79828 | METTL8 | A015-C-106 | Human | Colorectum | FAP | 6.82e-03 | 6.33e-02 | -0.0511 |
| 79828 | METTL8 | A002-C-114 | Human | Colorectum | FAP | 1.07e-05 | -2.09e-01 | -0.1561 |
| 79828 | METTL8 | A015-C-104 | Human | Colorectum | FAP | 2.76e-12 | -1.23e-01 | -0.1899 |
| 79828 | METTL8 | A001-C-014 | Human | Colorectum | FAP | 3.05e-02 | -8.45e-02 | 0.0135 |
| 79828 | METTL8 | A002-C-016 | Human | Colorectum | FAP | 1.09e-07 | -1.81e-01 | 0.0521 |
| 79828 | METTL8 | A015-C-002 | Human | Colorectum | FAP | 4.63e-02 | -1.46e-01 | -0.0763 |
| 79828 | METTL8 | A002-C-116 | Human | Colorectum | FAP | 4.70e-14 | -2.65e-01 | -0.0452 |
| 79828 | METTL8 | A014-C-008 | Human | Colorectum | FAP | 7.14e-04 | -2.30e-01 | -0.191 |
| Page: 1 2 3 4 5 6 |
| Tissue | Expression Dynamics | Abbreviation |
| Colorectum (GSE201348) |  | FAP: Familial adenomatous polyposis |
| CRC: Colorectal cancer | ||
| Colorectum (HTA11) |  | AD: Adenomas |
| SER: Sessile serrated lesions | ||
| MSI-H: Microsatellite-high colorectal cancer | ||
| MSS: Microsatellite stable colorectal cancer | ||
| Esophagus | 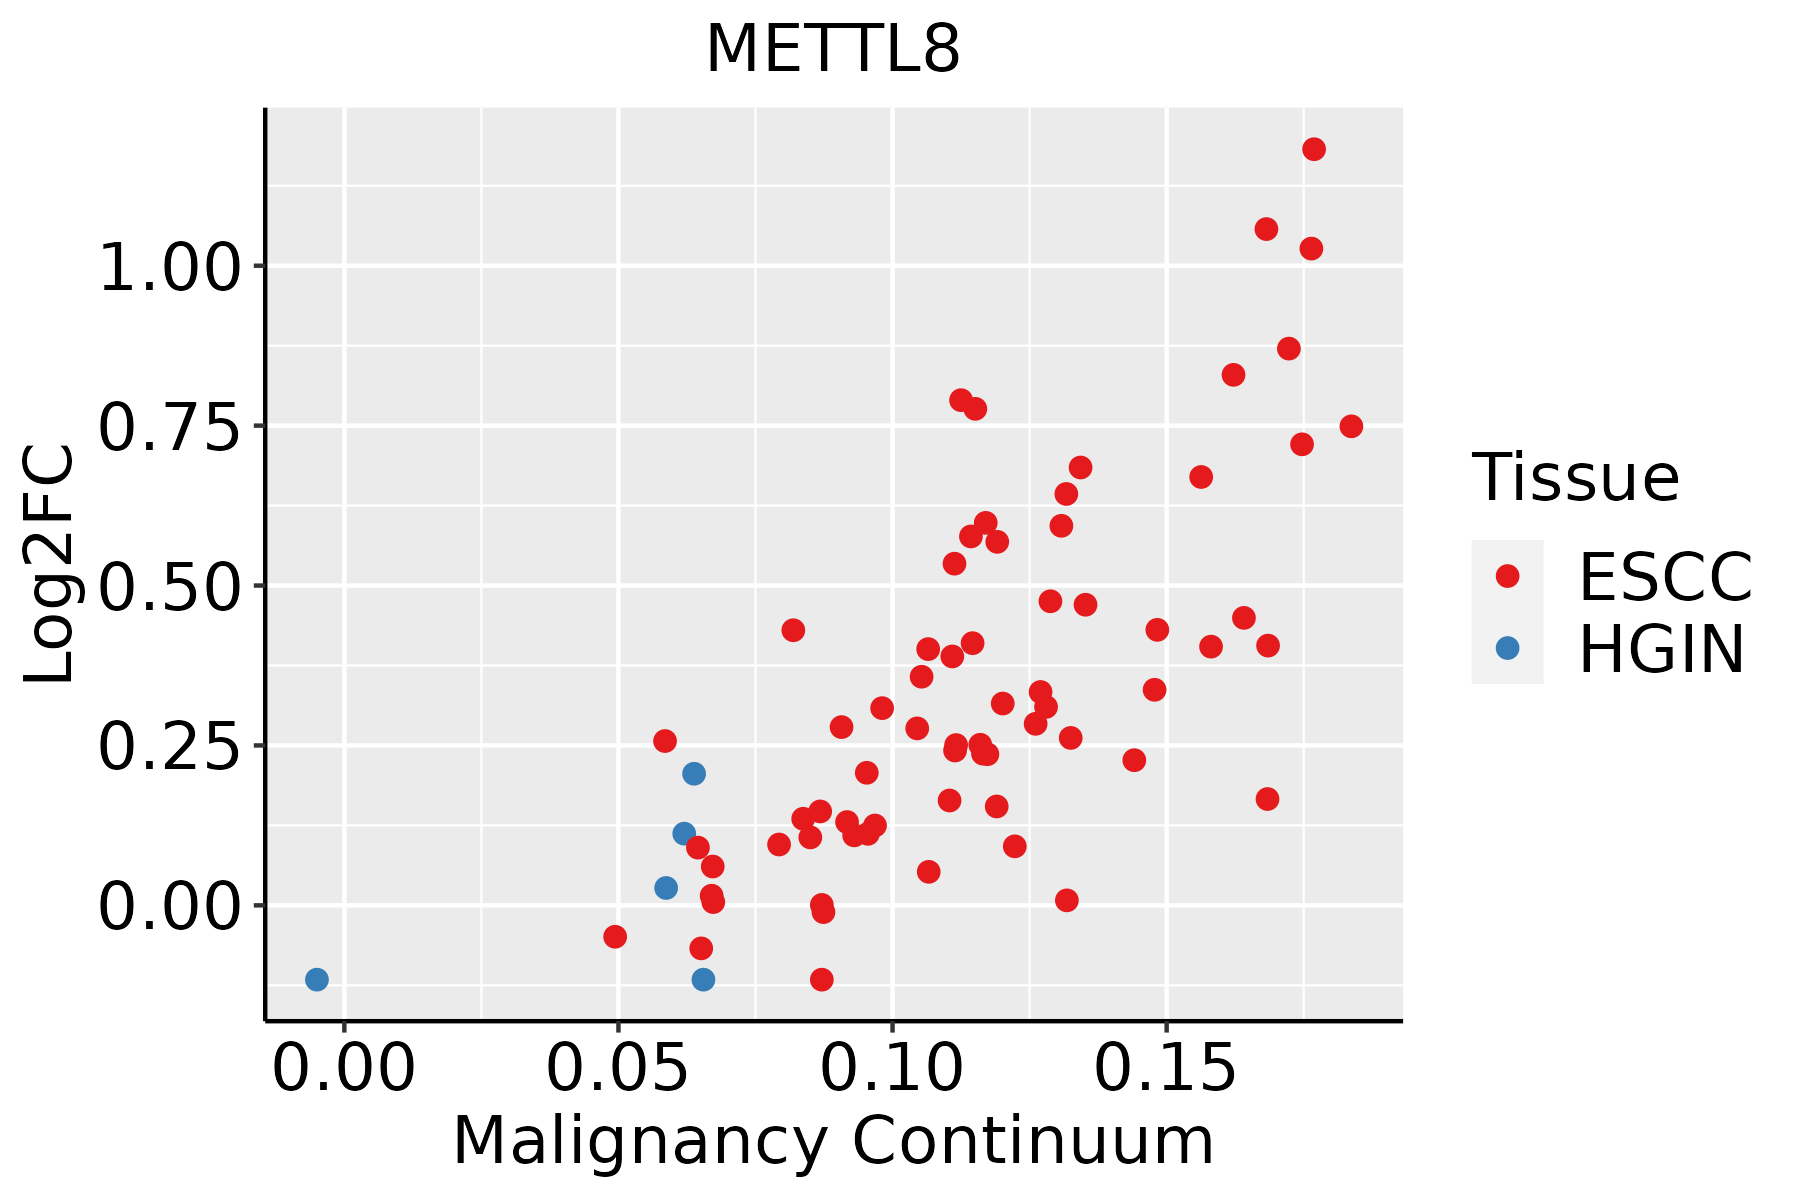 | ESCC: Esophageal squamous cell carcinoma |
| HGIN: High-grade intraepithelial neoplasias | ||
| LGIN: Low-grade intraepithelial neoplasias | ||
| Liver | 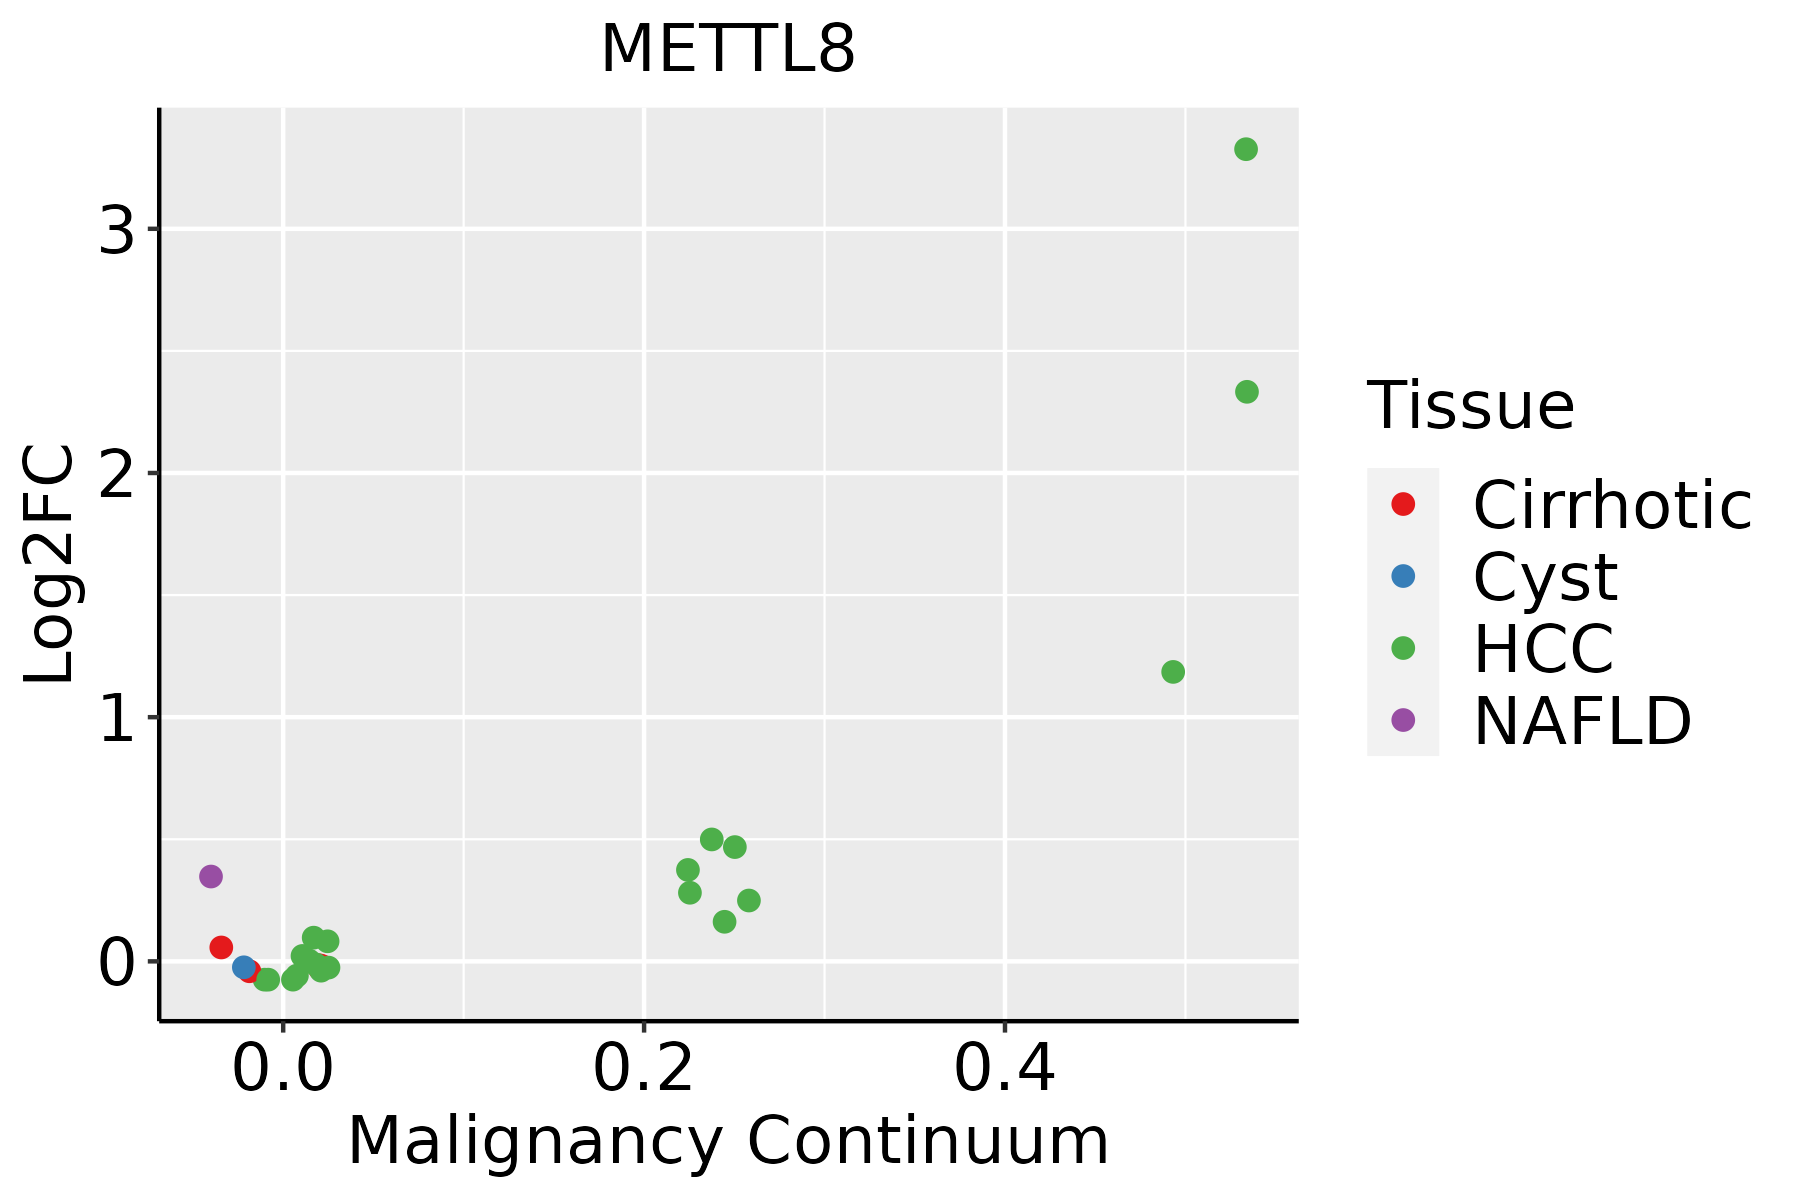 | HCC: Hepatocellular carcinoma |
| NAFLD: Non-alcoholic fatty liver disease | ||
| Oral Cavity | 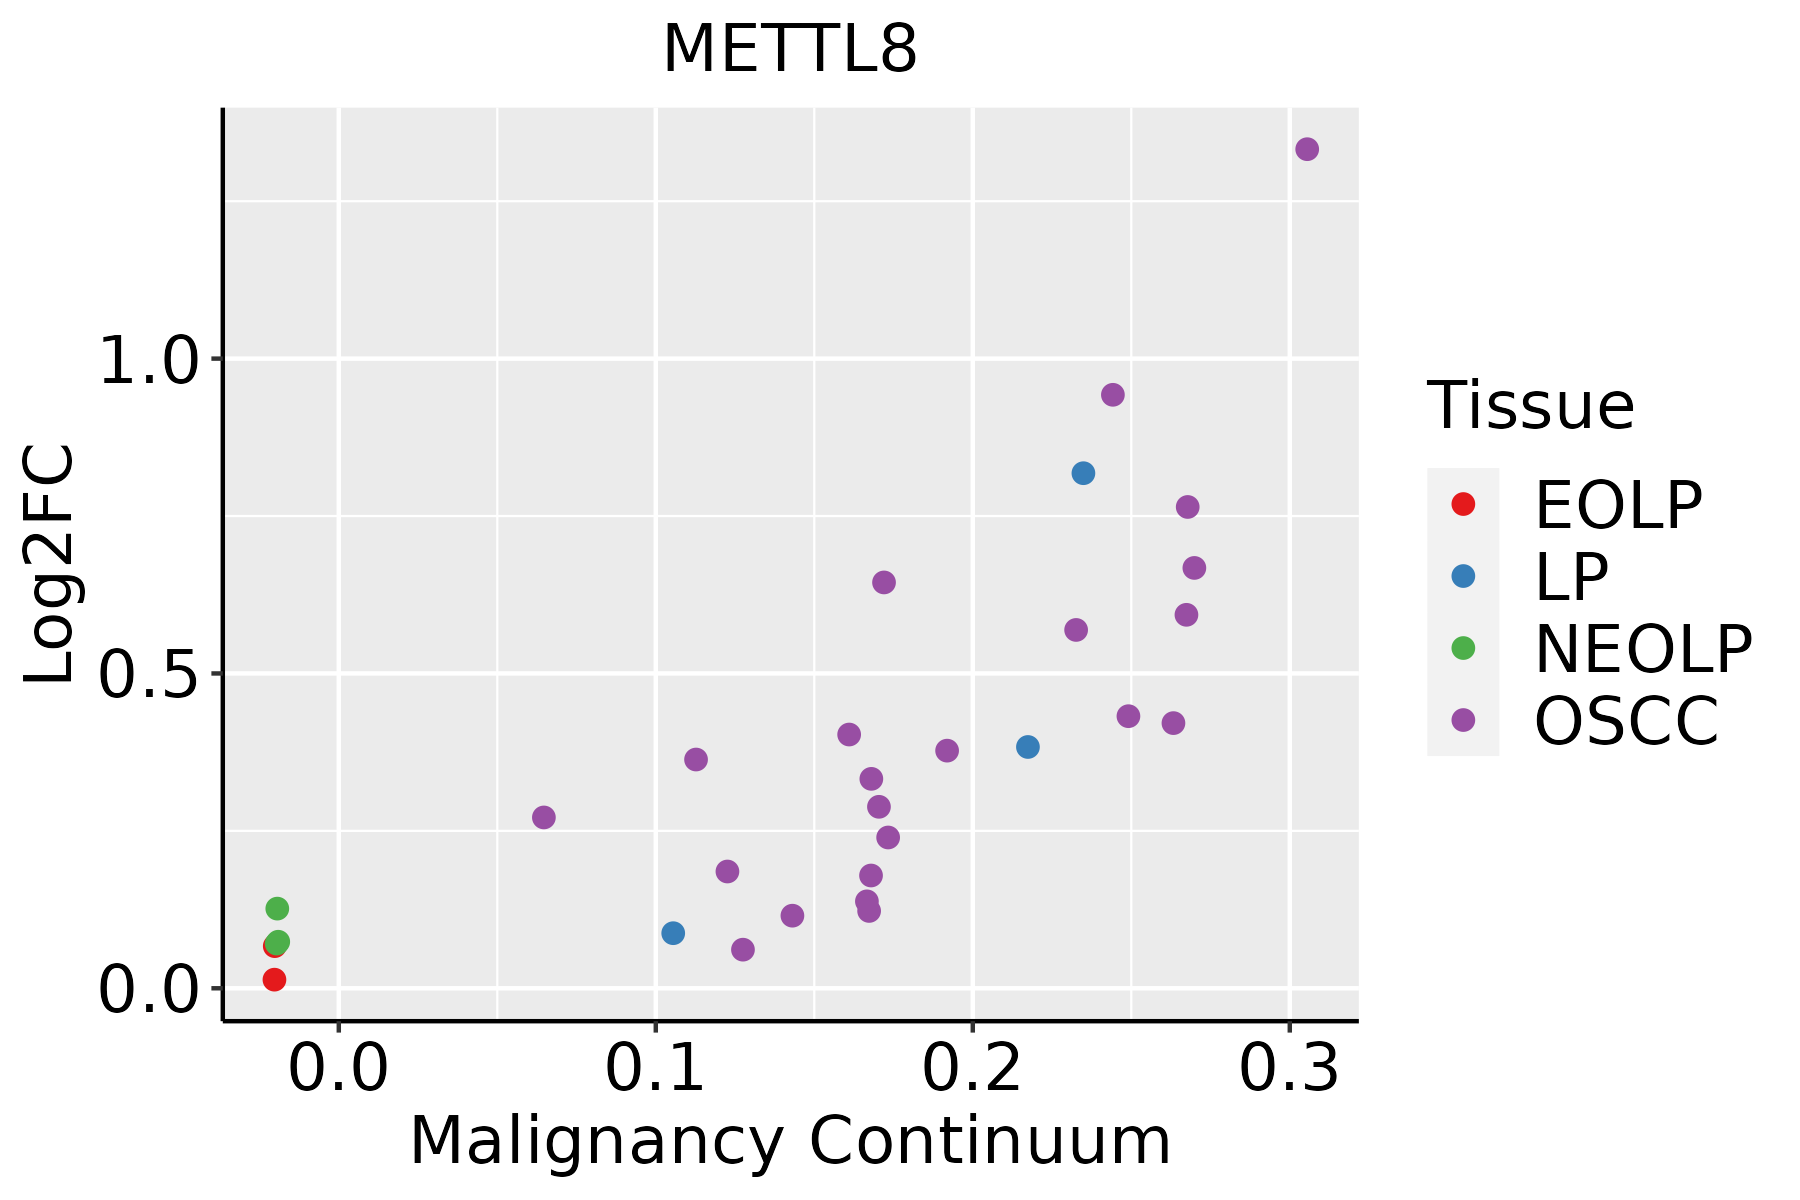 | EOLP: Erosive Oral lichen planus |
| LP: leukoplakia | ||
| NEOLP: Non-erosive oral lichen planus | ||
| OSCC: Oral squamous cell carcinoma | ||
| Skin | 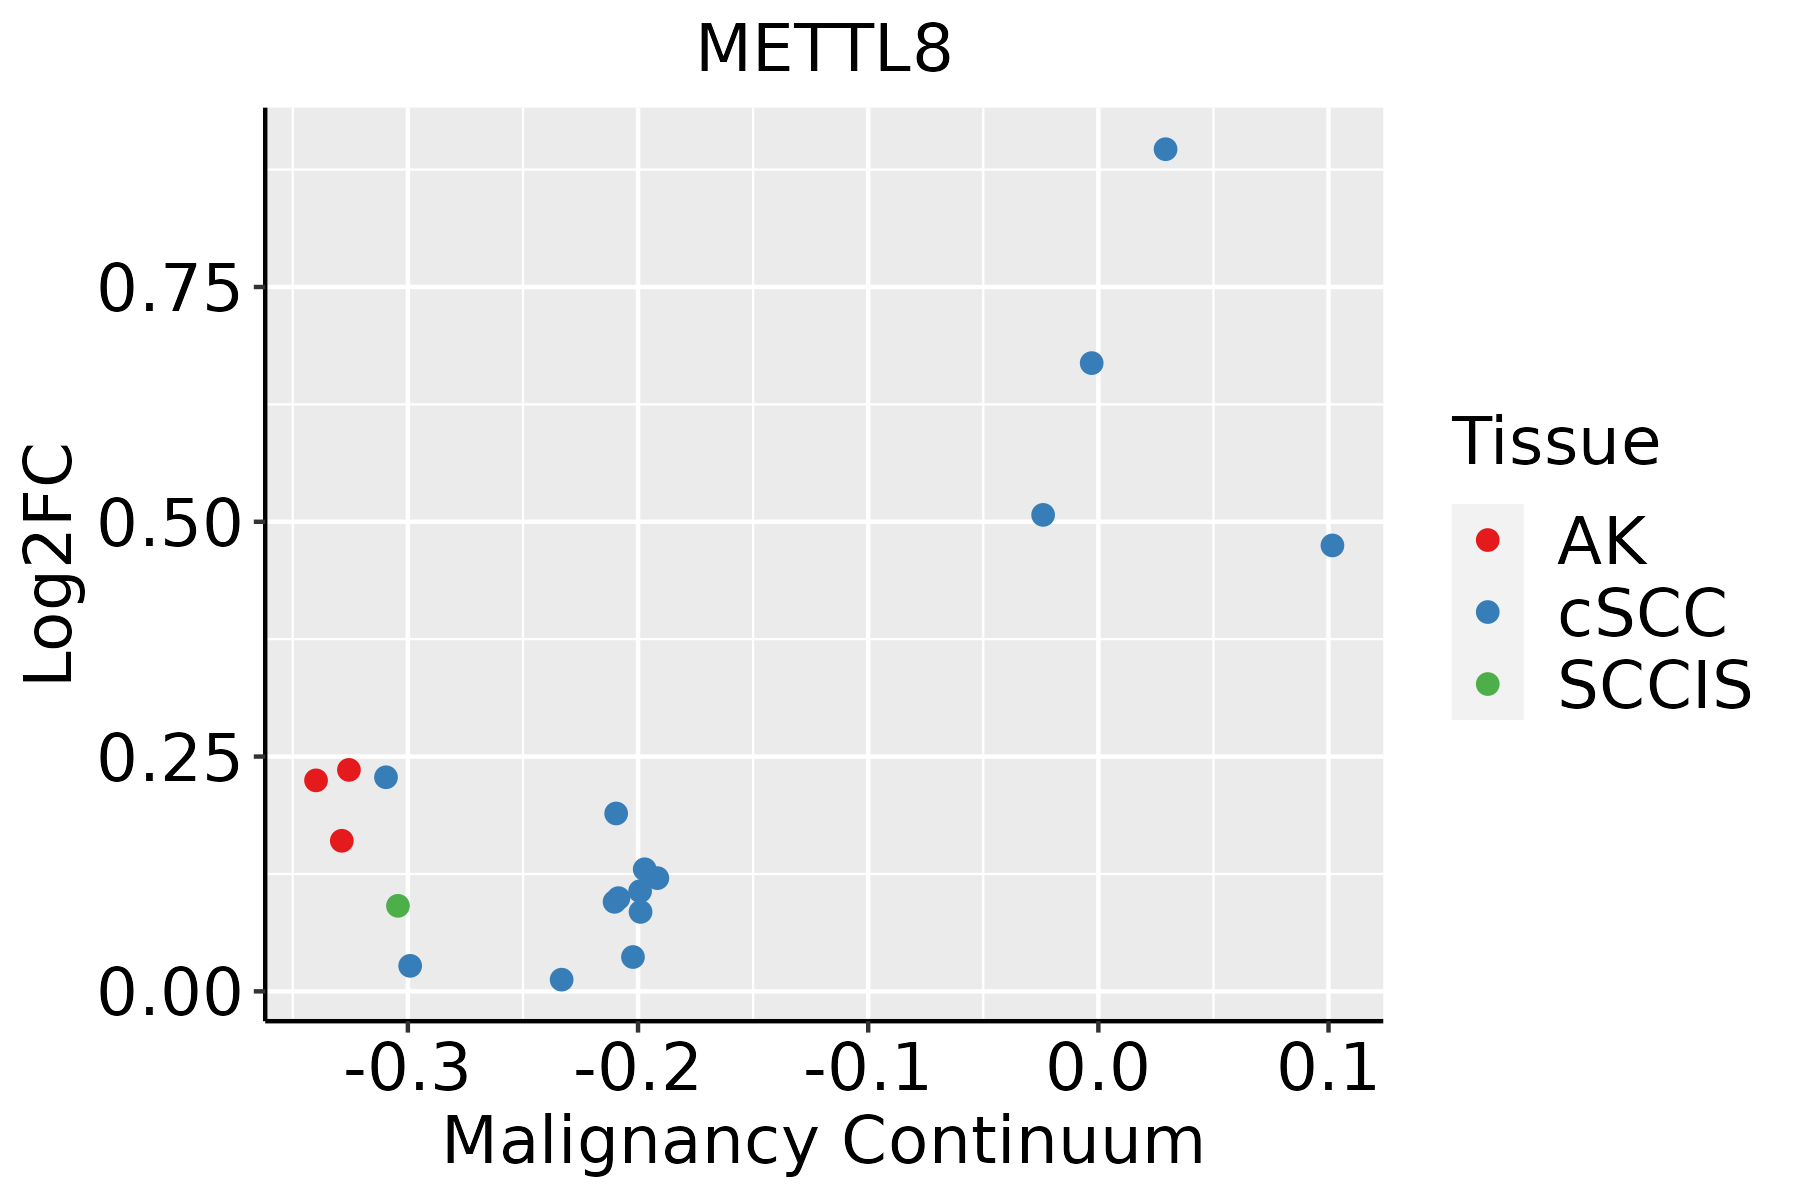 | AK: Actinic keratosis |
| cSCC: Cutaneous squamous cell carcinoma | ||
| SCCIS:squamous cell carcinoma in situ | ||
| Thyroid | 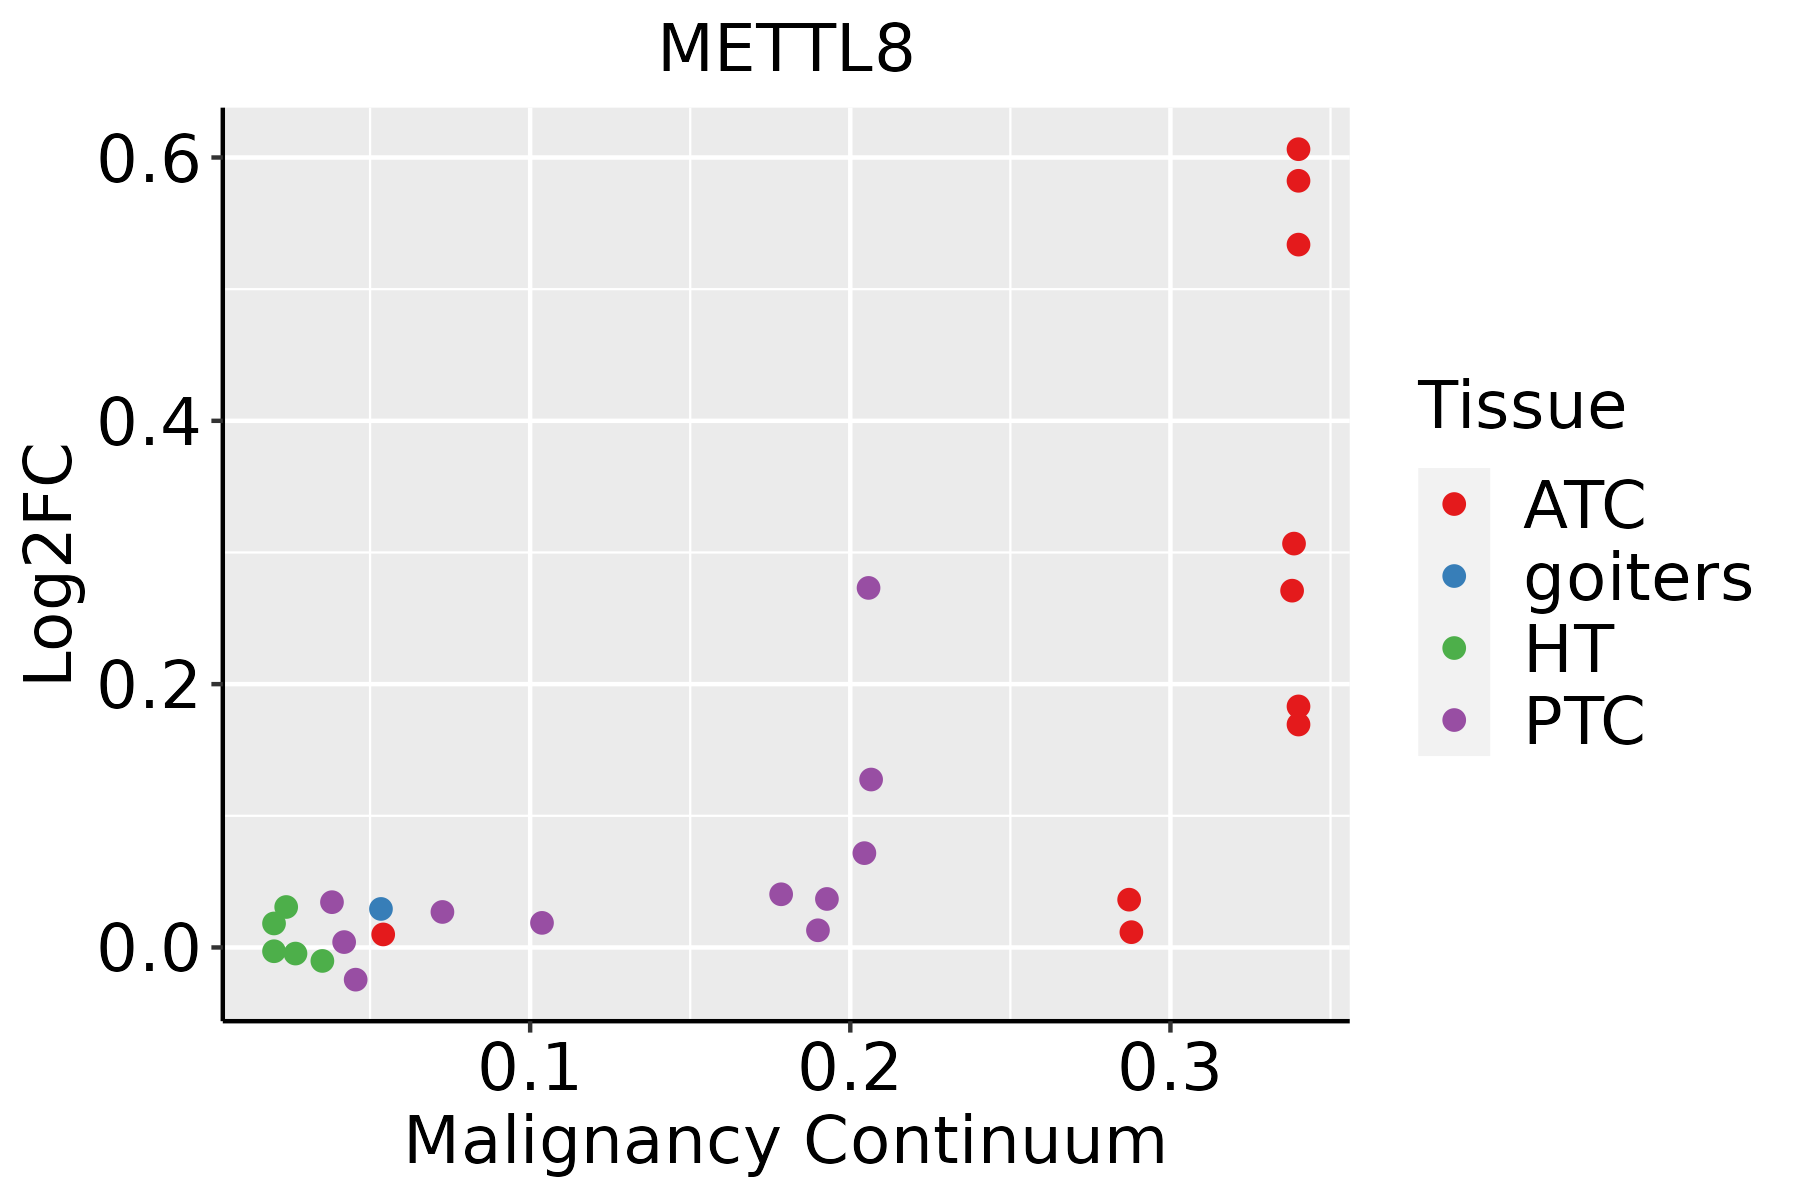 | ATC: Anaplastic thyroid cancer |
| HT: Hashimoto's thyroiditis | ||
| PTC: Papillary thyroid cancer |
| ∗log2FC in expression of this searched gene in stem-like cells from each diseased tissue sample relative to stem-like cells in normal samples in each tissue plotted against the malignancy continuum. Samples are colored based on if they are from different disease stage. |
Top |
Malignant transformation related pathway analysis |
| Find out the enriched GO biological processes and KEGG pathways involved in transition from healthy to precancer to cancer |
| Tissue | Disease Stage | Enriched GO biological Processes |
| Colorectum | AD |  |
| Colorectum | SER |  |
| Colorectum | MSS |  |
| Colorectum | MSI-H |  |
| Colorectum | FAP |  |
| ∗Top 15 enriched GO BP terms are showed in the bar plot of each disease state in each tissue. Each row represents a significant GO biological process which is colored according to the -log10(p.adjust). |
| Page: 1 2 3 4 5 6 7 8 9 |
| GO ID | Tissue | Disease Stage | Description | Gene Ratio | Bg Ratio | pvalue | p.adjust | Count |
| GO:003447015 | Esophagus | ESCC | ncRNA processing | 300/8552 | 395/18723 | 3.09e-35 | 3.26e-32 | 300 |
| GO:003466012 | Esophagus | ESCC | ncRNA metabolic process | 346/8552 | 485/18723 | 4.35e-31 | 2.51e-28 | 346 |
| GO:00434143 | Esophagus | ESCC | macromolecule methylation | 199/8552 | 316/18723 | 3.44e-10 | 9.57e-09 | 199 |
| GO:00080333 | Esophagus | ESCC | tRNA processing | 92/8552 | 127/18723 | 7.83e-10 | 1.93e-08 | 92 |
| GO:00063992 | Esophagus | ESCC | tRNA metabolic process | 122/8552 | 179/18723 | 9.03e-10 | 2.19e-08 | 122 |
| GO:00322592 | Esophagus | ESCC | methylation | 222/8552 | 364/18723 | 2.26e-09 | 5.09e-08 | 222 |
| GO:00094512 | Esophagus | ESCC | RNA modification | 114/8552 | 167/18723 | 2.76e-09 | 6.04e-08 | 114 |
| GO:00015101 | Esophagus | ESCC | RNA methylation | 58/8552 | 83/18723 | 6.87e-06 | 6.94e-05 | 58 |
| GO:00064002 | Esophagus | ESCC | tRNA modification | 62/8552 | 90/18723 | 7.02e-06 | 7.04e-05 | 62 |
| GO:00304881 | Esophagus | ESCC | tRNA methylation | 30/8552 | 41/18723 | 3.27e-04 | 1.93e-03 | 30 |
| GO:00800092 | Esophagus | ESCC | mRNA methylation | 14/8552 | 16/18723 | 6.78e-04 | 3.56e-03 | 14 |
| GO:00165561 | Esophagus | ESCC | mRNA modification | 21/8552 | 27/18723 | 6.88e-04 | 3.61e-03 | 21 |
| GO:00344702 | Liver | HCC | ncRNA processing | 293/7958 | 395/18723 | 4.26e-38 | 6.76e-35 | 293 |
| GO:00346601 | Liver | HCC | ncRNA metabolic process | 332/7958 | 485/18723 | 1.48e-31 | 7.80e-29 | 332 |
| GO:0008033 | Liver | HCC | tRNA processing | 87/7958 | 127/18723 | 2.66e-09 | 7.23e-08 | 87 |
| GO:00434141 | Liver | HCC | macromolecule methylation | 183/7958 | 316/18723 | 2.00e-08 | 4.72e-07 | 183 |
| GO:0032259 | Liver | HCC | methylation | 206/7958 | 364/18723 | 3.35e-08 | 7.53e-07 | 206 |
| GO:0006399 | Liver | HCC | tRNA metabolic process | 108/7958 | 179/18723 | 1.07e-06 | 1.59e-05 | 108 |
| GO:0009451 | Liver | HCC | RNA modification | 101/7958 | 167/18723 | 2.02e-06 | 2.78e-05 | 101 |
| GO:0006400 | Liver | HCC | tRNA modification | 60/7958 | 90/18723 | 3.09e-06 | 4.09e-05 | 60 |
| Page: 1 2 3 |
| Pathway ID | Tissue | Disease Stage | Description | Gene Ratio | Bg Ratio | pvalue | p.adjust | qvalue | Count |
| Page: 1 |
Top |
Cell-cell communication analysis |
| Identification of potential cell-cell interactions between two cell types and their ligand-receptor pairs for different disease states |
| Ligand | Receptor | LRpair | Pathway | Tissue | Disease Stage |
| Page: 1 |
Top |
Single-cell gene regulatory network inference analysis |
| Find out the significant the regulons (TFs) and the target genes of each regulon across cell types for different disease states |
| TF | Cell Type | Tissue | Disease Stage | Target Gene | RSS | Regulon Activity |
| ∗The dot plots of a searched regulon are shown for all cell subpopulations in each disease state of each tissue based on the regulon specific score inferred using pySCENIC and by calculating the average expression. |
| Page: 1 |
Top |
Somatic mutation of malignant transformation related genes |
| Annotation of somatic variants for genes involved in malignant transformation |
| Hugo Symbol | Variant Class | Variant Classification | dbSNP RS | HGVSc | HGVSp | HGVSp Short | SWISSPROT | BIOTYPE | SIFT | PolyPhen | Tumor Sample Barcode | Tissue | Histology | Sex | Age | Stage | Therapy Types | Drugs | Outcome |
| METTL8 | SNV | Missense_Mutation | c.378N>T | p.Arg126Ser | p.R126S | protein_coding | tolerated(0.61) | benign(0) | TCGA-A8-A07R-01 | Breast | breast invasive carcinoma | Female | >=65 | III/IV | Ancillary | zoledronic | SD | ||
| METTL8 | SNV | Missense_Mutation | c.286N>G | p.His96Asp | p.H96D | protein_coding | deleterious(0) | possibly_damaging(0.776) | TCGA-BH-A0HP-01 | Breast | breast invasive carcinoma | Female | >=65 | III/IV | Chemotherapy | doxorubicin | SD | ||
| METTL8 | SNV | Missense_Mutation | novel | c.794C>A | p.Pro265His | p.P265H | protein_coding | deleterious(0) | possibly_damaging(0.684) | TCGA-2W-A8YY-01 | Cervix | cervical & endocervical cancer | Female | <65 | I/II | Chemotherapy | cisplatin | CR | |
| METTL8 | SNV | Missense_Mutation | novel | c.409G>A | p.Ala137Thr | p.A137T | protein_coding | tolerated(0.48) | benign(0) | TCGA-2W-A8YY-01 | Cervix | cervical & endocervical cancer | Female | <65 | I/II | Chemotherapy | cisplatin | CR | |
| METTL8 | SNV | Missense_Mutation | novel | c.307N>C | p.Asp103His | p.D103H | protein_coding | deleterious(0) | probably_damaging(0.939) | TCGA-C5-A3HF-01 | Cervix | cervical & endocervical cancer | Female | <65 | I/II | Unknown | Unknown | PD | |
| METTL8 | SNV | Missense_Mutation | c.145N>C | p.Asp49His | p.D49H | protein_coding | deleterious(0) | probably_damaging(1) | TCGA-EK-A2H1-01 | Cervix | cervical & endocervical cancer | Female | <65 | I/II | Chemotherapy | cetuximab | SD | ||
| METTL8 | SNV | Missense_Mutation | c.7N>G | p.Met3Val | p.M3V | protein_coding | tolerated_low_confidence(1) | benign(0) | TCGA-A6-6781-01 | Colorectum | colon adenocarcinoma | Male | <65 | III/IV | Chemotherapy | oxaliplatin | SD | ||
| METTL8 | SNV | Missense_Mutation | c.269A>G | p.Asp90Gly | p.D90G | protein_coding | deleterious(0.03) | benign(0.301) | TCGA-AA-3710-01 | Colorectum | colon adenocarcinoma | Female | >=65 | I/II | Unknown | Unknown | SD | ||
| METTL8 | SNV | Missense_Mutation | novel | c.704C>T | p.Ala235Val | p.A235V | protein_coding | deleterious(0) | probably_damaging(1) | TCGA-AA-3977-01 | Colorectum | colon adenocarcinoma | Male | >=65 | I/II | Unknown | Unknown | SD | |
| METTL8 | SNV | Missense_Mutation | c.286C>A | p.His96Asn | p.H96N | protein_coding | deleterious(0) | benign(0.173) | TCGA-AA-A00N-01 | Colorectum | colon adenocarcinoma | Male | >=65 | I/II | Unknown | Unknown | PD |
| Page: 1 2 3 4 |
Top |
Related drugs of malignant transformation related genes |
| Identification of chemicals and drugs interact with genes involved in malignant transfromation |
| (DGIdb 4.0) |
| Entrez ID | Symbol | Category | Interaction Types | Drug Claim Name | Drug Name | PMIDs |
| Page: 1 |

Copyright 2023-Present -The University of Texas Health Science Center at Houston |