
|
|||||
|
 | |
| |
| |
| |
| |
| |
|
Gene: METTL7B |
Gene summary for METTL7B |
| Gene information | Species | Human | Gene symbol | METTL7B | Gene ID | 196410 |
| Gene name | methyltransferase like 7B | |
| Gene Alias | ALDI | |
| Cytomap | 12q13.2 | |
| Gene Type | protein-coding | GO ID | GO:0008150 | UniProtAcc | Q6UX53 |
Top |
Malignant transformation analysis |
| Identification of the aberrant gene expression in precancerous and cancerous lesions by comparing the gene expression of stem-like cells in diseased tissues with normal stem cells |
| Entrez ID | Symbol | Replicates | Species | Organ | Tissue | Adj P-value | Log2FC | Malignancy |
| 196410 | METTL7B | HCC1_Meng | Human | Liver | HCC | 1.27e-62 | 3.42e-01 | 0.0246 |
| 196410 | METTL7B | HCC2_Meng | Human | Liver | HCC | 2.21e-03 | 1.99e-02 | 0.0107 |
| 196410 | METTL7B | HCC1 | Human | Liver | HCC | 1.55e-03 | 3.14e+00 | 0.5336 |
| 196410 | METTL7B | HCC2 | Human | Liver | HCC | 1.90e-10 | 2.92e+00 | 0.5341 |
| 196410 | METTL7B | S014 | Human | Liver | HCC | 6.65e-14 | 6.76e-01 | 0.2254 |
| 196410 | METTL7B | S015 | Human | Liver | HCC | 5.01e-25 | 1.34e+00 | 0.2375 |
| 196410 | METTL7B | S016 | Human | Liver | HCC | 1.44e-20 | 9.67e-01 | 0.2243 |
| 196410 | METTL7B | S027 | Human | Liver | HCC | 8.70e-09 | 1.11e+00 | 0.2446 |
| 196410 | METTL7B | S028 | Human | Liver | HCC | 1.84e-23 | 1.07e+00 | 0.2503 |
| 196410 | METTL7B | S029 | Human | Liver | HCC | 4.76e-27 | 1.41e+00 | 0.2581 |
| 196410 | METTL7B | male-WTA | Human | Thyroid | PTC | 2.58e-22 | 3.12e-01 | 0.1037 |
| 196410 | METTL7B | PTC01 | Human | Thyroid | PTC | 2.57e-31 | 6.23e-01 | 0.1899 |
| 196410 | METTL7B | PTC04 | Human | Thyroid | PTC | 3.36e-11 | 3.59e-01 | 0.1927 |
| 196410 | METTL7B | PTC05 | Human | Thyroid | PTC | 2.27e-12 | 5.46e-01 | 0.2065 |
| 196410 | METTL7B | PTC06 | Human | Thyroid | PTC | 7.37e-28 | 6.44e-01 | 0.2057 |
| 196410 | METTL7B | PTC07 | Human | Thyroid | PTC | 8.75e-26 | 4.22e-01 | 0.2044 |
| Page: 1 |
| Tissue | Expression Dynamics | Abbreviation |
| Liver | 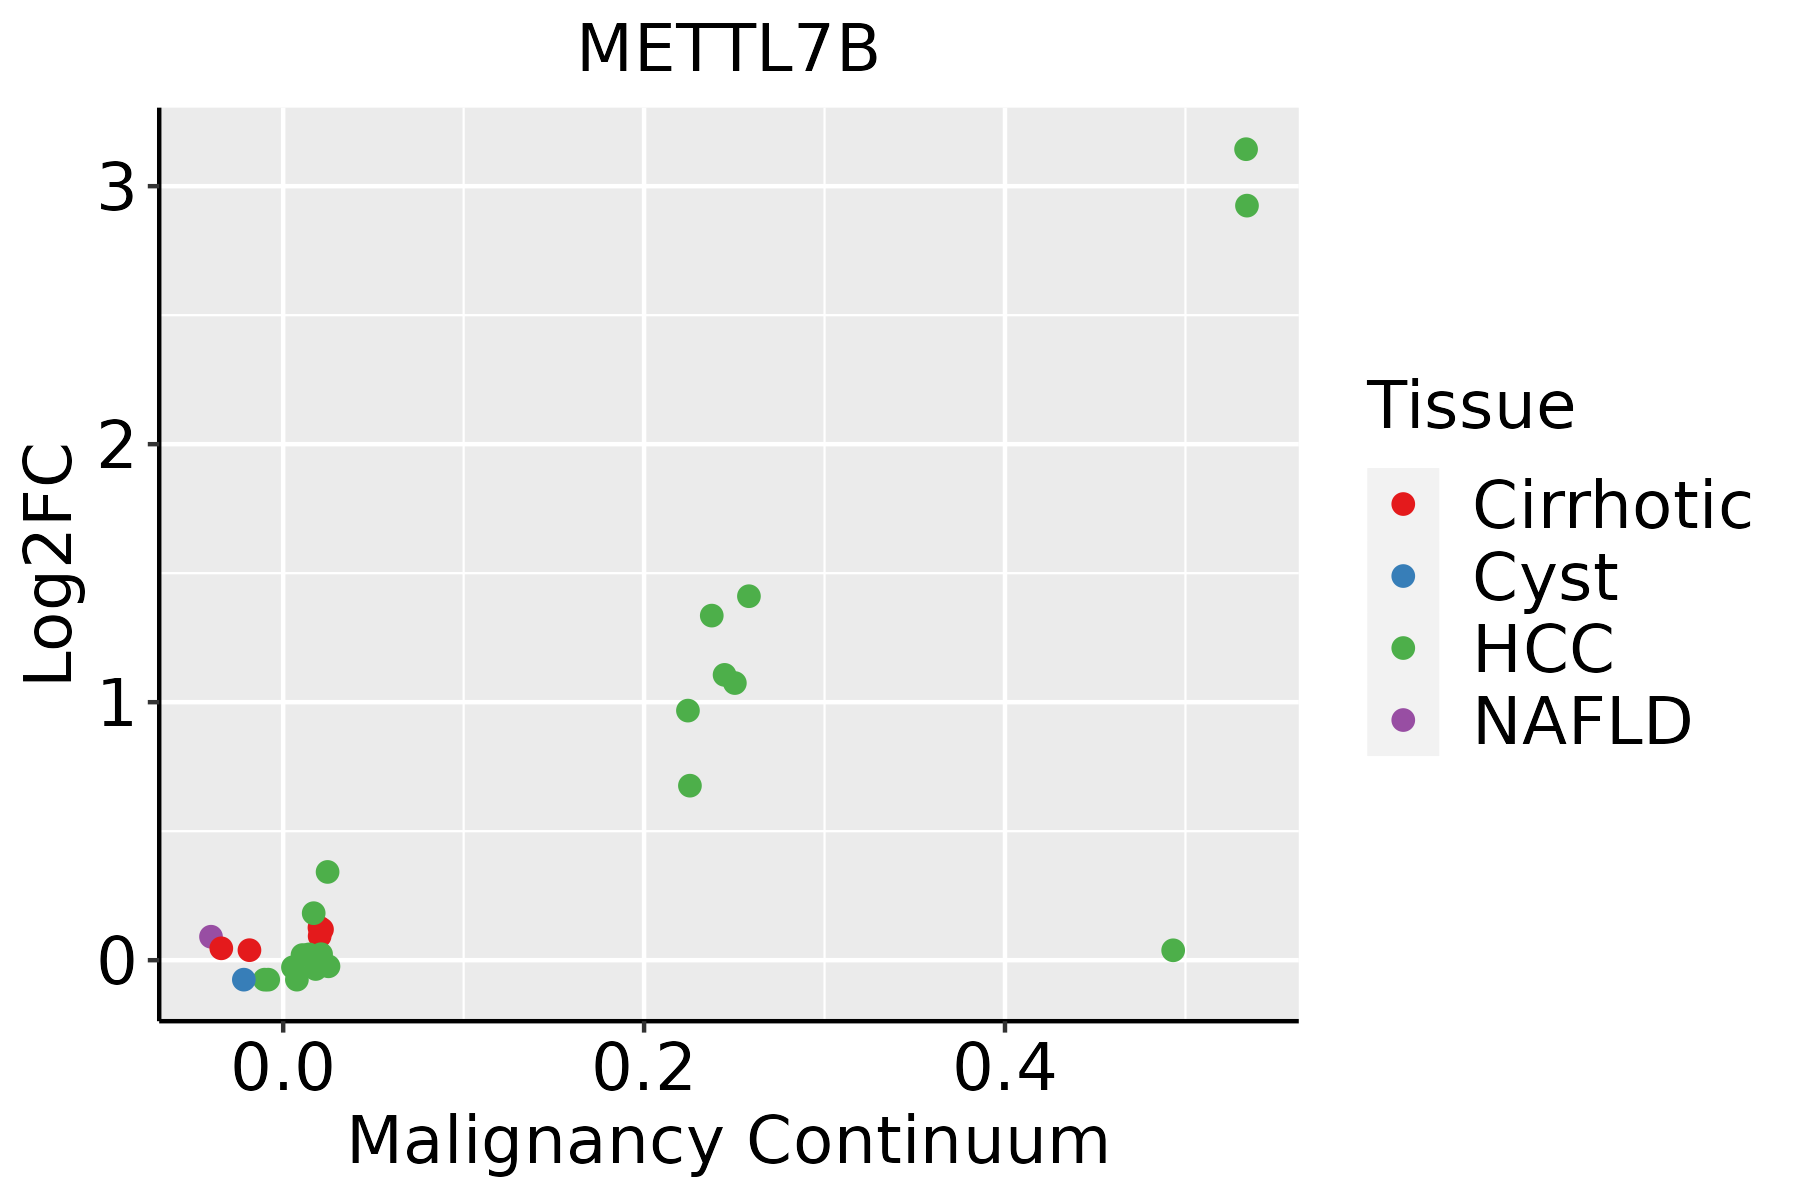 | HCC: Hepatocellular carcinoma |
| NAFLD: Non-alcoholic fatty liver disease | ||
| Thyroid | 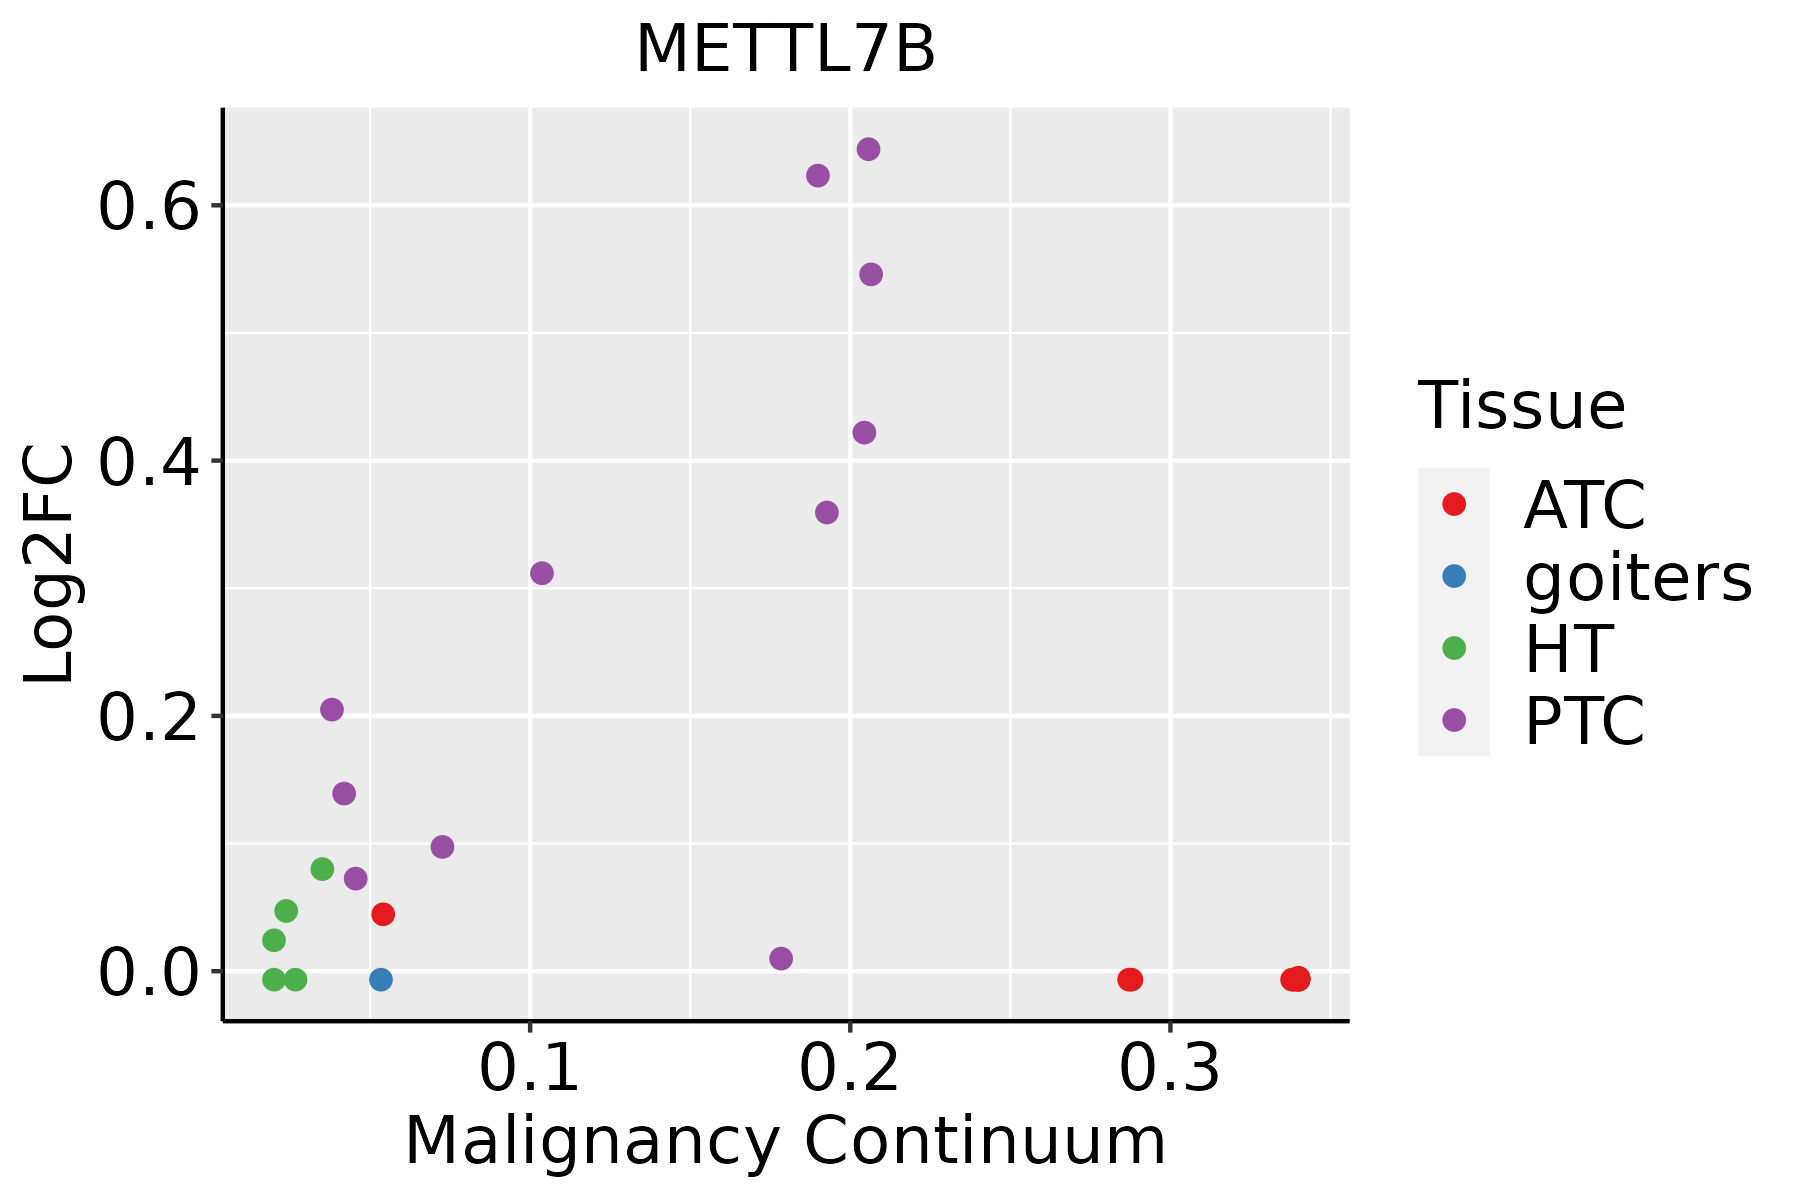 | ATC: Anaplastic thyroid cancer |
| HT: Hashimoto's thyroiditis | ||
| PTC: Papillary thyroid cancer |
| ∗log2FC in expression of this searched gene in stem-like cells from each diseased tissue sample relative to stem-like cells in normal samples in each tissue plotted against the malignancy continuum. Samples are colored based on if they are from different disease stage. |
Top |
Malignant transformation related pathway analysis |
| Find out the enriched GO biological processes and KEGG pathways involved in transition from healthy to precancer to cancer |
| Tissue | Disease Stage | Enriched GO biological Processes |
| Colorectum | AD |  |
| Colorectum | SER |  |
| Colorectum | MSS |  |
| Colorectum | MSI-H |  |
| Colorectum | FAP |  |
| ∗Top 15 enriched GO BP terms are showed in the bar plot of each disease state in each tissue. Each row represents a significant GO biological process which is colored according to the -log10(p.adjust). |
| Page: 1 2 3 4 5 6 7 8 9 |
| GO ID | Tissue | Disease Stage | Description | Gene Ratio | Bg Ratio | pvalue | p.adjust | Count |
| GO:0032259 | Liver | HCC | methylation | 206/7958 | 364/18723 | 3.35e-08 | 7.53e-07 | 206 |
| GO:00322594 | Thyroid | PTC | methylation | 146/5968 | 364/18723 | 4.99e-04 | 3.26e-03 | 146 |
| Page: 1 |
| Pathway ID | Tissue | Disease Stage | Description | Gene Ratio | Bg Ratio | pvalue | p.adjust | qvalue | Count |
| Page: 1 |
Top |
Cell-cell communication analysis |
| Identification of potential cell-cell interactions between two cell types and their ligand-receptor pairs for different disease states |
| Ligand | Receptor | LRpair | Pathway | Tissue | Disease Stage |
| Page: 1 |
Top |
Single-cell gene regulatory network inference analysis |
| Find out the significant the regulons (TFs) and the target genes of each regulon across cell types for different disease states |
| TF | Cell Type | Tissue | Disease Stage | Target Gene | RSS | Regulon Activity |
| ∗The dot plots of a searched regulon are shown for all cell subpopulations in each disease state of each tissue based on the regulon specific score inferred using pySCENIC and by calculating the average expression. |
| Page: 1 |
Top |
Somatic mutation of malignant transformation related genes |
| Annotation of somatic variants for genes involved in malignant transformation |
| Hugo Symbol | Variant Class | Variant Classification | dbSNP RS | HGVSc | HGVSp | HGVSp Short | SWISSPROT | BIOTYPE | SIFT | PolyPhen | Tumor Sample Barcode | Tissue | Histology | Sex | Age | Stage | Therapy Types | Drugs | Outcome |
| METTL7B | SNV | Missense_Mutation | c.497N>A | p.Pro166Gln | p.P166Q | Q6UX53 | protein_coding | deleterious(0.03) | probably_damaging(0.982) | TCGA-A2-A0SW-01 | Breast | breast invasive carcinoma | Female | >=65 | III/IV | Hormone Therapy | arimidex | PD | |
| METTL7B | SNV | Missense_Mutation | rs769045151 | c.245N>A | p.Gly82Glu | p.G82E | Q6UX53 | protein_coding | deleterious(0.01) | probably_damaging(0.999) | TCGA-B6-A0IK-01 | Breast | breast invasive carcinoma | Female | <65 | III/IV | Unknown | Unknown | PD |
| METTL7B | SNV | Missense_Mutation | rs776219569 | c.655N>A | p.Glu219Lys | p.E219K | Q6UX53 | protein_coding | tolerated(0.37) | benign(0.011) | TCGA-AA-3697-01 | Colorectum | colon adenocarcinoma | Male | >=65 | I/II | Unknown | Unknown | SD |
| METTL7B | SNV | Missense_Mutation | rs776219569 | c.655N>A | p.Glu219Lys | p.E219K | Q6UX53 | protein_coding | tolerated(0.37) | benign(0.011) | TCGA-AA-3984-01 | Colorectum | colon adenocarcinoma | Female | <65 | I/II | Unknown | Unknown | SD |
| METTL7B | SNV | Missense_Mutation | c.208G>A | p.Gly70Arg | p.G70R | Q6UX53 | protein_coding | tolerated(0.08) | benign(0.226) | TCGA-AZ-6599-01 | Colorectum | colon adenocarcinoma | Male | >=65 | I/II | Unknown | Unknown | SD | |
| METTL7B | SNV | Missense_Mutation | c.676C>A | p.Pro226Thr | p.P226T | Q6UX53 | protein_coding | tolerated(0.45) | benign(0.05) | TCGA-F4-6856-01 | Colorectum | colon adenocarcinoma | Male | <65 | I/II | Ancillary | leucovorin | CR | |
| METTL7B | SNV | Missense_Mutation | novel | c.121N>A | p.Ala41Thr | p.A41T | Q6UX53 | protein_coding | tolerated(0.6) | benign(0.065) | TCGA-WS-AB45-01 | Colorectum | colon adenocarcinoma | Female | <65 | I/II | Unknown | Unknown | SD |
| METTL7B | SNV | Missense_Mutation | c.731N>C | p.Lys244Thr | p.K244T | Q6UX53 | protein_coding | deleterious(0) | probably_damaging(0.985) | TCGA-AG-A002-01 | Colorectum | rectum adenocarcinoma | Male | <65 | I/II | Unknown | Unknown | SD | |
| METTL7B | SNV | Missense_Mutation | novel | c.698N>T | p.Pro233Leu | p.P233L | Q6UX53 | protein_coding | tolerated(1) | benign(0.038) | TCGA-A5-A0G1-01 | Endometrium | uterine corpus endometrioid carcinoma | Female | >=65 | I/II | Unknown | Unknown | SD |
| METTL7B | SNV | Missense_Mutation | novel | c.482G>A | p.Arg161Gln | p.R161Q | Q6UX53 | protein_coding | tolerated(0.36) | benign(0.025) | TCGA-A5-A0G2-01 | Endometrium | uterine corpus endometrioid carcinoma | Female | <65 | III/IV | Unknown | Unknown | SD |
| Page: 1 2 3 |
Top |
Related drugs of malignant transformation related genes |
| Identification of chemicals and drugs interact with genes involved in malignant transfromation |
| (DGIdb 4.0) |
| Entrez ID | Symbol | Category | Interaction Types | Drug Claim Name | Drug Name | PMIDs |
| Page: 1 |

Copyright 2023-Present -The University of Texas Health Science Center at Houston |