
|
|||||
|
 | |
| |
| |
| |
| |
| |
|
Gene: METTL7A |
Gene summary for METTL7A |
| Gene information | Species | Human | Gene symbol | METTL7A | Gene ID | 25840 |
| Gene name | methyltransferase like 7A | |
| Gene Alias | AAM-B | |
| Cytomap | 12q13.12 | |
| Gene Type | protein-coding | GO ID | GO:0008150 | UniProtAcc | A0A024R118 |
Top |
Malignant transformation analysis |
| Identification of the aberrant gene expression in precancerous and cancerous lesions by comparing the gene expression of stem-like cells in diseased tissues with normal stem cells |
| Entrez ID | Symbol | Replicates | Species | Organ | Tissue | Adj P-value | Log2FC | Malignancy |
| 25840 | METTL7A | HTA11_3410_2000001011 | Human | Colorectum | AD | 1.95e-05 | 1.16e-01 | 0.0155 |
| 25840 | METTL7A | HTA11_1938_2000001011 | Human | Colorectum | AD | 7.09e-03 | 3.68e-01 | -0.0811 |
| 25840 | METTL7A | HTA11_78_2000001011 | Human | Colorectum | AD | 1.10e-05 | 5.89e-01 | -0.1088 |
| 25840 | METTL7A | HTA11_347_2000001011 | Human | Colorectum | AD | 1.26e-40 | 1.05e+00 | -0.1954 |
| 25840 | METTL7A | HTA11_83_2000001011 | Human | Colorectum | SER | 1.92e-06 | 3.88e-01 | -0.1526 |
| 25840 | METTL7A | HTA11_696_2000001011 | Human | Colorectum | AD | 1.26e-07 | 3.94e-01 | -0.1464 |
| 25840 | METTL7A | HTA11_866_2000001011 | Human | Colorectum | AD | 9.51e-03 | 2.99e-01 | -0.1001 |
| 25840 | METTL7A | HTA11_1391_2000001011 | Human | Colorectum | AD | 1.02e-05 | 3.96e-01 | -0.059 |
| 25840 | METTL7A | HTA11_5212_2000001011 | Human | Colorectum | AD | 6.39e-04 | 5.76e-01 | -0.2061 |
| 25840 | METTL7A | HTA11_7862_2000001011 | Human | Colorectum | AD | 6.92e-10 | 5.47e-01 | -0.0179 |
| 25840 | METTL7A | HTA11_10623_2000001011 | Human | Colorectum | AD | 4.47e-04 | 3.46e-01 | -0.0177 |
| 25840 | METTL7A | HTA11_6801_2000001011 | Human | Colorectum | SER | 4.76e-05 | 6.16e-01 | 0.0171 |
| 25840 | METTL7A | LZE4T | Human | Esophagus | ESCC | 1.42e-05 | -4.49e-01 | 0.0811 |
| 25840 | METTL7A | LZE5T | Human | Esophagus | ESCC | 2.11e-04 | 3.02e-01 | 0.0514 |
| 25840 | METTL7A | LZE8T | Human | Esophagus | ESCC | 1.02e-03 | -4.91e-01 | 0.067 |
| 25840 | METTL7A | LZE20T | Human | Esophagus | ESCC | 3.98e-05 | -3.96e-01 | 0.0662 |
| 25840 | METTL7A | LZE22D1 | Human | Esophagus | HGIN | 4.94e-02 | -4.32e-01 | 0.0595 |
| 25840 | METTL7A | P1T-E | Human | Esophagus | ESCC | 1.36e-06 | -2.93e-01 | 0.0875 |
| 25840 | METTL7A | P2T-E | Human | Esophagus | ESCC | 3.04e-17 | -1.91e-02 | 0.1177 |
| 25840 | METTL7A | P5T-E | Human | Esophagus | ESCC | 2.89e-07 | -4.22e-01 | 0.1327 |
| Page: 1 2 3 4 5 6 7 |
| Tissue | Expression Dynamics | Abbreviation |
| Colorectum (GSE201348) |  | FAP: Familial adenomatous polyposis |
| CRC: Colorectal cancer | ||
| Colorectum (HTA11) |  | AD: Adenomas |
| SER: Sessile serrated lesions | ||
| MSI-H: Microsatellite-high colorectal cancer | ||
| MSS: Microsatellite stable colorectal cancer | ||
| Esophagus | 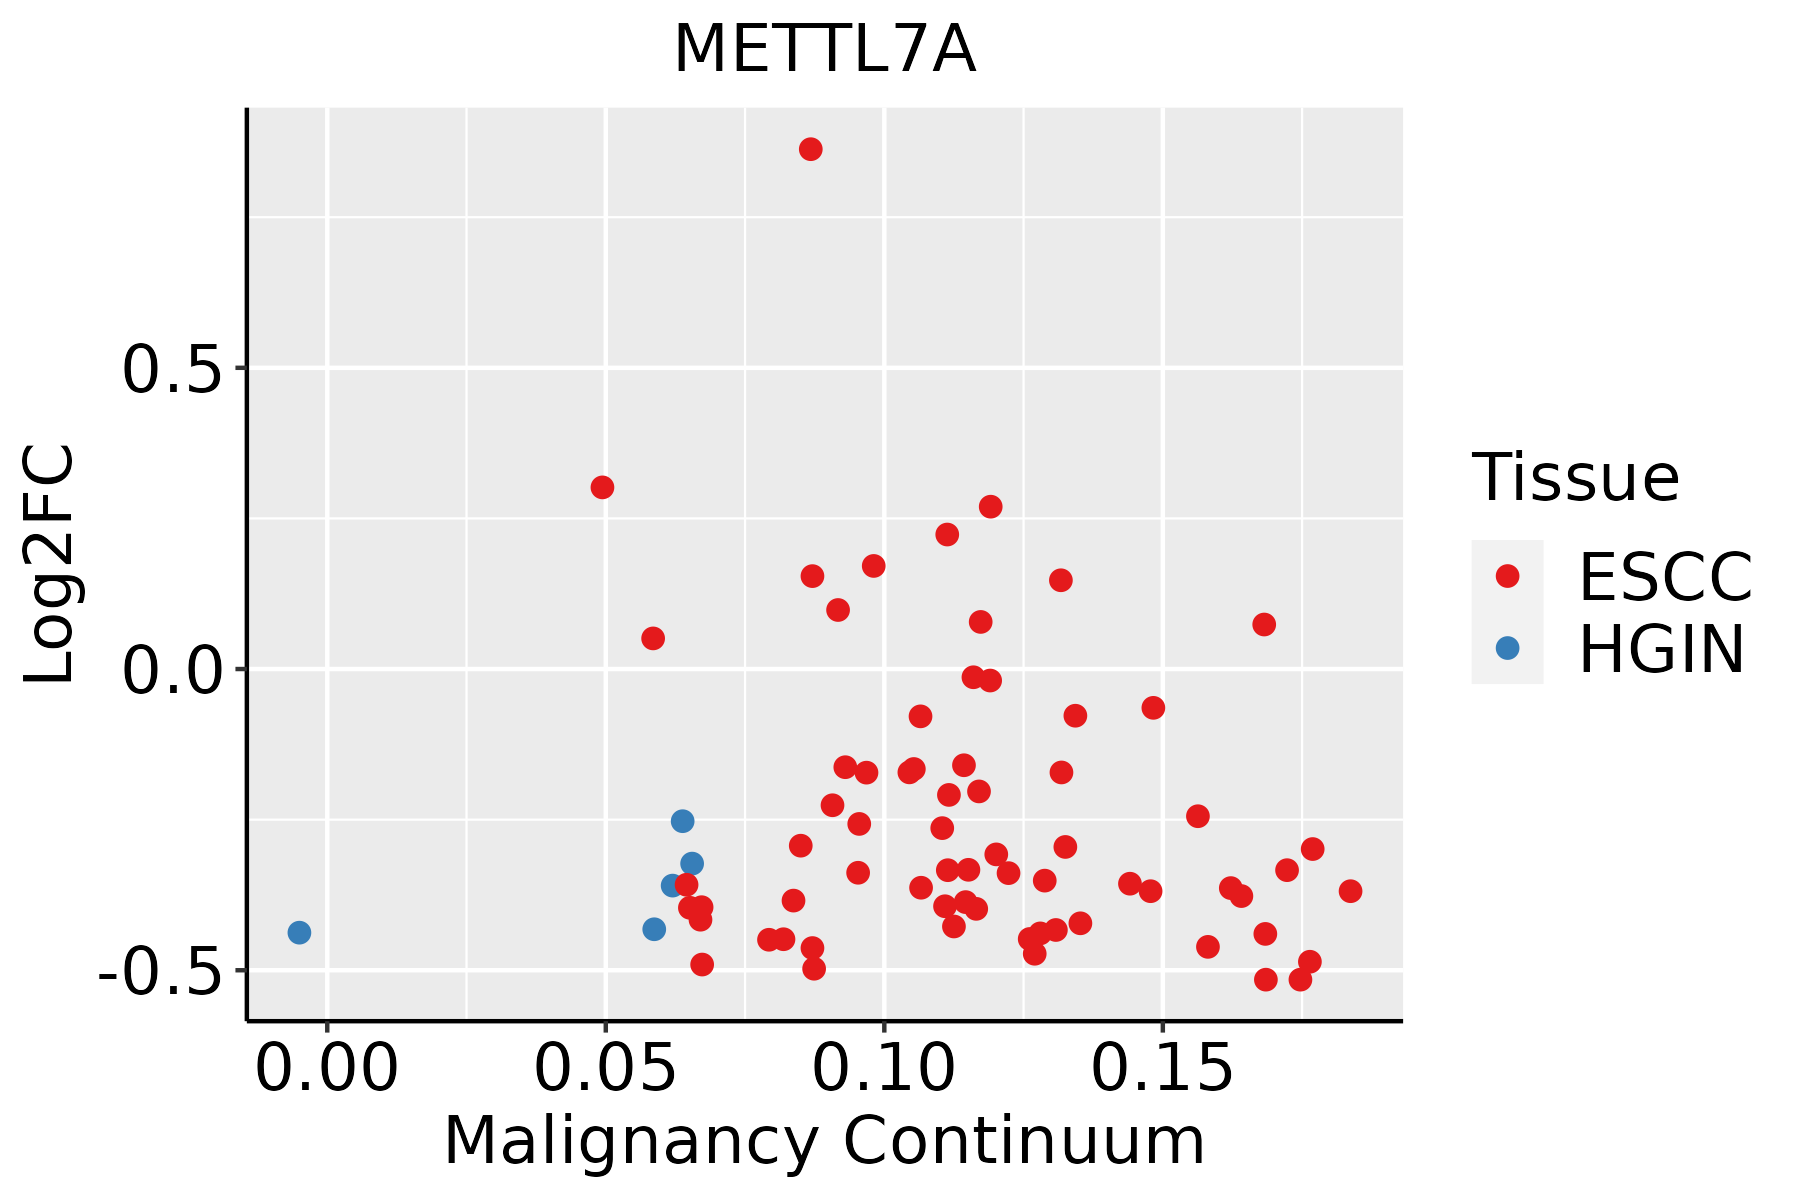 | ESCC: Esophageal squamous cell carcinoma |
| HGIN: High-grade intraepithelial neoplasias | ||
| LGIN: Low-grade intraepithelial neoplasias | ||
| Liver | 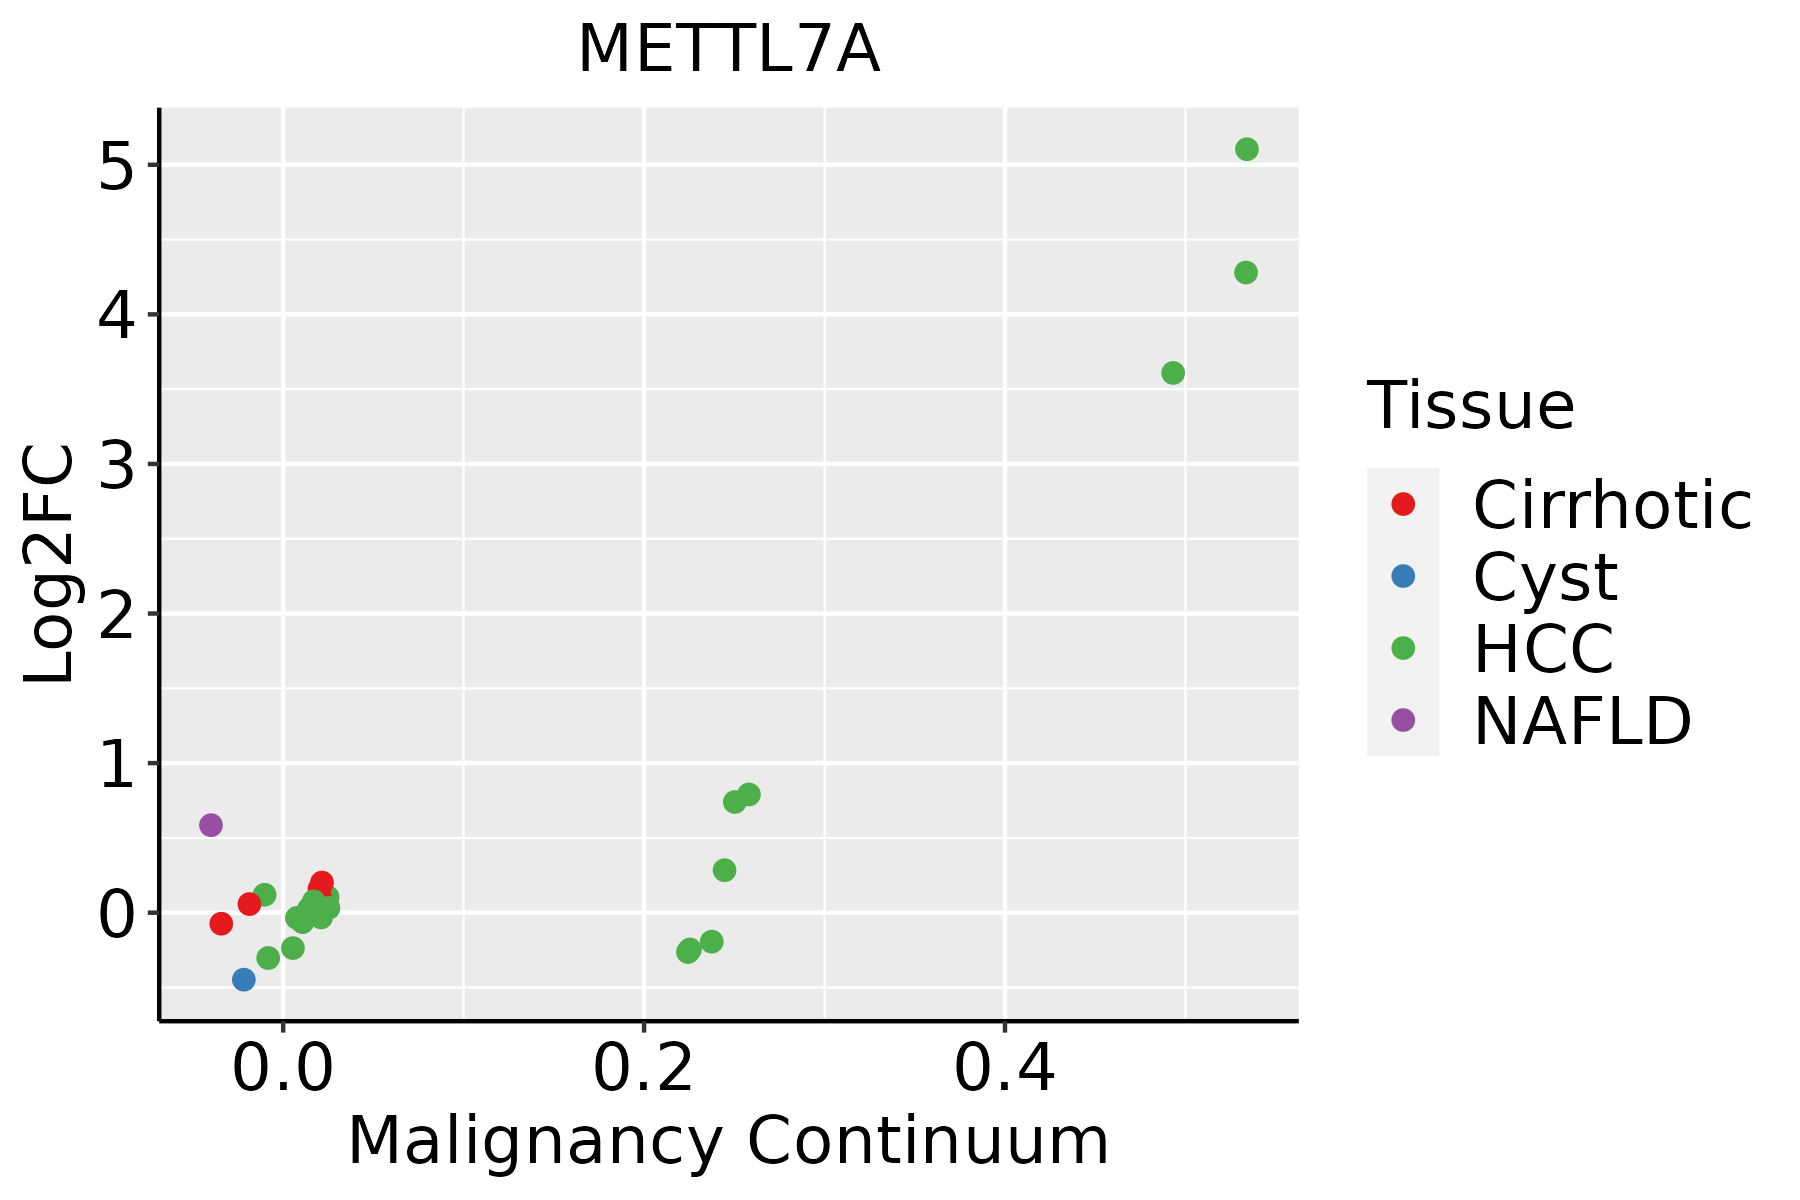 | HCC: Hepatocellular carcinoma |
| NAFLD: Non-alcoholic fatty liver disease | ||
| Oral Cavity | 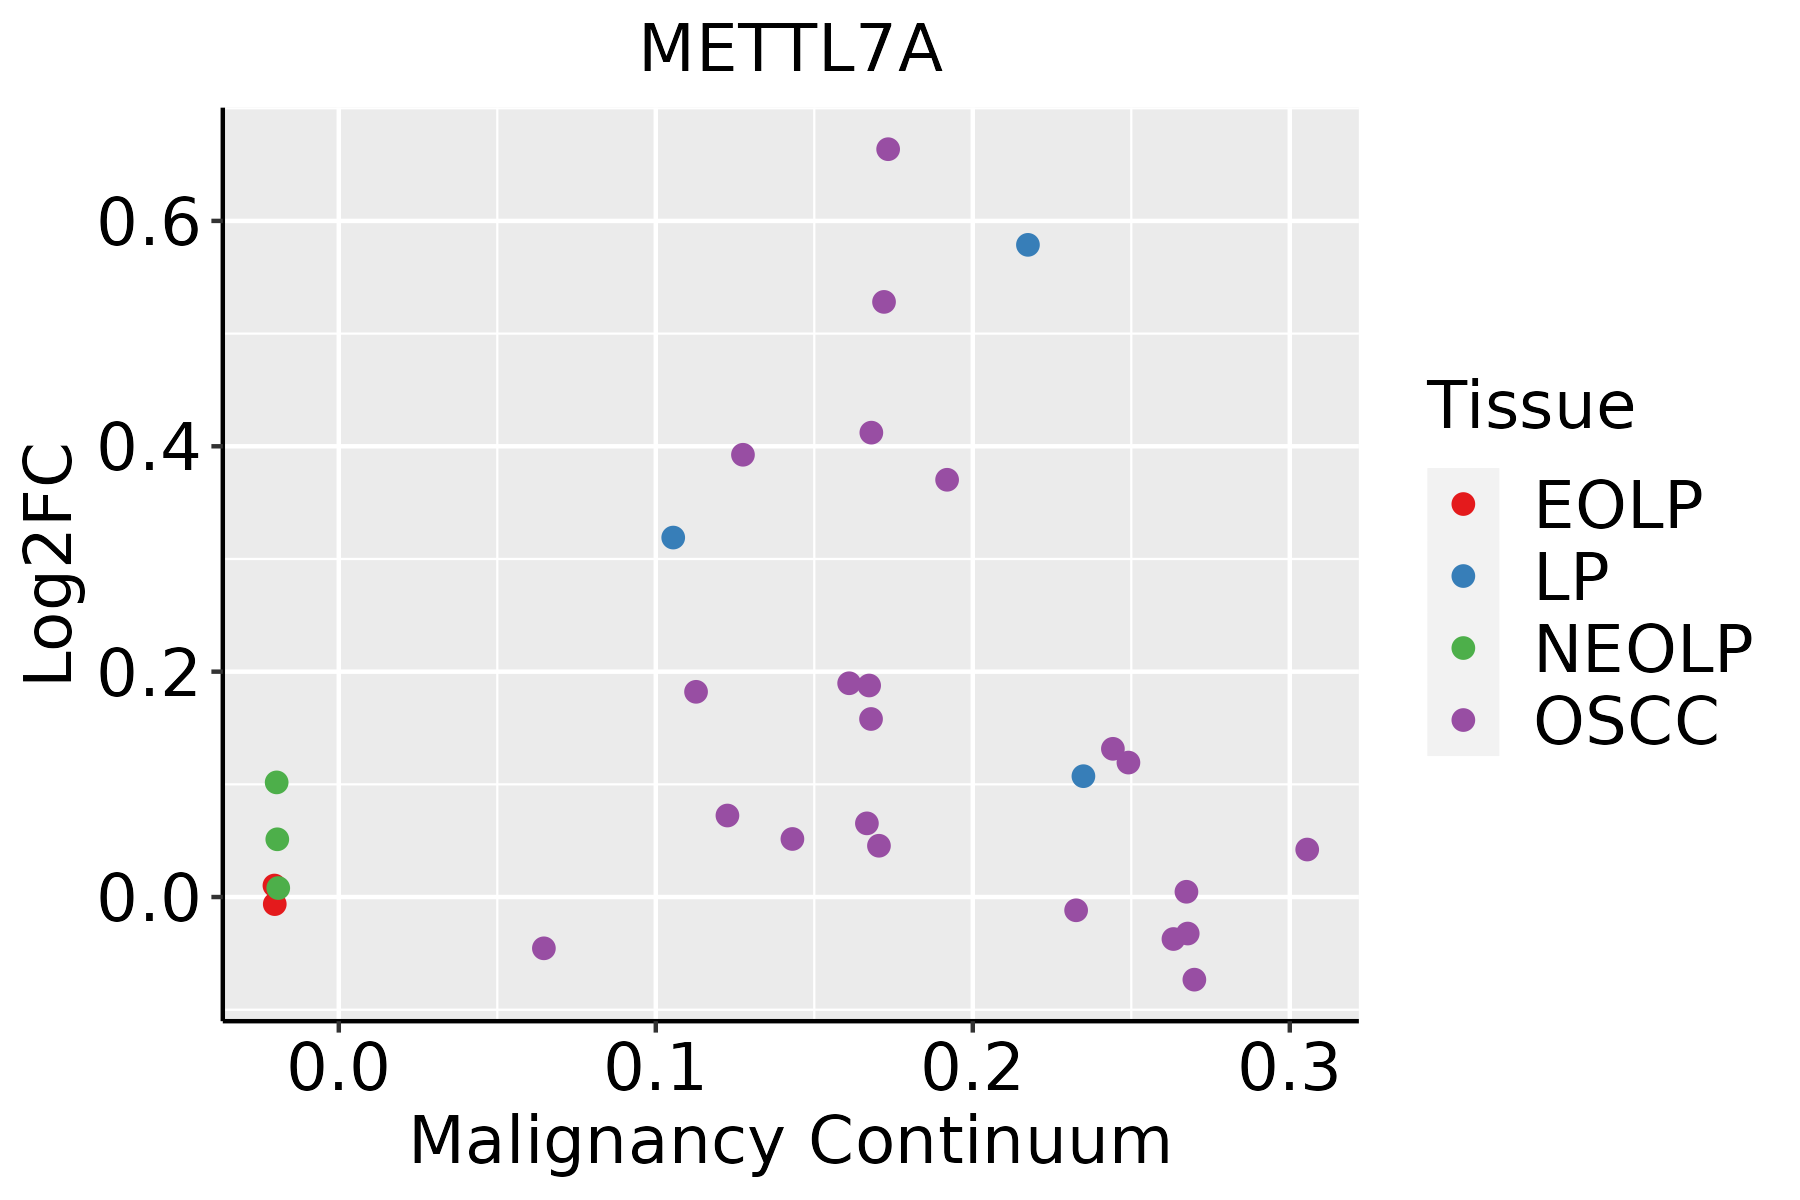 | EOLP: Erosive Oral lichen planus |
| LP: leukoplakia | ||
| NEOLP: Non-erosive oral lichen planus | ||
| OSCC: Oral squamous cell carcinoma | ||
| Prostate |  | BPH: Benign Prostatic Hyperplasia |
| Thyroid | 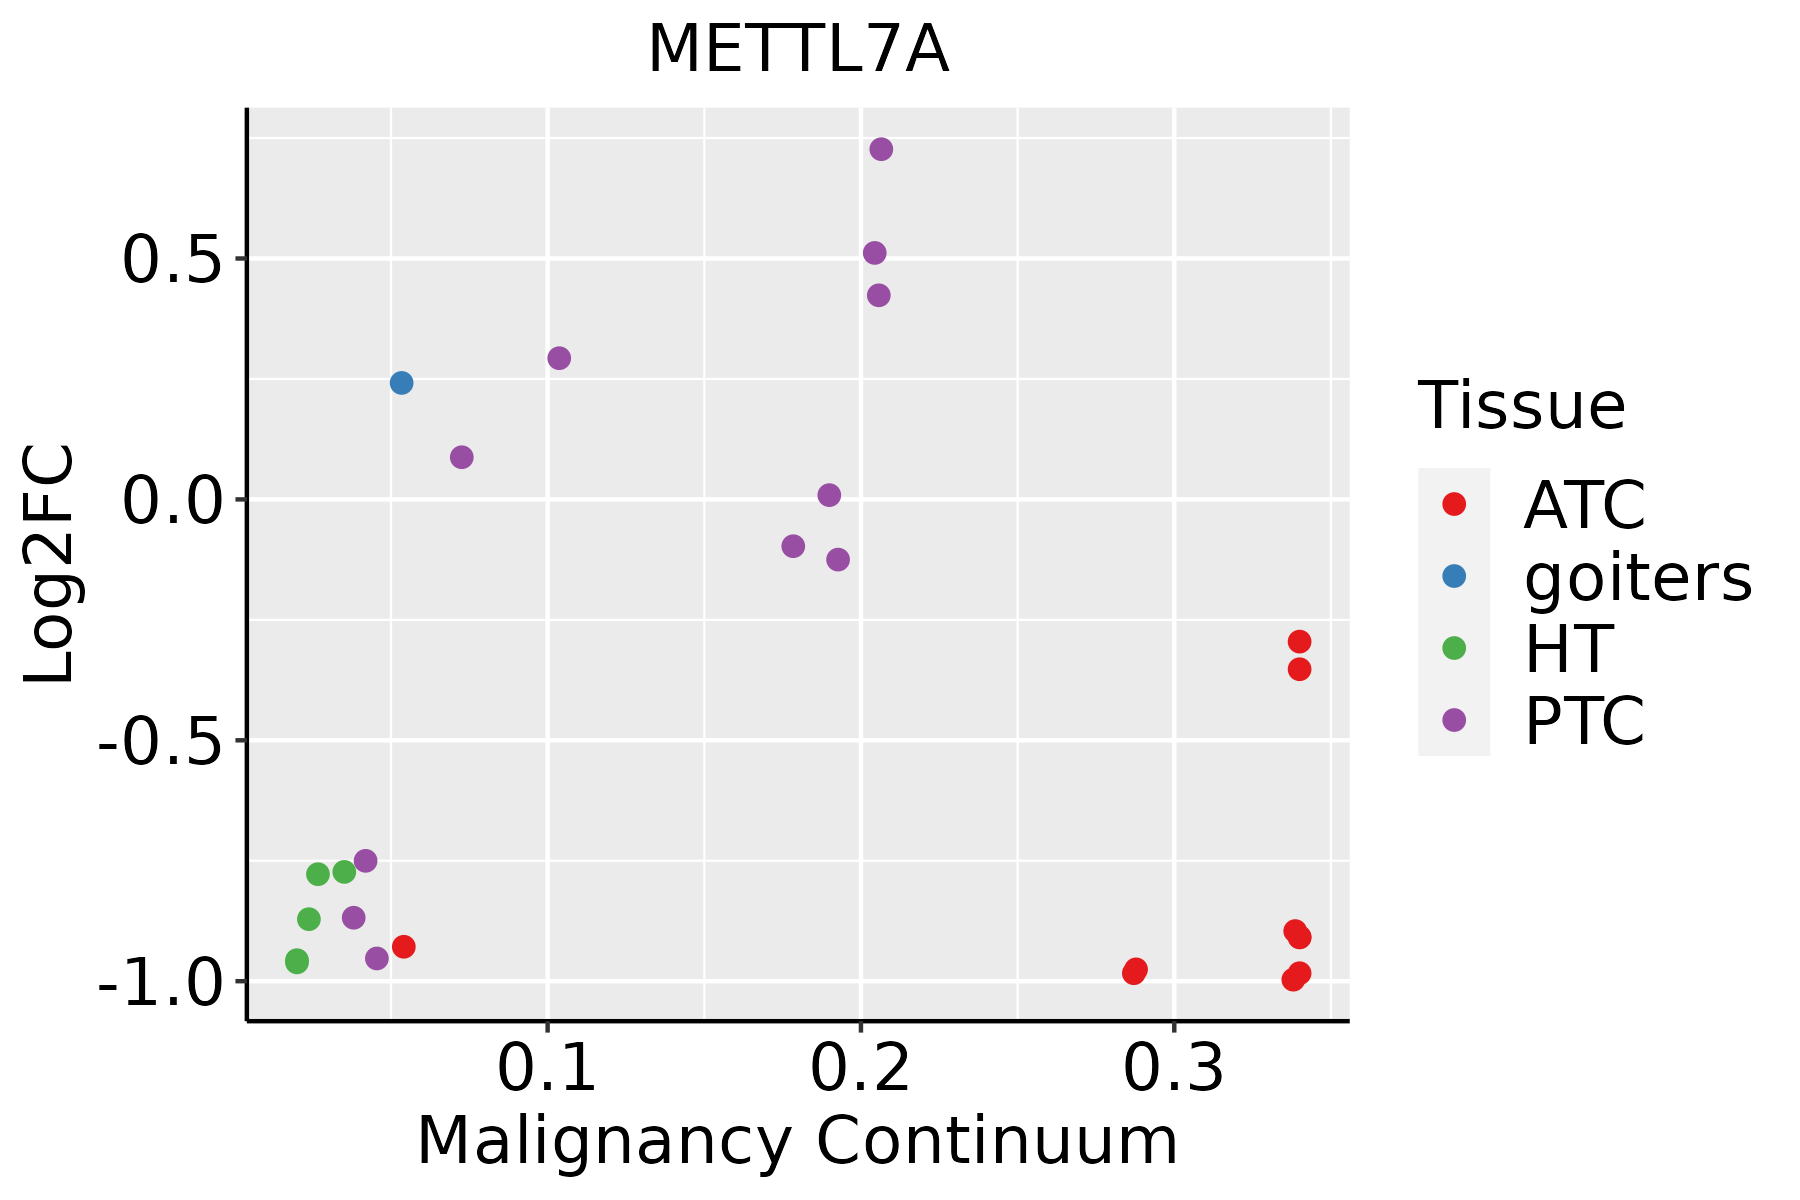 | ATC: Anaplastic thyroid cancer |
| HT: Hashimoto's thyroiditis | ||
| PTC: Papillary thyroid cancer |
| ∗log2FC in expression of this searched gene in stem-like cells from each diseased tissue sample relative to stem-like cells in normal samples in each tissue plotted against the malignancy continuum. Samples are colored based on if they are from different disease stage. |
Top |
Malignant transformation related pathway analysis |
| Find out the enriched GO biological processes and KEGG pathways involved in transition from healthy to precancer to cancer |
| Tissue | Disease Stage | Enriched GO biological Processes |
| Colorectum | AD |  |
| Colorectum | SER |  |
| Colorectum | MSS |  |
| Colorectum | MSI-H |  |
| Colorectum | FAP |  |
| ∗Top 15 enriched GO BP terms are showed in the bar plot of each disease state in each tissue. Each row represents a significant GO biological process which is colored according to the -log10(p.adjust). |
| Page: 1 2 3 4 5 6 7 8 9 |
| GO ID | Tissue | Disease Stage | Description | Gene Ratio | Bg Ratio | pvalue | p.adjust | Count |
| GO:00322592 | Esophagus | ESCC | methylation | 222/8552 | 364/18723 | 2.26e-09 | 5.09e-08 | 222 |
| GO:0032259 | Liver | HCC | methylation | 206/7958 | 364/18723 | 3.35e-08 | 7.53e-07 | 206 |
| GO:00322591 | Oral cavity | OSCC | methylation | 168/7305 | 364/18723 | 3.03e-03 | 1.31e-02 | 168 |
| GO:00322594 | Thyroid | PTC | methylation | 146/5968 | 364/18723 | 4.99e-04 | 3.26e-03 | 146 |
| GO:003225911 | Thyroid | ATC | methylation | 148/6293 | 364/18723 | 2.69e-03 | 1.23e-02 | 148 |
| Page: 1 |
| Pathway ID | Tissue | Disease Stage | Description | Gene Ratio | Bg Ratio | pvalue | p.adjust | qvalue | Count |
| Page: 1 |
Top |
Cell-cell communication analysis |
| Identification of potential cell-cell interactions between two cell types and their ligand-receptor pairs for different disease states |
| Ligand | Receptor | LRpair | Pathway | Tissue | Disease Stage |
| Page: 1 |
Top |
Single-cell gene regulatory network inference analysis |
| Find out the significant the regulons (TFs) and the target genes of each regulon across cell types for different disease states |
| TF | Cell Type | Tissue | Disease Stage | Target Gene | RSS | Regulon Activity |
| ∗The dot plots of a searched regulon are shown for all cell subpopulations in each disease state of each tissue based on the regulon specific score inferred using pySCENIC and by calculating the average expression. |
| Page: 1 |
Top |
Somatic mutation of malignant transformation related genes |
| Annotation of somatic variants for genes involved in malignant transformation |
| Hugo Symbol | Variant Class | Variant Classification | dbSNP RS | HGVSc | HGVSp | HGVSp Short | SWISSPROT | BIOTYPE | SIFT | PolyPhen | Tumor Sample Barcode | Tissue | Histology | Sex | Age | Stage | Therapy Types | Drugs | Outcome |
| METTL7A | SNV | Missense_Mutation | c.644N>T | p.Ala215Val | p.A215V | Q9H8H3 | protein_coding | deleterious(0.03) | benign(0.269) | TCGA-A2-A0CP-01 | Breast | breast invasive carcinoma | Female | <65 | I/II | Chemotherapy | cytoxan | SD | |
| METTL7A | SNV | Missense_Mutation | novel | c.497N>A | p.Pro166Gln | p.P166Q | Q9H8H3 | protein_coding | deleterious(0.02) | possibly_damaging(0.704) | TCGA-AN-A046-01 | Breast | breast invasive carcinoma | Female | >=65 | I/II | Unknown | Unknown | SD |
| METTL7A | insertion | Nonsense_Mutation | novel | c.566_567insTGAATAAATAAATCAGGAAATTCCAATTTTTCTATTCGTAAC | p.Gln189delinsHisGluTerIleAsnGlnGluIleProIlePheLeuPheValThr | p.Q189delinsHE*INQEIPIFLFVT | Q9H8H3 | protein_coding | TCGA-AN-A0AR-01 | Breast | breast invasive carcinoma | Female | <65 | I/II | Unknown | Unknown | SD | ||
| METTL7A | SNV | Missense_Mutation | novel | c.523N>A | p.His175Asn | p.H175N | Q9H8H3 | protein_coding | deleterious(0) | probably_damaging(0.979) | TCGA-C5-A7X8-01 | Cervix | cervical & endocervical cancer | Female | <65 | I/II | Chemotherapy | cisplatin | SD |
| METTL7A | SNV | Missense_Mutation | rs757743447 | c.358G>C | p.Glu120Gln | p.E120Q | Q9H8H3 | protein_coding | tolerated(0.09) | benign(0.395) | TCGA-EK-A3GJ-01 | Cervix | cervical & endocervical cancer | Female | <65 | I/II | Unknown | Unknown | SD |
| METTL7A | SNV | Missense_Mutation | rs769150846 | c.704N>A | p.Arg235His | p.R235H | Q9H8H3 | protein_coding | deleterious(0.04) | possibly_damaging(0.459) | TCGA-AD-6901-01 | Colorectum | colon adenocarcinoma | Male | >=65 | I/II | Chemotherapy | xeloda | PD |
| METTL7A | SNV | Missense_Mutation | c.469N>A | p.Leu157Ile | p.L157I | Q9H8H3 | protein_coding | deleterious(0.01) | probably_damaging(0.991) | TCGA-CA-6717-01 | Colorectum | colon adenocarcinoma | Male | <65 | I/II | Chemotherapy | oxaliplatin | CR | |
| METTL7A | SNV | Missense_Mutation | rs749947319 | c.641N>A | p.Arg214Gln | p.R214Q | Q9H8H3 | protein_coding | tolerated(0.63) | benign(0.001) | TCGA-AG-3881-01 | Colorectum | rectum adenocarcinoma | Female | >=65 | I/II | Unknown | Unknown | SD |
| METTL7A | SNV | Missense_Mutation | novel | c.575N>C | p.Asp192Ala | p.D192A | Q9H8H3 | protein_coding | tolerated(0.15) | benign(0.001) | TCGA-F5-6814-01 | Colorectum | rectum adenocarcinoma | Male | <65 | I/II | Unknown | Unknown | SD |
| METTL7A | SNV | Missense_Mutation | novel | c.617G>C | p.Arg206Thr | p.R206T | Q9H8H3 | protein_coding | deleterious(0) | probably_damaging(0.915) | TCGA-A5-A3LP-01 | Endometrium | uterine corpus endometrioid carcinoma | Female | >=65 | I/II | Chemotherapy | carboplatin | CR |
| Page: 1 2 |
Top |
Related drugs of malignant transformation related genes |
| Identification of chemicals and drugs interact with genes involved in malignant transfromation |
| (DGIdb 4.0) |
| Entrez ID | Symbol | Category | Interaction Types | Drug Claim Name | Drug Name | PMIDs |
| Page: 1 |

Copyright 2023-Present -The University of Texas Health Science Center at Houston |