
|
|||||
|
 | |
| |
| |
| |
| |
| |
|
Gene: METTL6 |
Gene summary for METTL6 |
| Gene information | Species | Human | Gene symbol | METTL6 | Gene ID | 131965 |
| Gene name | methyltransferase 6, methylcytidine | |
| Gene Alias | METTL6 | |
| Cytomap | 3p25.1 | |
| Gene Type | protein-coding | GO ID | GO:0001510 | UniProtAcc | B4DDX3 |
Top |
Malignant transformation analysis |
| Identification of the aberrant gene expression in precancerous and cancerous lesions by comparing the gene expression of stem-like cells in diseased tissues with normal stem cells |
| Entrez ID | Symbol | Replicates | Species | Organ | Tissue | Adj P-value | Log2FC | Malignancy |
| 131965 | METTL6 | LZE4T | Human | Esophagus | ESCC | 1.21e-05 | 1.56e-01 | 0.0811 |
| 131965 | METTL6 | LZE24T | Human | Esophagus | ESCC | 1.41e-03 | 1.48e-01 | 0.0596 |
| 131965 | METTL6 | P2T-E | Human | Esophagus | ESCC | 4.54e-07 | 1.40e-01 | 0.1177 |
| 131965 | METTL6 | P4T-E | Human | Esophagus | ESCC | 3.45e-14 | 3.61e-01 | 0.1323 |
| 131965 | METTL6 | P5T-E | Human | Esophagus | ESCC | 9.26e-16 | 3.69e-01 | 0.1327 |
| 131965 | METTL6 | P8T-E | Human | Esophagus | ESCC | 1.42e-06 | 1.14e-01 | 0.0889 |
| 131965 | METTL6 | P9T-E | Human | Esophagus | ESCC | 1.82e-02 | 1.06e-01 | 0.1131 |
| 131965 | METTL6 | P10T-E | Human | Esophagus | ESCC | 2.05e-21 | 3.43e-01 | 0.116 |
| 131965 | METTL6 | P11T-E | Human | Esophagus | ESCC | 4.33e-02 | 1.71e-01 | 0.1426 |
| 131965 | METTL6 | P12T-E | Human | Esophagus | ESCC | 7.52e-17 | 1.45e-01 | 0.1122 |
| 131965 | METTL6 | P15T-E | Human | Esophagus | ESCC | 5.55e-03 | 1.10e-01 | 0.1149 |
| 131965 | METTL6 | P16T-E | Human | Esophagus | ESCC | 5.01e-10 | 2.30e-01 | 0.1153 |
| 131965 | METTL6 | P19T-E | Human | Esophagus | ESCC | 3.74e-02 | 2.13e-01 | 0.1662 |
| 131965 | METTL6 | P20T-E | Human | Esophagus | ESCC | 1.73e-05 | 1.66e-01 | 0.1124 |
| 131965 | METTL6 | P21T-E | Human | Esophagus | ESCC | 2.21e-12 | 2.22e-01 | 0.1617 |
| 131965 | METTL6 | P22T-E | Human | Esophagus | ESCC | 6.01e-05 | 1.20e-01 | 0.1236 |
| 131965 | METTL6 | P23T-E | Human | Esophagus | ESCC | 1.12e-06 | 2.26e-01 | 0.108 |
| 131965 | METTL6 | P24T-E | Human | Esophagus | ESCC | 1.15e-07 | 1.74e-01 | 0.1287 |
| 131965 | METTL6 | P26T-E | Human | Esophagus | ESCC | 1.34e-07 | 1.93e-01 | 0.1276 |
| 131965 | METTL6 | P27T-E | Human | Esophagus | ESCC | 1.69e-08 | 1.37e-01 | 0.1055 |
| Page: 1 2 3 |
| Tissue | Expression Dynamics | Abbreviation |
| Esophagus | 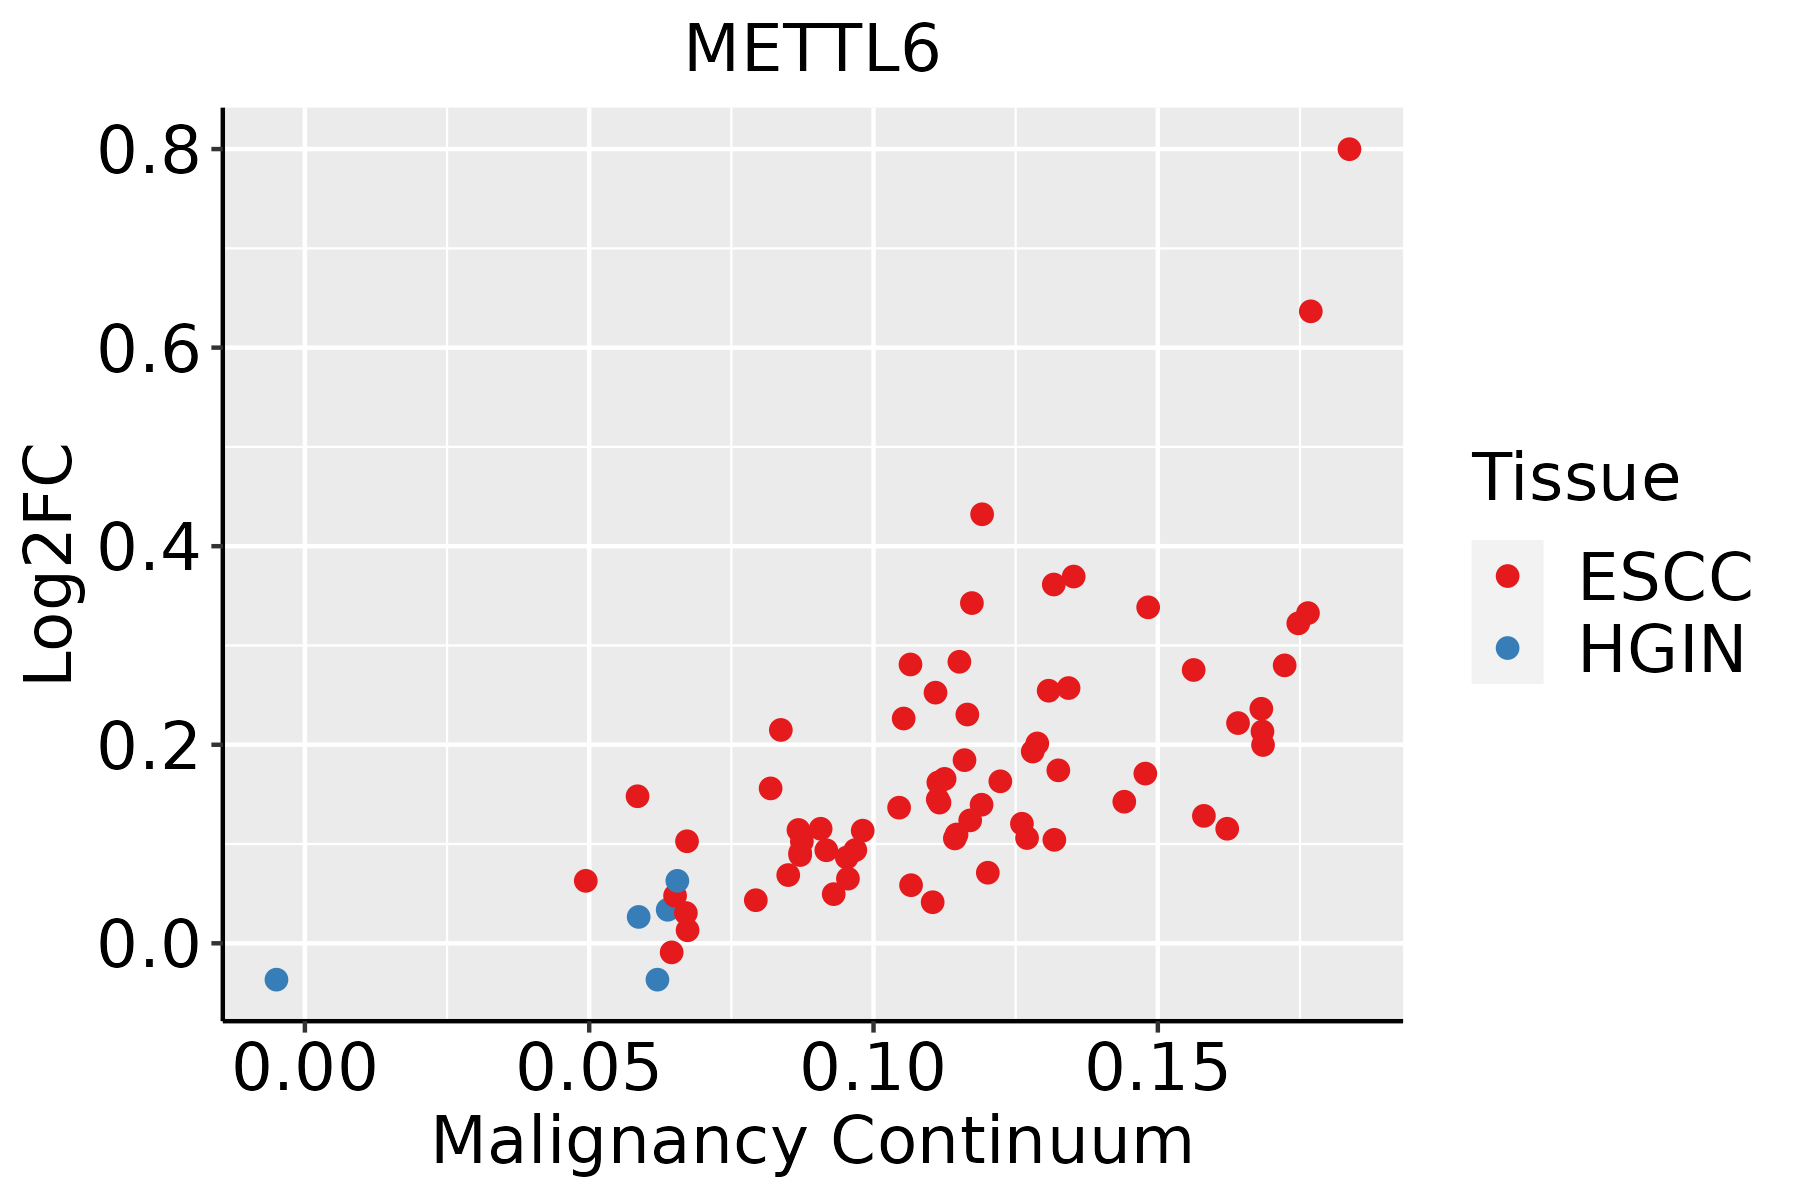 | ESCC: Esophageal squamous cell carcinoma |
| HGIN: High-grade intraepithelial neoplasias | ||
| LGIN: Low-grade intraepithelial neoplasias | ||
| Liver | 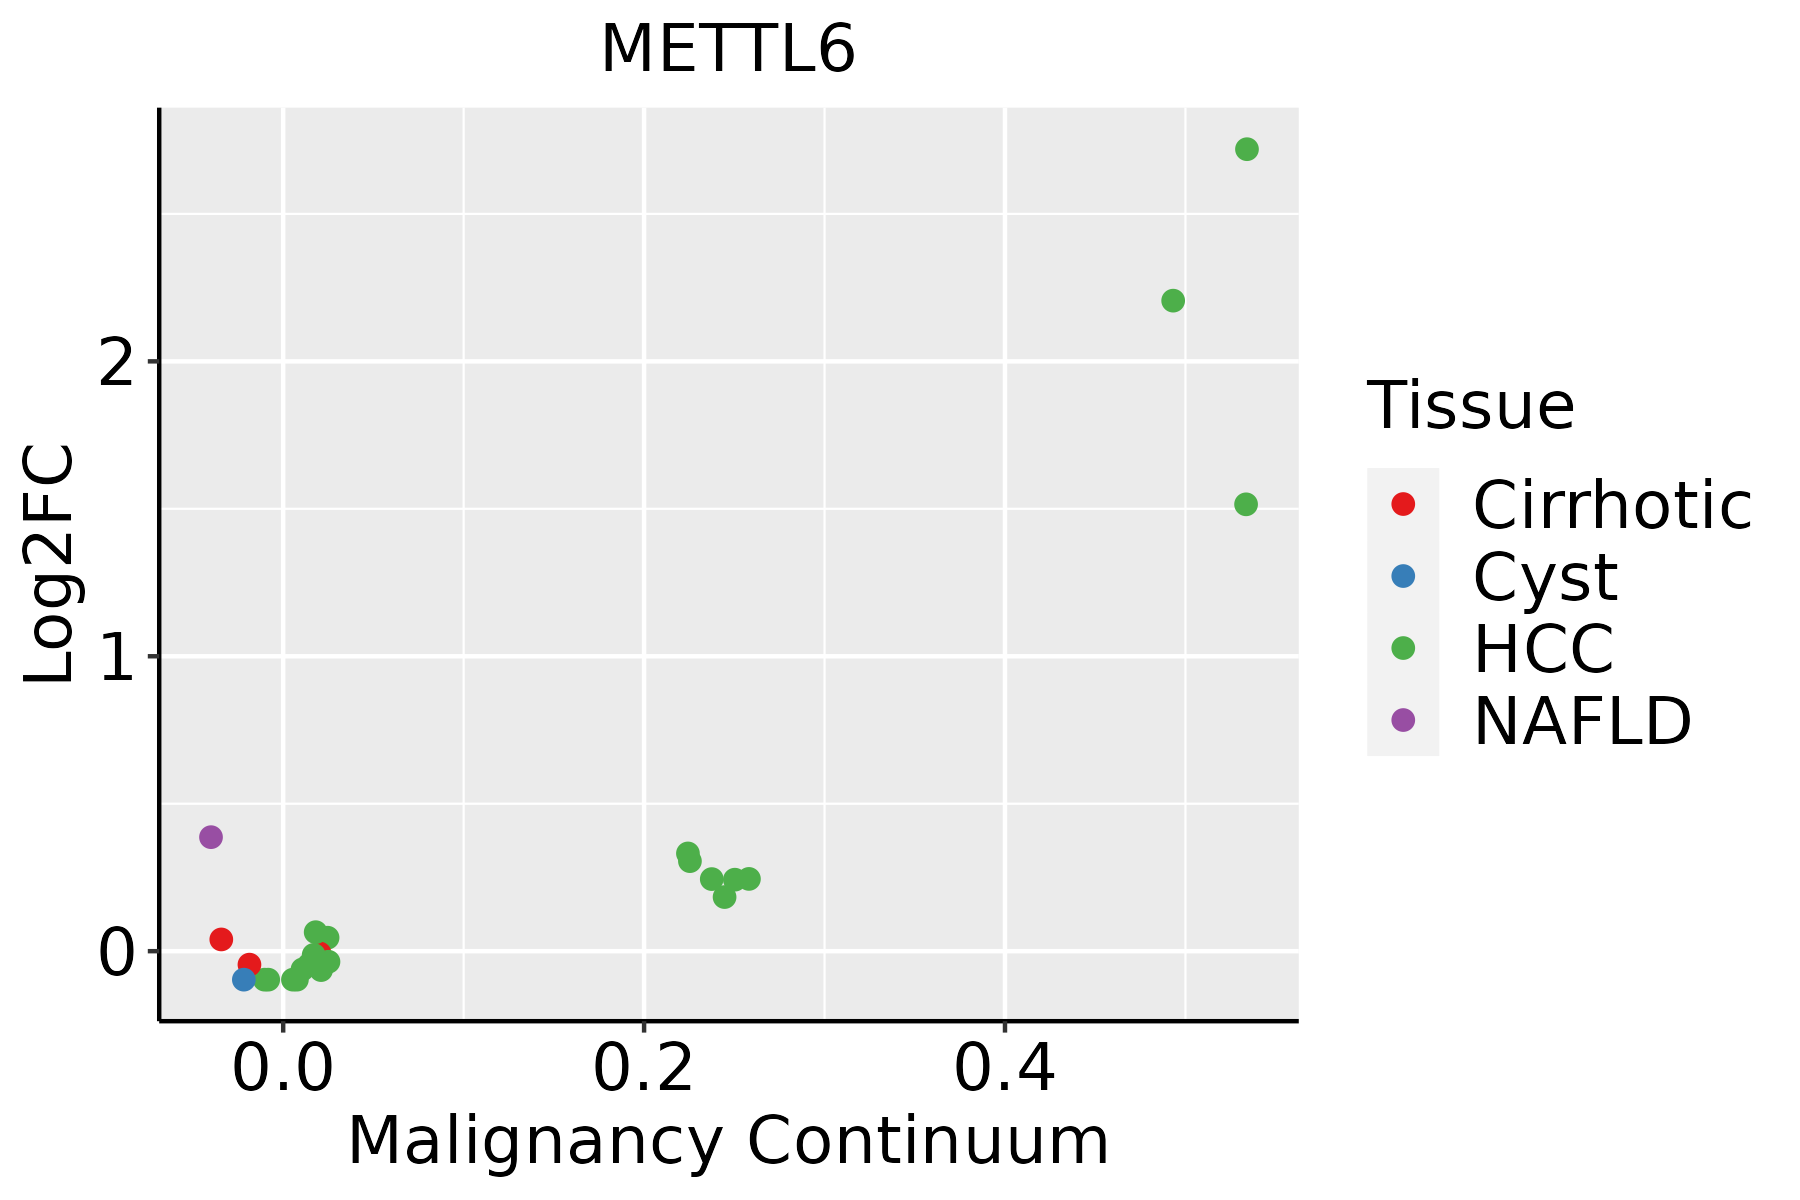 | HCC: Hepatocellular carcinoma |
| NAFLD: Non-alcoholic fatty liver disease |
| ∗log2FC in expression of this searched gene in stem-like cells from each diseased tissue sample relative to stem-like cells in normal samples in each tissue plotted against the malignancy continuum. Samples are colored based on if they are from different disease stage. |
Top |
Malignant transformation related pathway analysis |
| Find out the enriched GO biological processes and KEGG pathways involved in transition from healthy to precancer to cancer |
| Tissue | Disease Stage | Enriched GO biological Processes |
| Colorectum | AD |  |
| Colorectum | SER |  |
| Colorectum | MSS |  |
| Colorectum | MSI-H |  |
| Colorectum | FAP |  |
| ∗Top 15 enriched GO BP terms are showed in the bar plot of each disease state in each tissue. Each row represents a significant GO biological process which is colored according to the -log10(p.adjust). |
| Page: 1 2 3 4 5 6 7 8 9 |
| GO ID | Tissue | Disease Stage | Description | Gene Ratio | Bg Ratio | pvalue | p.adjust | Count |
| GO:003447015 | Esophagus | ESCC | ncRNA processing | 300/8552 | 395/18723 | 3.09e-35 | 3.26e-32 | 300 |
| GO:003466012 | Esophagus | ESCC | ncRNA metabolic process | 346/8552 | 485/18723 | 4.35e-31 | 2.51e-28 | 346 |
| GO:00434143 | Esophagus | ESCC | macromolecule methylation | 199/8552 | 316/18723 | 3.44e-10 | 9.57e-09 | 199 |
| GO:00080333 | Esophagus | ESCC | tRNA processing | 92/8552 | 127/18723 | 7.83e-10 | 1.93e-08 | 92 |
| GO:00063992 | Esophagus | ESCC | tRNA metabolic process | 122/8552 | 179/18723 | 9.03e-10 | 2.19e-08 | 122 |
| GO:00322592 | Esophagus | ESCC | methylation | 222/8552 | 364/18723 | 2.26e-09 | 5.09e-08 | 222 |
| GO:00094512 | Esophagus | ESCC | RNA modification | 114/8552 | 167/18723 | 2.76e-09 | 6.04e-08 | 114 |
| GO:00015101 | Esophagus | ESCC | RNA methylation | 58/8552 | 83/18723 | 6.87e-06 | 6.94e-05 | 58 |
| GO:00064002 | Esophagus | ESCC | tRNA modification | 62/8552 | 90/18723 | 7.02e-06 | 7.04e-05 | 62 |
| GO:00304881 | Esophagus | ESCC | tRNA methylation | 30/8552 | 41/18723 | 3.27e-04 | 1.93e-03 | 30 |
| GO:00344704 | Liver | NAFLD | ncRNA processing | 57/1882 | 395/18723 | 3.34e-03 | 2.93e-02 | 57 |
| GO:0043414 | Liver | NAFLD | macromolecule methylation | 47/1882 | 316/18723 | 4.08e-03 | 3.41e-02 | 47 |
| GO:00344702 | Liver | HCC | ncRNA processing | 293/7958 | 395/18723 | 4.26e-38 | 6.76e-35 | 293 |
| GO:00346601 | Liver | HCC | ncRNA metabolic process | 332/7958 | 485/18723 | 1.48e-31 | 7.80e-29 | 332 |
| GO:0008033 | Liver | HCC | tRNA processing | 87/7958 | 127/18723 | 2.66e-09 | 7.23e-08 | 87 |
| GO:00434141 | Liver | HCC | macromolecule methylation | 183/7958 | 316/18723 | 2.00e-08 | 4.72e-07 | 183 |
| GO:0032259 | Liver | HCC | methylation | 206/7958 | 364/18723 | 3.35e-08 | 7.53e-07 | 206 |
| GO:0006399 | Liver | HCC | tRNA metabolic process | 108/7958 | 179/18723 | 1.07e-06 | 1.59e-05 | 108 |
| GO:0009451 | Liver | HCC | RNA modification | 101/7958 | 167/18723 | 2.02e-06 | 2.78e-05 | 101 |
| GO:0006400 | Liver | HCC | tRNA modification | 60/7958 | 90/18723 | 3.09e-06 | 4.09e-05 | 60 |
| Page: 1 2 |
| Pathway ID | Tissue | Disease Stage | Description | Gene Ratio | Bg Ratio | pvalue | p.adjust | qvalue | Count |
| Page: 1 |
Top |
Cell-cell communication analysis |
| Identification of potential cell-cell interactions between two cell types and their ligand-receptor pairs for different disease states |
| Ligand | Receptor | LRpair | Pathway | Tissue | Disease Stage |
| Page: 1 |
Top |
Single-cell gene regulatory network inference analysis |
| Find out the significant the regulons (TFs) and the target genes of each regulon across cell types for different disease states |
| TF | Cell Type | Tissue | Disease Stage | Target Gene | RSS | Regulon Activity |
| ∗The dot plots of a searched regulon are shown for all cell subpopulations in each disease state of each tissue based on the regulon specific score inferred using pySCENIC and by calculating the average expression. |
| Page: 1 |
Top |
Somatic mutation of malignant transformation related genes |
| Annotation of somatic variants for genes involved in malignant transformation |
| Hugo Symbol | Variant Class | Variant Classification | dbSNP RS | HGVSc | HGVSp | HGVSp Short | SWISSPROT | BIOTYPE | SIFT | PolyPhen | Tumor Sample Barcode | Tissue | Histology | Sex | Age | Stage | Therapy Types | Drugs | Outcome |
| METTL6 | SNV | Missense_Mutation | novel | c.784N>T | p.Leu262Phe | p.L262F | Q8TCB7 | protein_coding | deleterious(0.01) | possibly_damaging(0.66) | TCGA-3C-AALI-01 | Breast | breast invasive carcinoma | Female | <65 | I/II | Unspecific | Poly E | Complete Response |
| METTL6 | insertion | In_Frame_Ins | novel | c.395_396insGCCATGGCTGCTCTTCAGAGC | p.Val132_Phe133insProTrpLeuLeuPheArgAla | p.V132_F133insPWLLFRA | Q8TCB7 | protein_coding | TCGA-A7-A0CJ-01 | Breast | breast invasive carcinoma | Female | <65 | I/II | Chemotherapy | cytoxan | SD | ||
| METTL6 | SNV | Missense_Mutation | novel | c.647N>T | p.Gly216Val | p.G216V | Q8TCB7 | protein_coding | deleterious(0) | probably_damaging(0.997) | TCGA-EA-A410-01 | Cervix | cervical & endocervical cancer | Female | <65 | I/II | Unknown | Unknown | SD |
| METTL6 | deletion | Frame_Shift_Del | novel | c.69_70delNN | p.Asp25ProfsTer6 | p.D25Pfs*6 | Q8TCB7 | protein_coding | TCGA-EA-A97N-01 | Cervix | cervical & endocervical cancer | Female | <65 | I/II | Unknown | Unknown | SD | ||
| METTL6 | SNV | Missense_Mutation | novel | c.442N>T | p.Pro148Ser | p.P148S | Q8TCB7 | protein_coding | tolerated(0.44) | benign(0.003) | TCGA-AA-3544-01 | Colorectum | colon adenocarcinoma | Male | >=65 | I/II | Unknown | Unknown | SD |
| METTL6 | SNV | Missense_Mutation | novel | c.727N>C | p.Tyr243His | p.Y243H | Q8TCB7 | protein_coding | deleterious(0) | probably_damaging(0.971) | TCGA-AA-3811-01 | Colorectum | colon adenocarcinoma | Female | >=65 | III/IV | Unknown | Unknown | PD |
| METTL6 | SNV | Missense_Mutation | c.30N>T | p.Gln10His | p.Q10H | Q8TCB7 | protein_coding | tolerated(0.38) | benign(0.001) | TCGA-AA-3864-01 | Colorectum | colon adenocarcinoma | Male | >=65 | I/II | Unknown | Unknown | SD | |
| METTL6 | SNV | Missense_Mutation | novel | c.455A>G | p.Asp152Gly | p.D152G | Q8TCB7 | protein_coding | deleterious(0.02) | possibly_damaging(0.739) | TCGA-AA-3949-01 | Colorectum | colon adenocarcinoma | Female | >=65 | III/IV | Unknown | Unknown | SD |
| METTL6 | SNV | Missense_Mutation | novel | c.728A>G | p.Tyr243Cys | p.Y243C | Q8TCB7 | protein_coding | deleterious(0) | probably_damaging(0.971) | TCGA-AA-3950-01 | Colorectum | colon adenocarcinoma | Female | >=65 | I/II | Unknown | Unknown | SD |
| METTL6 | SNV | Missense_Mutation | c.688C>A | p.Leu230Ile | p.L230I | Q8TCB7 | protein_coding | tolerated(0.1) | possibly_damaging(0.751) | TCGA-AA-A010-01 | Colorectum | colon adenocarcinoma | Female | <65 | I/II | Chemotherapy | folinic | CR |
| Page: 1 2 3 4 5 |
Top |
Related drugs of malignant transformation related genes |
| Identification of chemicals and drugs interact with genes involved in malignant transfromation |
| (DGIdb 4.0) |
| Entrez ID | Symbol | Category | Interaction Types | Drug Claim Name | Drug Name | PMIDs |
| Page: 1 |

Copyright 2023-Present -The University of Texas Health Science Center at Houston |