
|
|||||
|
 | |
| |
| |
| |
| |
| |
|
Gene: METTL5 |
Gene summary for METTL5 |
| Gene information | Species | Human | Gene symbol | METTL5 | Gene ID | 29081 |
| Gene name | methyltransferase 5, N6-adenosine | |
| Gene Alias | HSPC133 | |
| Cytomap | 2q31.1 | |
| Gene Type | protein-coding | GO ID | GO:0000154 | UniProtAcc | Q9NRN9 |
Top |
Malignant transformation analysis |
| Identification of the aberrant gene expression in precancerous and cancerous lesions by comparing the gene expression of stem-like cells in diseased tissues with normal stem cells |
| Entrez ID | Symbol | Replicates | Species | Organ | Tissue | Adj P-value | Log2FC | Malignancy |
| 29081 | METTL5 | LZE2T | Human | Esophagus | ESCC | 4.47e-07 | 1.18e+00 | 0.082 |
| 29081 | METTL5 | LZE3D | Human | Esophagus | HGIN | 1.10e-04 | 5.27e-01 | 0.0668 |
| 29081 | METTL5 | LZE4T | Human | Esophagus | ESCC | 7.07e-16 | 7.03e-01 | 0.0811 |
| 29081 | METTL5 | LZE5T | Human | Esophagus | ESCC | 1.67e-02 | 3.70e-01 | 0.0514 |
| 29081 | METTL5 | LZE7T | Human | Esophagus | ESCC | 1.24e-10 | 9.57e-01 | 0.0667 |
| 29081 | METTL5 | LZE8T | Human | Esophagus | ESCC | 4.85e-06 | 3.80e-01 | 0.067 |
| 29081 | METTL5 | LZE20T | Human | Esophagus | ESCC | 5.33e-05 | 4.66e-01 | 0.0662 |
| 29081 | METTL5 | LZE22D1 | Human | Esophagus | HGIN | 3.57e-05 | 3.68e-01 | 0.0595 |
| 29081 | METTL5 | LZE22T | Human | Esophagus | ESCC | 1.43e-07 | 6.91e-01 | 0.068 |
| 29081 | METTL5 | LZE24T | Human | Esophagus | ESCC | 9.72e-25 | 9.11e-01 | 0.0596 |
| 29081 | METTL5 | LZE6T | Human | Esophagus | ESCC | 3.80e-12 | 7.25e-01 | 0.0845 |
| 29081 | METTL5 | P1T-E | Human | Esophagus | ESCC | 2.47e-07 | 6.60e-01 | 0.0875 |
| 29081 | METTL5 | P2T-E | Human | Esophagus | ESCC | 5.30e-28 | 6.76e-01 | 0.1177 |
| 29081 | METTL5 | P4T-E | Human | Esophagus | ESCC | 1.13e-56 | 1.68e+00 | 0.1323 |
| 29081 | METTL5 | P5T-E | Human | Esophagus | ESCC | 4.00e-70 | 1.34e+00 | 0.1327 |
| 29081 | METTL5 | P8T-E | Human | Esophagus | ESCC | 1.60e-34 | 7.67e-01 | 0.0889 |
| 29081 | METTL5 | P9T-E | Human | Esophagus | ESCC | 4.14e-66 | 2.01e+00 | 0.1131 |
| 29081 | METTL5 | P10T-E | Human | Esophagus | ESCC | 2.00e-69 | 1.41e+00 | 0.116 |
| 29081 | METTL5 | P11T-E | Human | Esophagus | ESCC | 8.41e-19 | 1.06e+00 | 0.1426 |
| 29081 | METTL5 | P12T-E | Human | Esophagus | ESCC | 1.74e-62 | 1.28e+00 | 0.1122 |
| Page: 1 2 3 4 5 6 7 |
| Tissue | Expression Dynamics | Abbreviation |
| Esophagus | 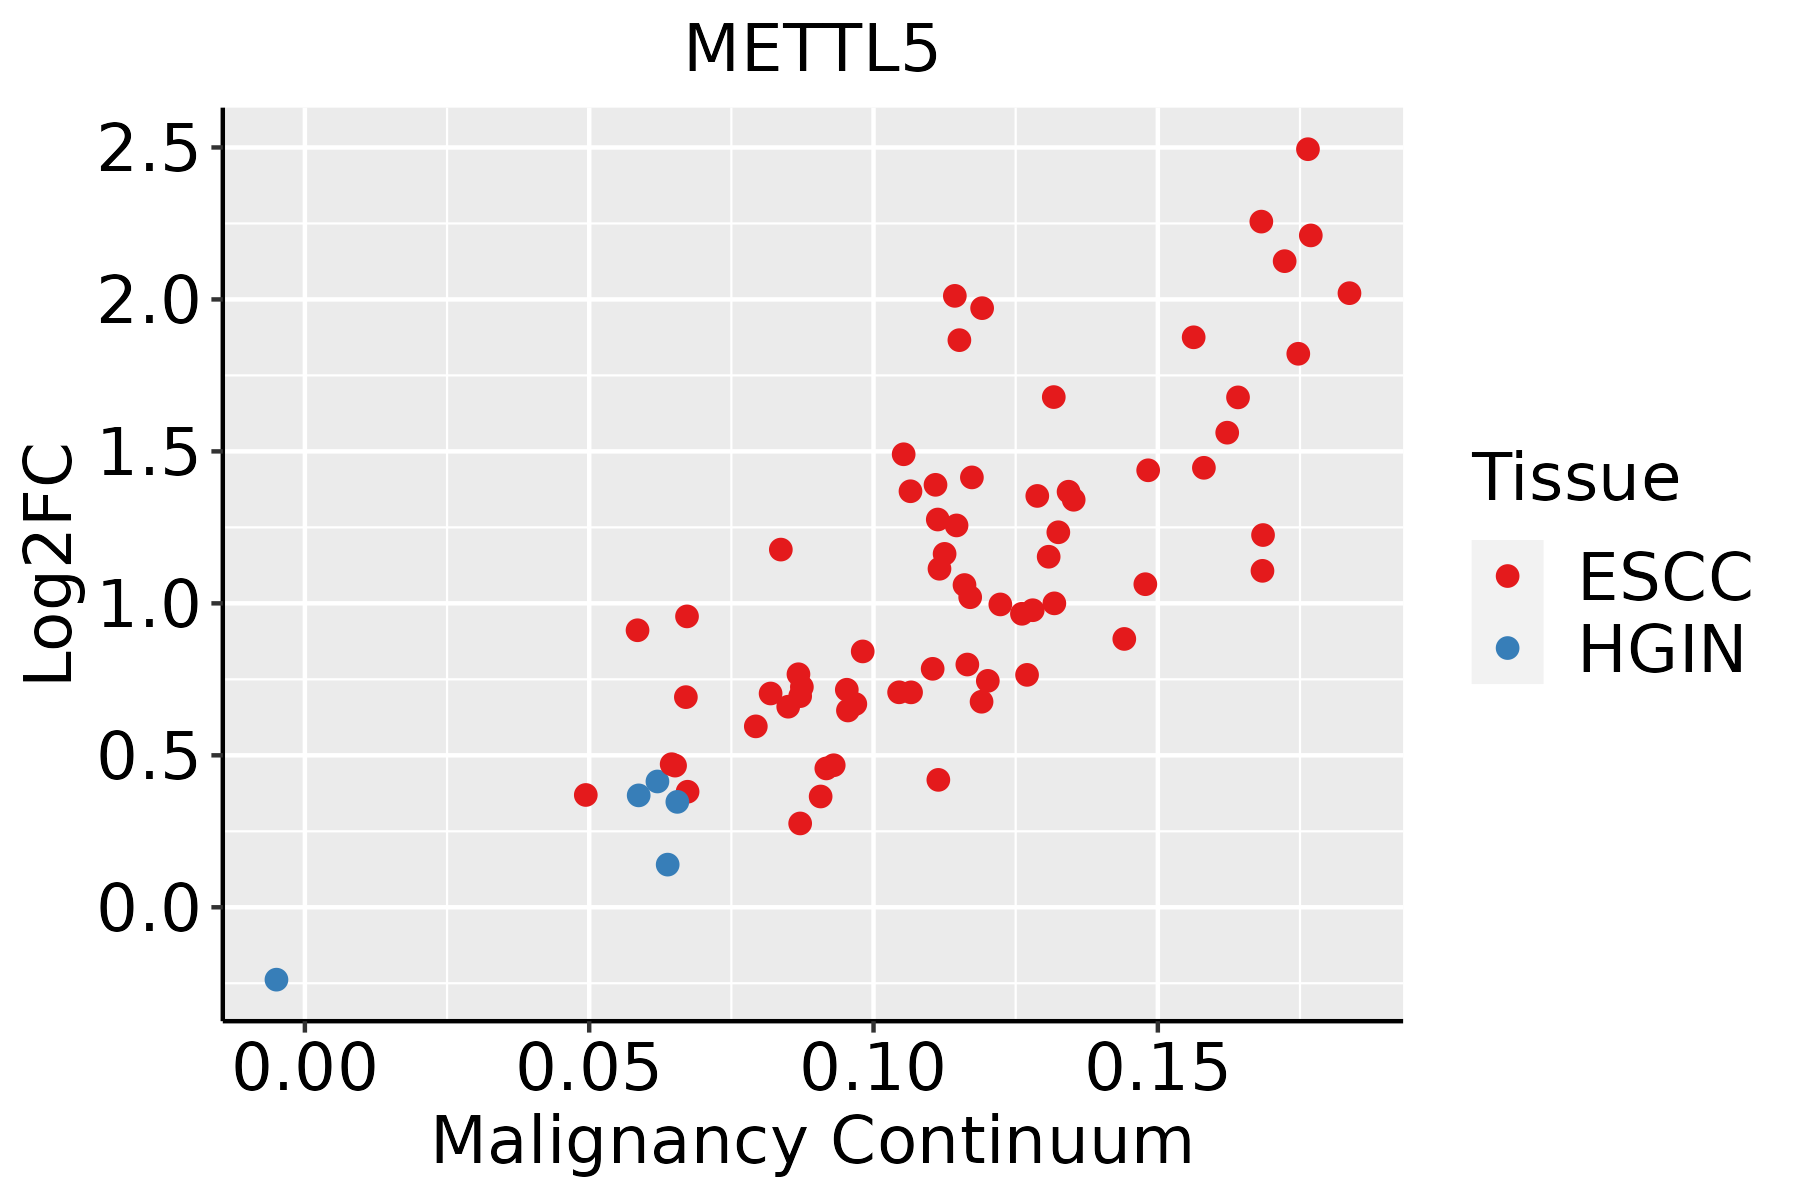 | ESCC: Esophageal squamous cell carcinoma |
| HGIN: High-grade intraepithelial neoplasias | ||
| LGIN: Low-grade intraepithelial neoplasias | ||
| Liver | 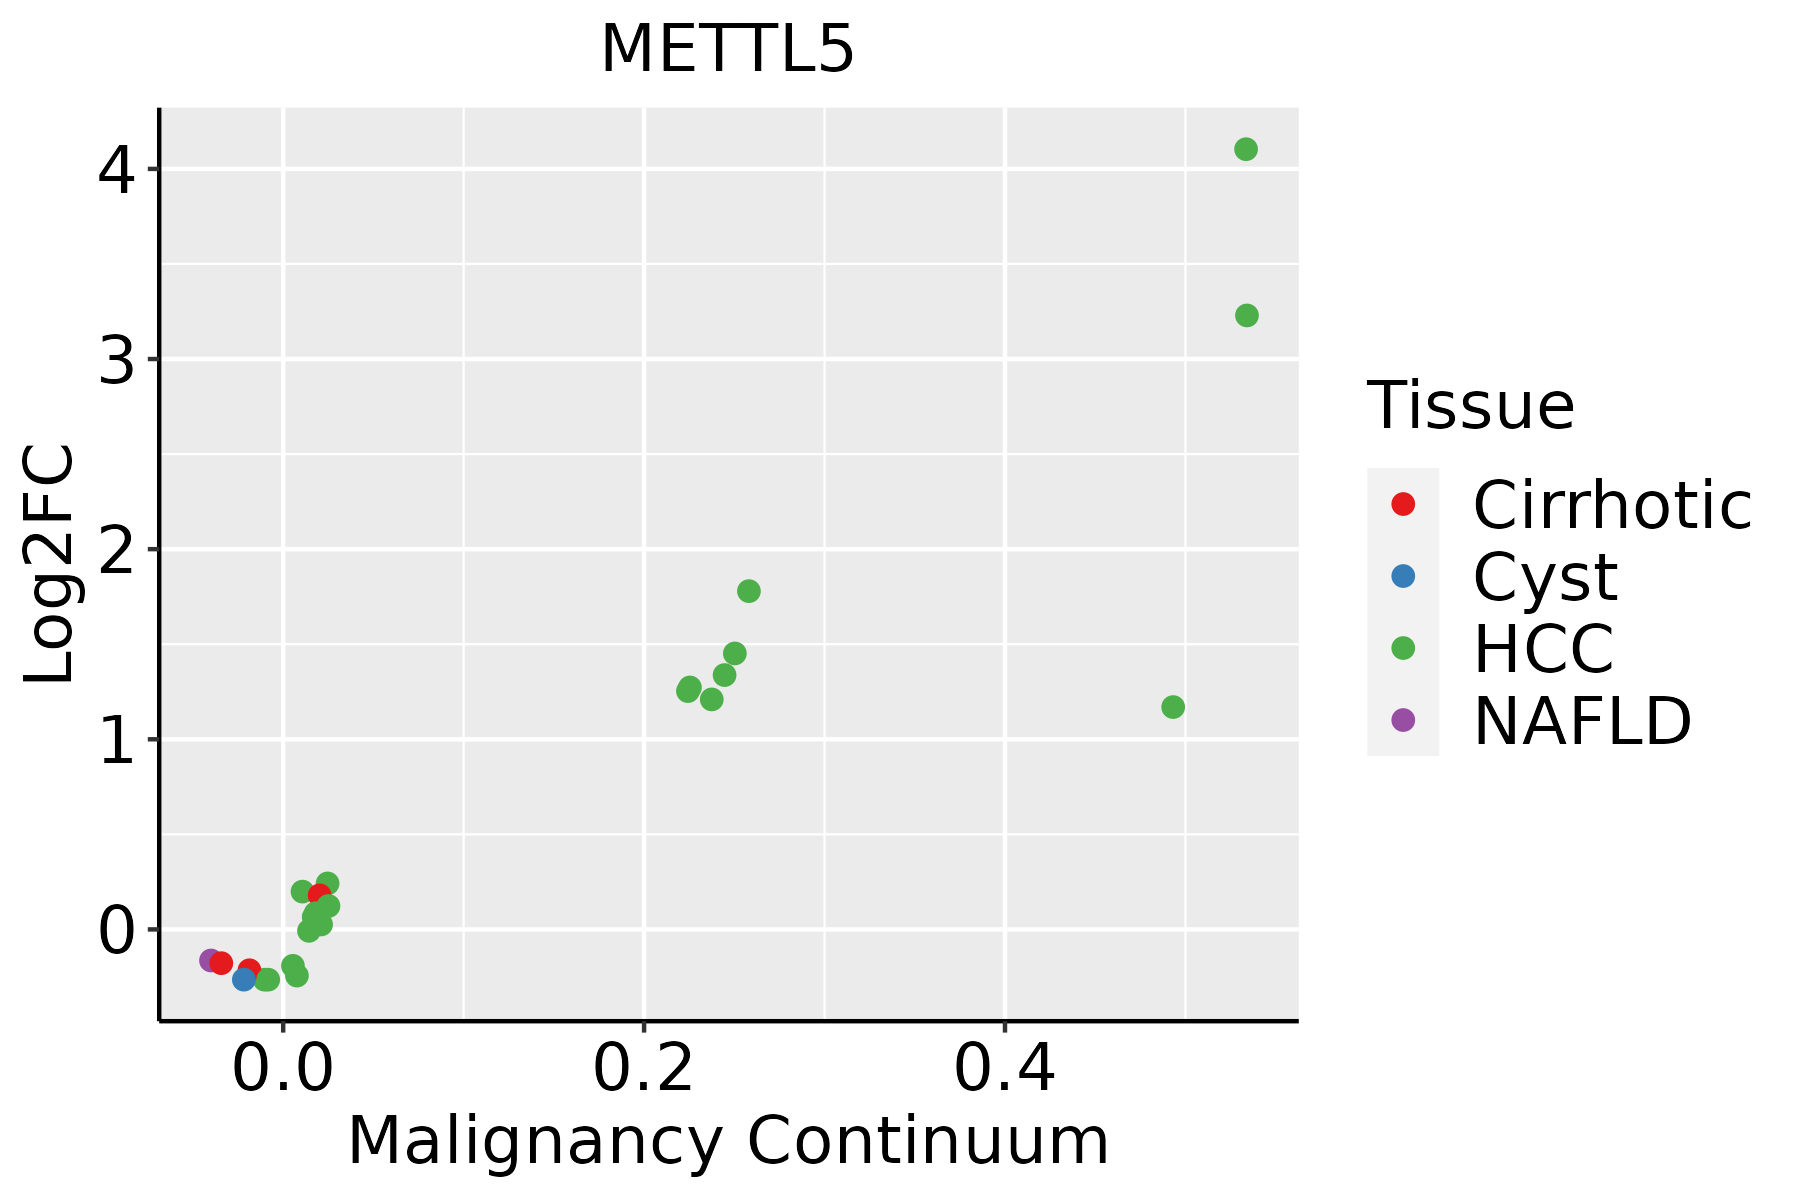 | HCC: Hepatocellular carcinoma |
| NAFLD: Non-alcoholic fatty liver disease | ||
| Oral Cavity | 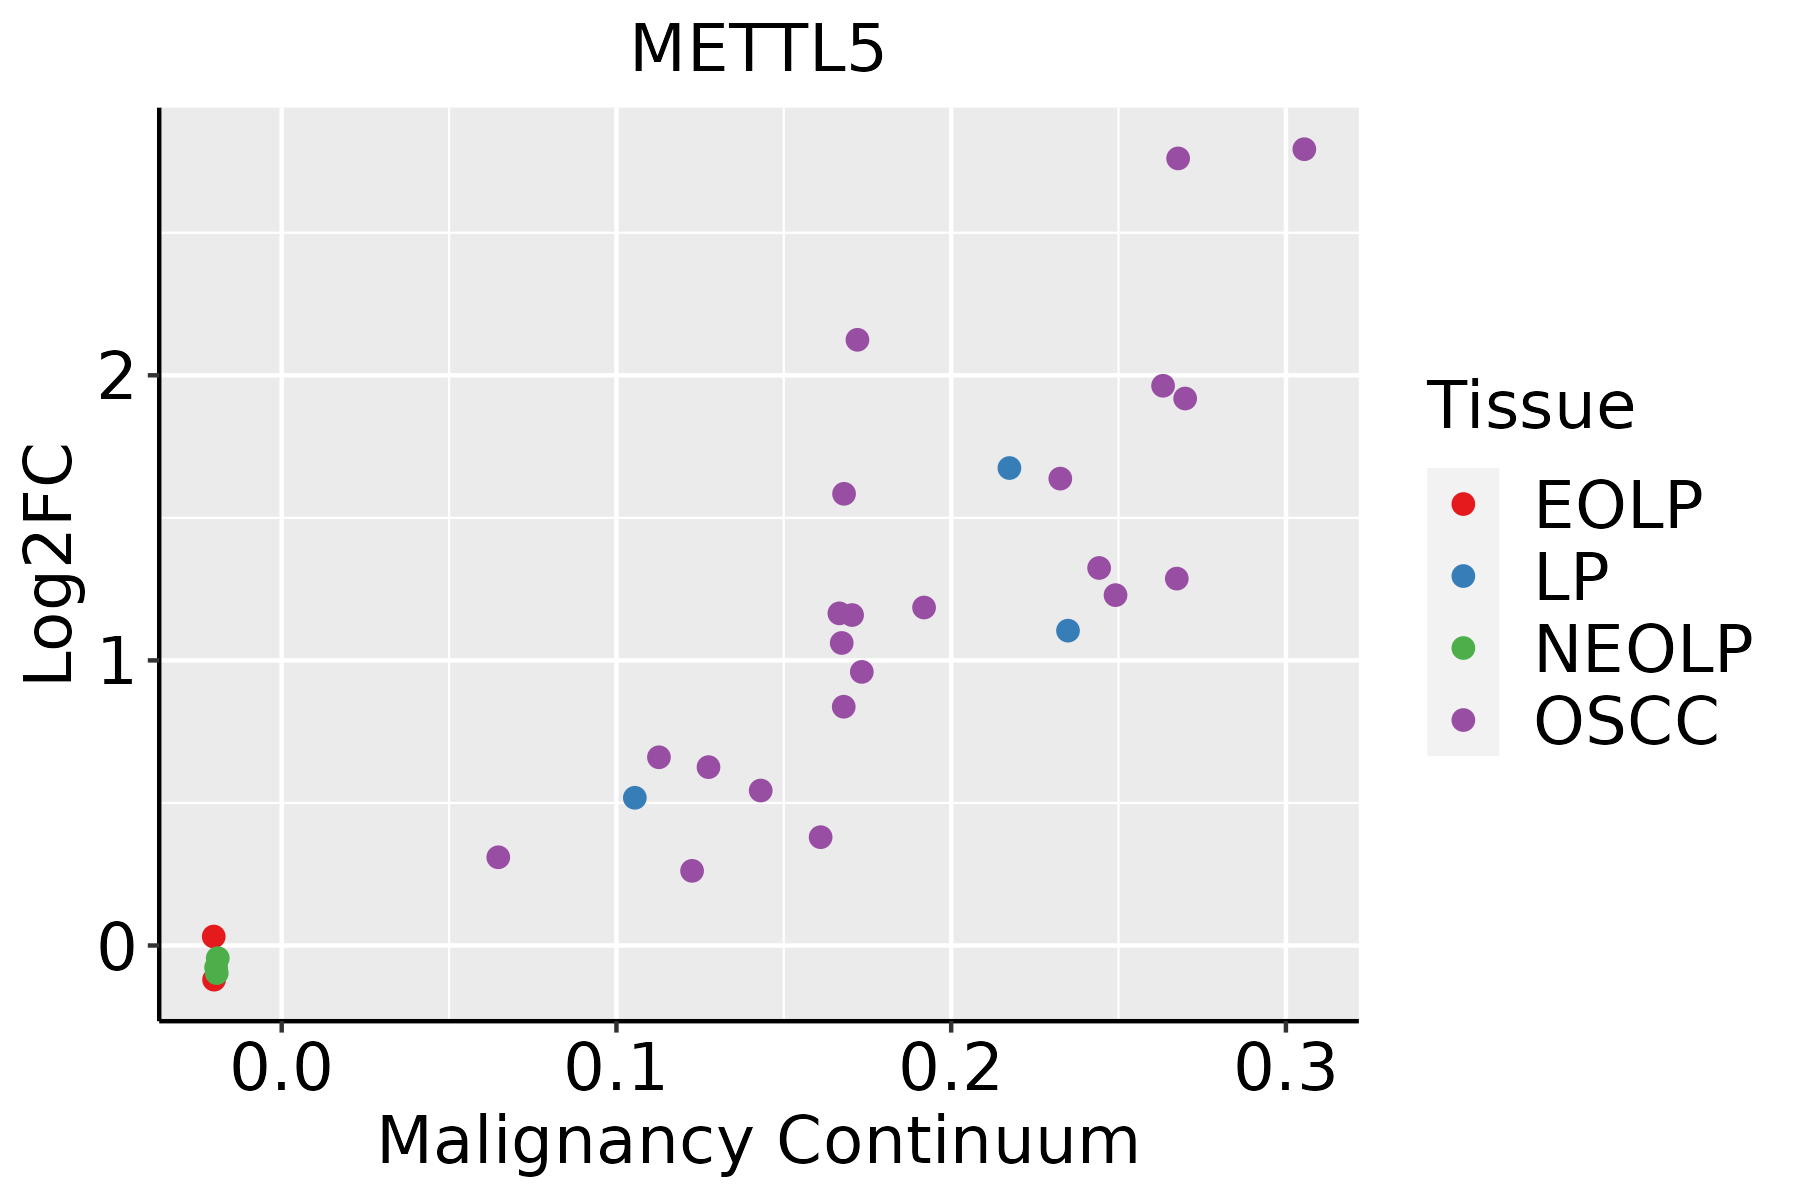 | EOLP: Erosive Oral lichen planus |
| LP: leukoplakia | ||
| NEOLP: Non-erosive oral lichen planus | ||
| OSCC: Oral squamous cell carcinoma | ||
| Prostate | 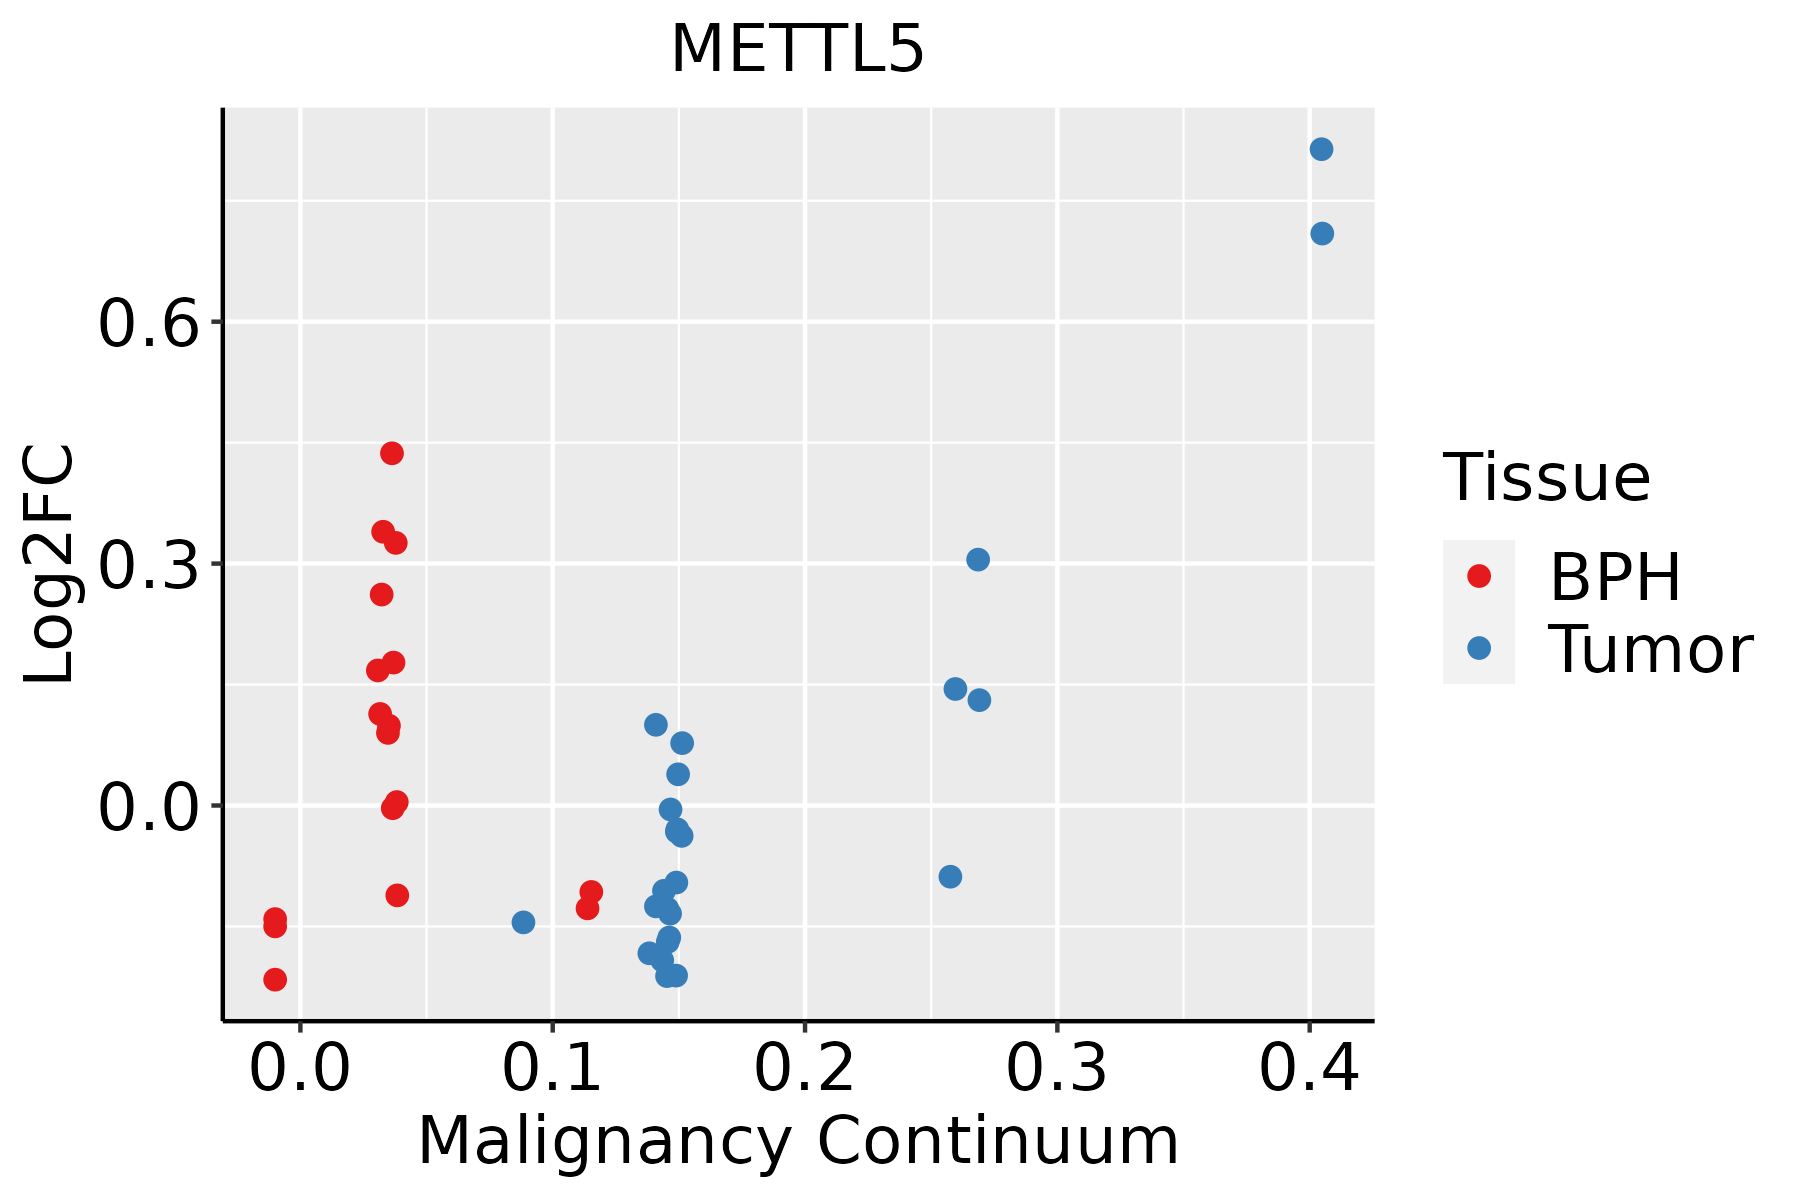 | BPH: Benign Prostatic Hyperplasia |
| Skin | 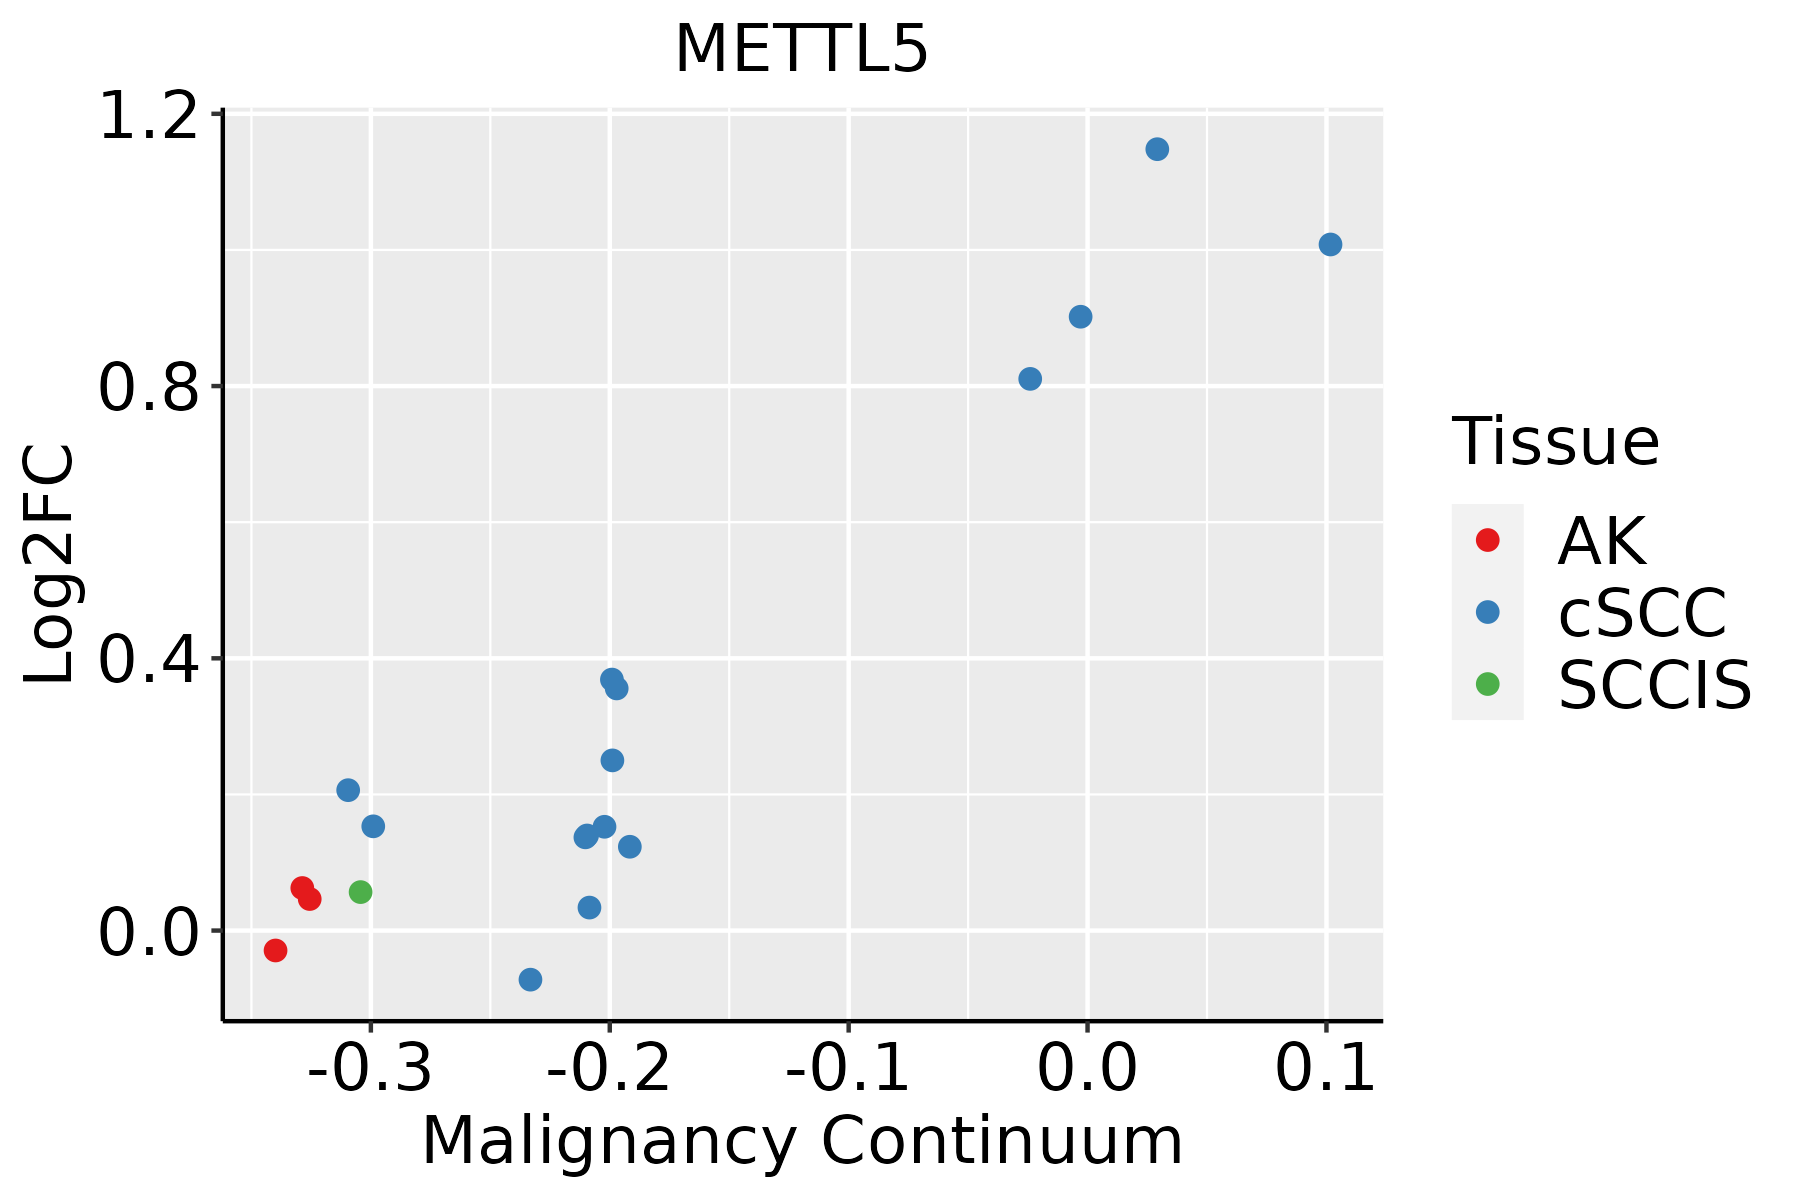 | AK: Actinic keratosis |
| cSCC: Cutaneous squamous cell carcinoma | ||
| SCCIS:squamous cell carcinoma in situ | ||
| Thyroid | 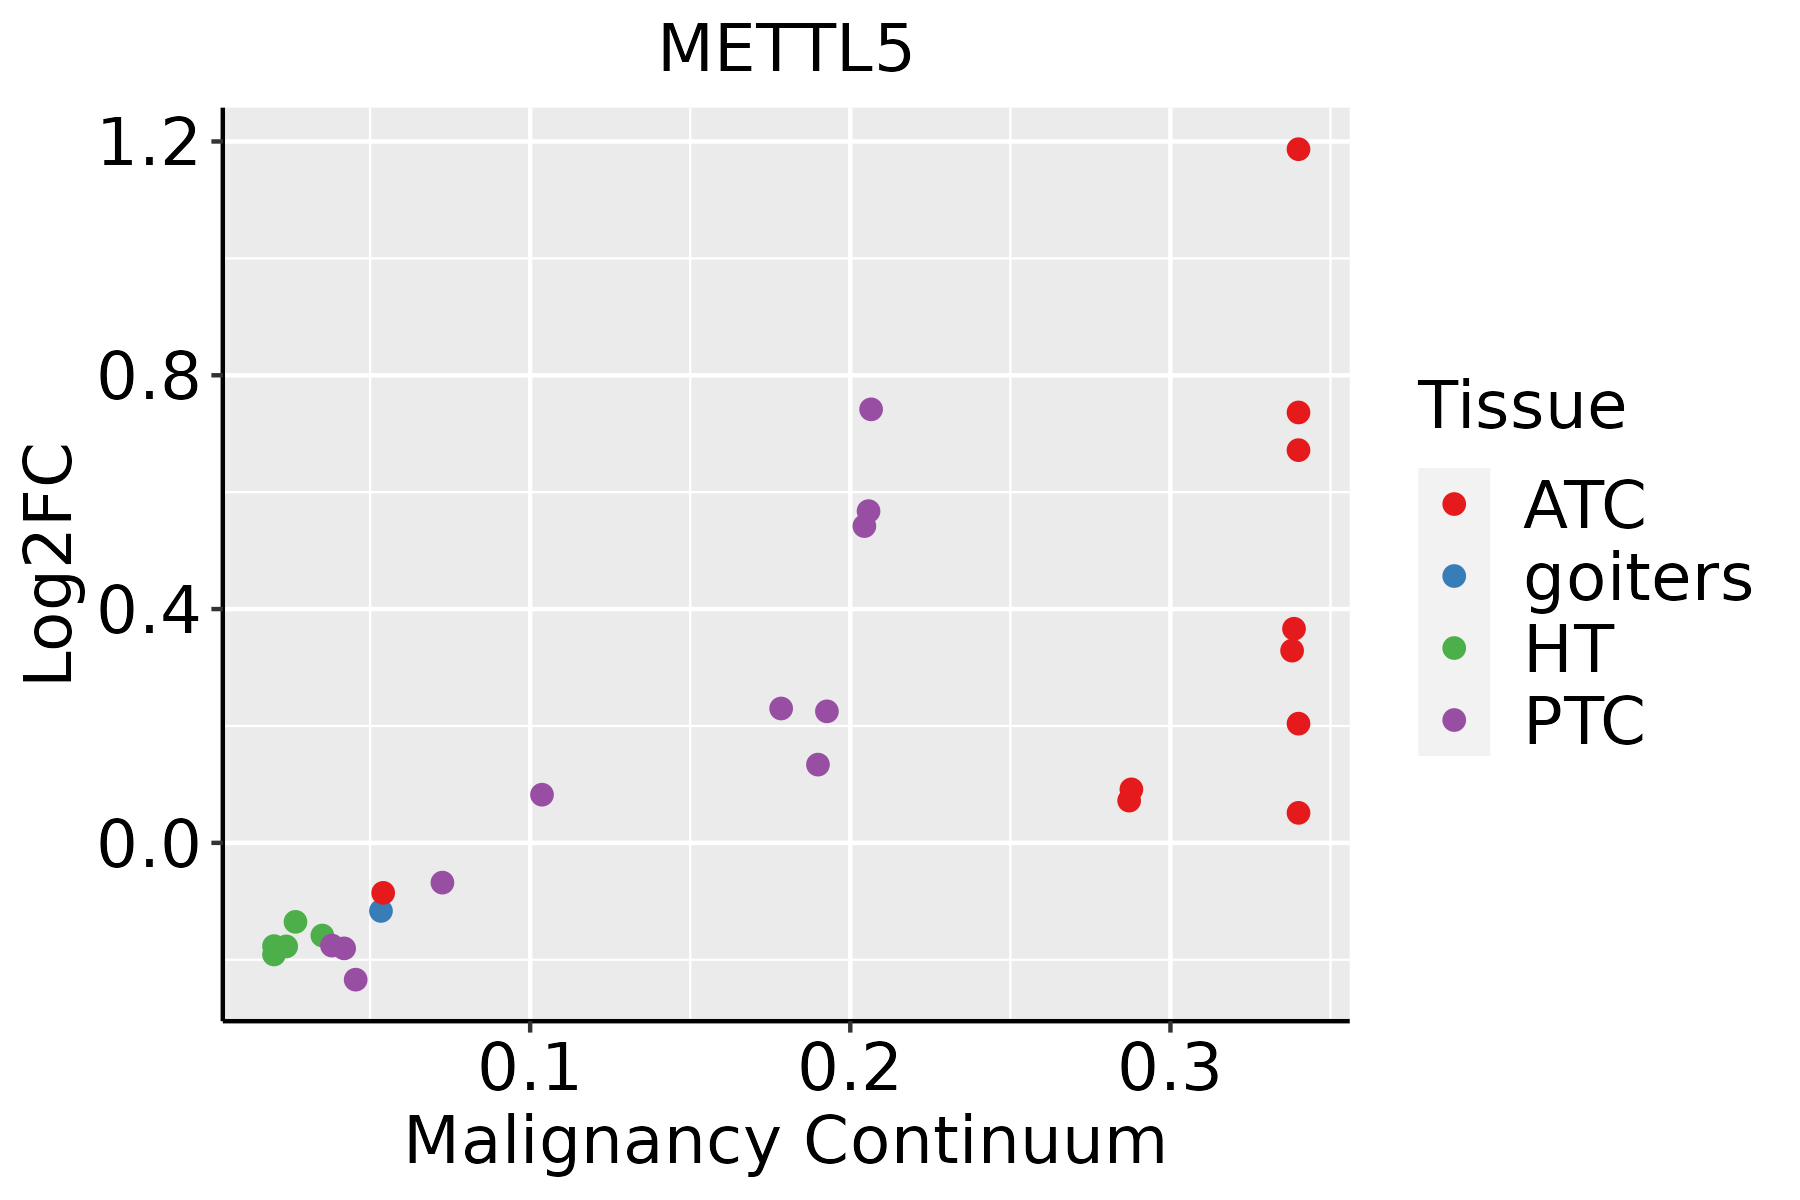 | ATC: Anaplastic thyroid cancer |
| HT: Hashimoto's thyroiditis | ||
| PTC: Papillary thyroid cancer |
| ∗log2FC in expression of this searched gene in stem-like cells from each diseased tissue sample relative to stem-like cells in normal samples in each tissue plotted against the malignancy continuum. Samples are colored based on if they are from different disease stage. |
Top |
Malignant transformation related pathway analysis |
| Find out the enriched GO biological processes and KEGG pathways involved in transition from healthy to precancer to cancer |
| Tissue | Disease Stage | Enriched GO biological Processes |
| Colorectum | AD |  |
| Colorectum | SER |  |
| Colorectum | MSS |  |
| Colorectum | MSI-H |  |
| Colorectum | FAP |  |
| ∗Top 15 enriched GO BP terms are showed in the bar plot of each disease state in each tissue. Each row represents a significant GO biological process which is colored according to the -log10(p.adjust). |
| Page: 1 2 3 4 5 6 7 8 9 |
| GO ID | Tissue | Disease Stage | Description | Gene Ratio | Bg Ratio | pvalue | p.adjust | Count |
| GO:002261327 | Esophagus | HGIN | ribonucleoprotein complex biogenesis | 158/2587 | 463/18723 | 2.61e-29 | 5.23e-26 | 158 |
| GO:000641727 | Esophagus | HGIN | regulation of translation | 139/2587 | 468/18723 | 1.46e-19 | 7.98e-17 | 139 |
| GO:004225426 | Esophagus | HGIN | ribosome biogenesis | 101/2587 | 299/18723 | 8.74e-19 | 4.03e-16 | 101 |
| GO:001607219 | Esophagus | HGIN | rRNA metabolic process | 72/2587 | 236/18723 | 2.26e-11 | 2.56e-09 | 72 |
| GO:000636419 | Esophagus | HGIN | rRNA processing | 69/2587 | 225/18723 | 4.53e-11 | 5.04e-09 | 69 |
| GO:004572720 | Esophagus | HGIN | positive regulation of translation | 49/2587 | 136/18723 | 5.88e-11 | 6.30e-09 | 49 |
| GO:003425020 | Esophagus | HGIN | positive regulation of cellular amide metabolic process | 53/2587 | 162/18723 | 6.01e-10 | 5.15e-08 | 53 |
| GO:003447010 | Esophagus | HGIN | ncRNA processing | 97/2587 | 395/18723 | 5.92e-09 | 3.90e-07 | 97 |
| GO:00346606 | Esophagus | HGIN | ncRNA metabolic process | 104/2587 | 485/18723 | 2.26e-06 | 8.23e-05 | 104 |
| GO:0022613111 | Esophagus | ESCC | ribonucleoprotein complex biogenesis | 365/8552 | 463/18723 | 1.74e-49 | 1.11e-45 | 365 |
| GO:0042254111 | Esophagus | ESCC | ribosome biogenesis | 252/8552 | 299/18723 | 3.27e-44 | 1.04e-40 | 252 |
| GO:003447015 | Esophagus | ESCC | ncRNA processing | 300/8552 | 395/18723 | 3.09e-35 | 3.26e-32 | 300 |
| GO:0016072110 | Esophagus | ESCC | rRNA metabolic process | 197/8552 | 236/18723 | 1.31e-33 | 1.18e-30 | 197 |
| GO:0006364110 | Esophagus | ESCC | rRNA processing | 189/8552 | 225/18723 | 4.88e-33 | 3.87e-30 | 189 |
| GO:003466012 | Esophagus | ESCC | ncRNA metabolic process | 346/8552 | 485/18723 | 4.35e-31 | 2.51e-28 | 346 |
| GO:0006417111 | Esophagus | ESCC | regulation of translation | 304/8552 | 468/18723 | 1.53e-17 | 1.33e-15 | 304 |
| GO:0045727111 | Esophagus | ESCC | positive regulation of translation | 107/8552 | 136/18723 | 2.79e-15 | 1.68e-13 | 107 |
| GO:0034250111 | Esophagus | ESCC | positive regulation of cellular amide metabolic process | 123/8552 | 162/18723 | 3.32e-15 | 1.93e-13 | 123 |
| GO:00434143 | Esophagus | ESCC | macromolecule methylation | 199/8552 | 316/18723 | 3.44e-10 | 9.57e-09 | 199 |
| GO:00322592 | Esophagus | ESCC | methylation | 222/8552 | 364/18723 | 2.26e-09 | 5.09e-08 | 222 |
| Page: 1 2 3 4 5 6 7 |
| Pathway ID | Tissue | Disease Stage | Description | Gene Ratio | Bg Ratio | pvalue | p.adjust | qvalue | Count |
| Page: 1 |
Top |
Cell-cell communication analysis |
| Identification of potential cell-cell interactions between two cell types and their ligand-receptor pairs for different disease states |
| Ligand | Receptor | LRpair | Pathway | Tissue | Disease Stage |
| Page: 1 |
Top |
Single-cell gene regulatory network inference analysis |
| Find out the significant the regulons (TFs) and the target genes of each regulon across cell types for different disease states |
| TF | Cell Type | Tissue | Disease Stage | Target Gene | RSS | Regulon Activity |
| ∗The dot plots of a searched regulon are shown for all cell subpopulations in each disease state of each tissue based on the regulon specific score inferred using pySCENIC and by calculating the average expression. |
| Page: 1 |
Top |
Somatic mutation of malignant transformation related genes |
| Annotation of somatic variants for genes involved in malignant transformation |
| Hugo Symbol | Variant Class | Variant Classification | dbSNP RS | HGVSc | HGVSp | HGVSp Short | SWISSPROT | BIOTYPE | SIFT | PolyPhen | Tumor Sample Barcode | Tissue | Histology | Sex | Age | Stage | Therapy Types | Drugs | Outcome |
| METTL5 | SNV | Missense_Mutation | c.525N>C | p.Lys175Asn | p.K175N | Q9NRN9 | protein_coding | tolerated(0.23) | benign(0.021) | TCGA-A2-A0CX-01 | Breast | breast invasive carcinoma | Female | <65 | I/II | Chemotherapy | adriamycin | SD | |
| METTL5 | SNV | Missense_Mutation | c.511N>A | p.Glu171Lys | p.E171K | Q9NRN9 | protein_coding | tolerated(0.14) | benign(0.05) | TCGA-D8-A146-01 | Breast | breast invasive carcinoma | Female | <65 | I/II | Unknown | Unknown | SD | |
| METTL5 | insertion | Nonsense_Mutation | novel | c.24_25insGTGCTGAGATTACAGGCATGAGCCACTGAGG | p.Leu9ValfsTer7 | p.L9Vfs*7 | Q9NRN9 | protein_coding | TCGA-A7-A0D9-01 | Breast | breast invasive carcinoma | Female | <65 | I/II | Chemotherapy | taxotere | SD | ||
| METTL5 | SNV | Missense_Mutation | novel | c.318N>T | p.Gln106His | p.Q106H | Q9NRN9 | protein_coding | tolerated(0.12) | benign(0.125) | TCGA-DS-A1OC-01 | Cervix | cervical & endocervical cancer | Female | <65 | I/II | Chemotherapy | gemcitabine | SD |
| METTL5 | SNV | Missense_Mutation | novel | c.317N>T | p.Gln106Leu | p.Q106L | Q9NRN9 | protein_coding | tolerated(0.28) | benign(0.034) | TCGA-DS-A1OC-01 | Cervix | cervical & endocervical cancer | Female | <65 | I/II | Chemotherapy | gemcitabine | SD |
| METTL5 | SNV | Missense_Mutation | novel | c.241N>C | p.Asp81His | p.D81H | Q9NRN9 | protein_coding | deleterious(0) | probably_damaging(0.998) | TCGA-MY-A913-01 | Cervix | cervical & endocervical cancer | Female | <65 | I/II | Chemotherapy | cisplatin | CR |
| METTL5 | SNV | Missense_Mutation | c.84G>T | p.Gln28His | p.Q28H | Q9NRN9 | protein_coding | deleterious(0) | probably_damaging(0.994) | TCGA-AA-3710-01 | Colorectum | colon adenocarcinoma | Female | >=65 | I/II | Unknown | Unknown | SD | |
| METTL5 | SNV | Missense_Mutation | c.85T>G | p.Tyr29Asp | p.Y29D | Q9NRN9 | protein_coding | deleterious(0) | probably_damaging(0.994) | TCGA-AA-3975-01 | Colorectum | colon adenocarcinoma | Male | >=65 | I/II | Unknown | Unknown | SD | |
| METTL5 | SNV | Missense_Mutation | c.280N>A | p.Ala94Thr | p.A94T | Q9NRN9 | protein_coding | tolerated(0.27) | benign(0.05) | TCGA-AD-6889-01 | Colorectum | colon adenocarcinoma | Male | >=65 | I/II | Chemotherapy | xeloda | PD | |
| METTL5 | SNV | Missense_Mutation | c.64N>G | p.Pro22Ala | p.P22A | Q9NRN9 | protein_coding | deleterious(0.03) | benign(0.323) | TCGA-AG-3878-01 | Colorectum | rectum adenocarcinoma | Male | <65 | I/II | Unknown | Unknown | SD |
| Page: 1 2 3 |
Top |
Related drugs of malignant transformation related genes |
| Identification of chemicals and drugs interact with genes involved in malignant transfromation |
| (DGIdb 4.0) |
| Entrez ID | Symbol | Category | Interaction Types | Drug Claim Name | Drug Name | PMIDs |
| Page: 1 |

Copyright 2023-Present -The University of Texas Health Science Center at Houston |