
|
|||||
|
 | |
| |
| |
| |
| |
| |
|
Gene: METTL3 |
Gene summary for METTL3 |
| Gene information | Species | Human | Gene symbol | METTL3 | Gene ID | 56339 |
| Gene name | methyltransferase 3, N6-adenosine-methyltransferase complex catalytic subunit | |
| Gene Alias | IME4 | |
| Cytomap | 14q11.2 | |
| Gene Type | protein-coding | GO ID | GO:0000003 | UniProtAcc | Q86U44 |
Top |
Malignant transformation analysis |
| Identification of the aberrant gene expression in precancerous and cancerous lesions by comparing the gene expression of stem-like cells in diseased tissues with normal stem cells |
| Entrez ID | Symbol | Replicates | Species | Organ | Tissue | Adj P-value | Log2FC | Malignancy |
| 56339 | METTL3 | LZE2T | Human | Esophagus | ESCC | 2.41e-02 | 3.14e-01 | 0.082 |
| 56339 | METTL3 | LZE4T | Human | Esophagus | ESCC | 1.37e-04 | 1.21e-01 | 0.0811 |
| 56339 | METTL3 | LZE7T | Human | Esophagus | ESCC | 4.34e-02 | 1.82e-01 | 0.0667 |
| 56339 | METTL3 | LZE20T | Human | Esophagus | ESCC | 2.47e-03 | 9.59e-02 | 0.0662 |
| 56339 | METTL3 | LZE24T | Human | Esophagus | ESCC | 1.84e-13 | 2.59e-01 | 0.0596 |
| 56339 | METTL3 | P1T-E | Human | Esophagus | ESCC | 6.42e-04 | 1.76e-01 | 0.0875 |
| 56339 | METTL3 | P2T-E | Human | Esophagus | ESCC | 3.63e-15 | 1.57e-01 | 0.1177 |
| 56339 | METTL3 | P4T-E | Human | Esophagus | ESCC | 5.81e-16 | 2.79e-01 | 0.1323 |
| 56339 | METTL3 | P5T-E | Human | Esophagus | ESCC | 3.87e-07 | 1.11e-01 | 0.1327 |
| 56339 | METTL3 | P8T-E | Human | Esophagus | ESCC | 7.83e-26 | 2.33e-01 | 0.0889 |
| 56339 | METTL3 | P9T-E | Human | Esophagus | ESCC | 5.90e-07 | 1.58e-01 | 0.1131 |
| 56339 | METTL3 | P10T-E | Human | Esophagus | ESCC | 2.08e-31 | 3.88e-01 | 0.116 |
| 56339 | METTL3 | P11T-E | Human | Esophagus | ESCC | 6.72e-05 | 3.01e-01 | 0.1426 |
| 56339 | METTL3 | P12T-E | Human | Esophagus | ESCC | 1.92e-27 | 5.09e-01 | 0.1122 |
| 56339 | METTL3 | P15T-E | Human | Esophagus | ESCC | 3.79e-27 | 3.38e-01 | 0.1149 |
| 56339 | METTL3 | P16T-E | Human | Esophagus | ESCC | 1.25e-17 | 1.77e-01 | 0.1153 |
| 56339 | METTL3 | P17T-E | Human | Esophagus | ESCC | 6.20e-03 | 1.98e-01 | 0.1278 |
| 56339 | METTL3 | P20T-E | Human | Esophagus | ESCC | 2.70e-11 | 1.13e-01 | 0.1124 |
| 56339 | METTL3 | P21T-E | Human | Esophagus | ESCC | 1.66e-12 | 1.10e-01 | 0.1617 |
| 56339 | METTL3 | P22T-E | Human | Esophagus | ESCC | 8.38e-19 | 2.09e-01 | 0.1236 |
| Page: 1 2 3 4 |
| Tissue | Expression Dynamics | Abbreviation |
| Esophagus |  | ESCC: Esophageal squamous cell carcinoma |
| HGIN: High-grade intraepithelial neoplasias | ||
| LGIN: Low-grade intraepithelial neoplasias | ||
| Oral Cavity | 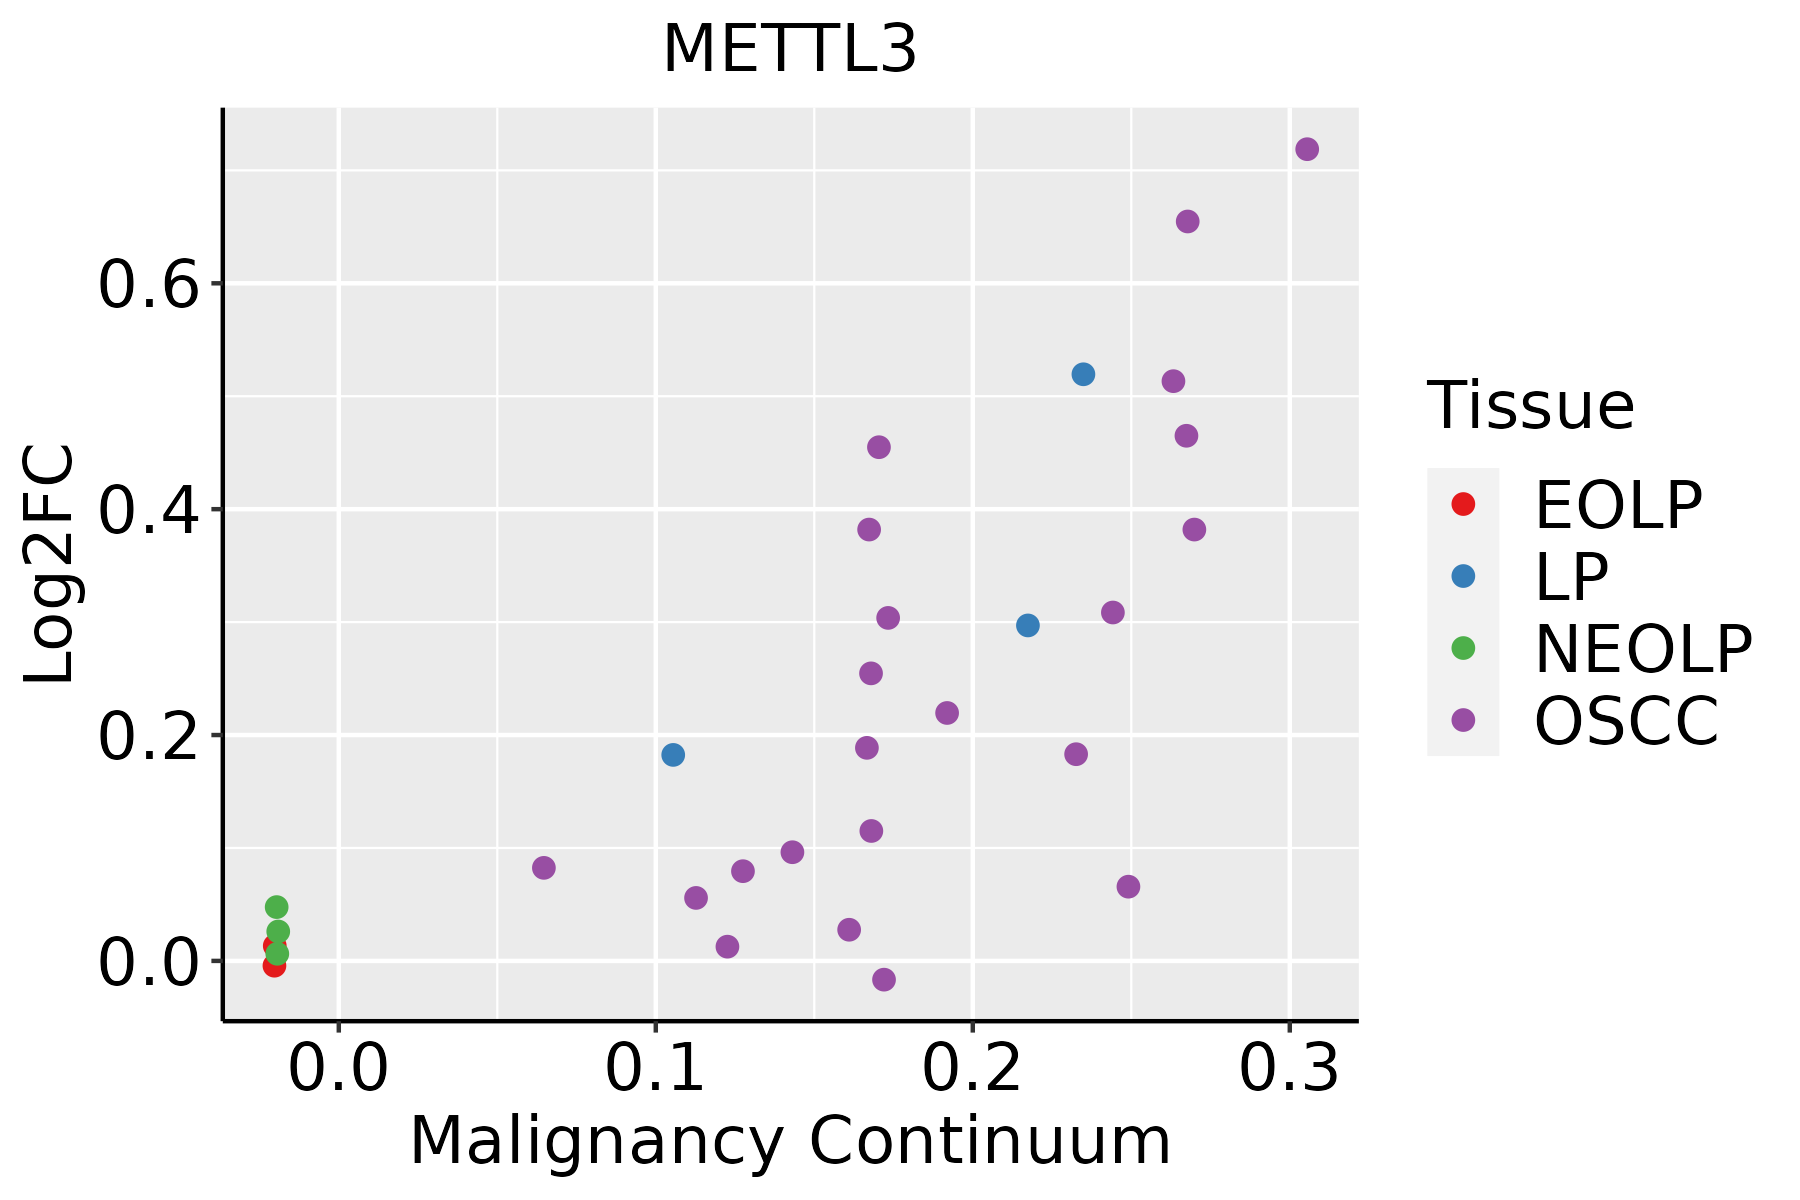 | EOLP: Erosive Oral lichen planus |
| LP: leukoplakia | ||
| NEOLP: Non-erosive oral lichen planus | ||
| OSCC: Oral squamous cell carcinoma | ||
| Skin |  | AK: Actinic keratosis |
| cSCC: Cutaneous squamous cell carcinoma | ||
| SCCIS:squamous cell carcinoma in situ |
| ∗log2FC in expression of this searched gene in stem-like cells from each diseased tissue sample relative to stem-like cells in normal samples in each tissue plotted against the malignancy continuum. Samples are colored based on if they are from different disease stage. |
Top |
Malignant transformation related pathway analysis |
| Find out the enriched GO biological processes and KEGG pathways involved in transition from healthy to precancer to cancer |
| Tissue | Disease Stage | Enriched GO biological Processes |
| Colorectum | AD |  |
| Colorectum | SER |  |
| Colorectum | MSS |  |
| Colorectum | MSI-H |  |
| Colorectum | FAP |  |
| ∗Top 15 enriched GO BP terms are showed in the bar plot of each disease state in each tissue. Each row represents a significant GO biological process which is colored according to the -log10(p.adjust). |
| Page: 1 2 3 4 5 6 7 8 9 |
| GO ID | Tissue | Disease Stage | Description | Gene Ratio | Bg Ratio | pvalue | p.adjust | Count |
| GO:0008380111 | Esophagus | ESCC | RNA splicing | 336/8552 | 434/18723 | 1.74e-42 | 3.67e-39 | 336 |
| GO:003447015 | Esophagus | ESCC | ncRNA processing | 300/8552 | 395/18723 | 3.09e-35 | 3.26e-32 | 300 |
| GO:0002181111 | Esophagus | ESCC | cytoplasmic translation | 135/8552 | 148/18723 | 4.17e-32 | 2.65e-29 | 135 |
| GO:003466012 | Esophagus | ESCC | ncRNA metabolic process | 346/8552 | 485/18723 | 4.35e-31 | 2.51e-28 | 346 |
| GO:0000375111 | Esophagus | ESCC | RNA splicing, via transesterification reactions | 248/8552 | 324/18723 | 3.05e-30 | 1.49e-27 | 248 |
| GO:0000377111 | Esophagus | ESCC | RNA splicing, via transesterification reactions with bulged adenosine as nucleophile | 244/8552 | 320/18723 | 2.52e-29 | 1.07e-26 | 244 |
| GO:0000398111 | Esophagus | ESCC | mRNA splicing, via spliceosome | 244/8552 | 320/18723 | 2.52e-29 | 1.07e-26 | 244 |
| GO:0009896111 | Esophagus | ESCC | positive regulation of catabolic process | 332/8552 | 492/18723 | 4.36e-23 | 9.22e-21 | 332 |
| GO:0031331111 | Esophagus | ESCC | positive regulation of cellular catabolic process | 292/8552 | 427/18723 | 8.67e-22 | 1.53e-19 | 292 |
| GO:1903311110 | Esophagus | ESCC | regulation of mRNA metabolic process | 210/8552 | 288/18723 | 3.25e-21 | 5.56e-19 | 210 |
| GO:0006401110 | Esophagus | ESCC | RNA catabolic process | 204/8552 | 278/18723 | 3.39e-21 | 5.66e-19 | 204 |
| GO:0006413110 | Esophagus | ESCC | translational initiation | 100/8552 | 118/18723 | 1.16e-18 | 1.25e-16 | 100 |
| GO:0034655110 | Esophagus | ESCC | nucleobase-containing compound catabolic process | 272/8552 | 407/18723 | 2.92e-18 | 2.90e-16 | 272 |
| GO:0006402110 | Esophagus | ESCC | mRNA catabolic process | 170/8552 | 232/18723 | 8.70e-18 | 8.00e-16 | 170 |
| GO:0006417111 | Esophagus | ESCC | regulation of translation | 304/8552 | 468/18723 | 1.53e-17 | 1.33e-15 | 304 |
| GO:004670018 | Esophagus | ESCC | heterocycle catabolic process | 286/8552 | 445/18723 | 1.12e-15 | 7.47e-14 | 286 |
| GO:0045727111 | Esophagus | ESCC | positive regulation of translation | 107/8552 | 136/18723 | 2.79e-15 | 1.68e-13 | 107 |
| GO:004427019 | Esophagus | ESCC | cellular nitrogen compound catabolic process | 288/8552 | 451/18723 | 3.03e-15 | 1.79e-13 | 288 |
| GO:000941113 | Esophagus | ESCC | response to UV | 115/8552 | 149/18723 | 3.29e-15 | 1.93e-13 | 115 |
| GO:0034250111 | Esophagus | ESCC | positive regulation of cellular amide metabolic process | 123/8552 | 162/18723 | 3.32e-15 | 1.93e-13 | 123 |
| Page: 1 2 3 4 5 6 7 8 9 10 11 12 13 14 15 16 |
| Pathway ID | Tissue | Disease Stage | Description | Gene Ratio | Bg Ratio | pvalue | p.adjust | qvalue | Count |
| Page: 1 |
Top |
Cell-cell communication analysis |
| Identification of potential cell-cell interactions between two cell types and their ligand-receptor pairs for different disease states |
| Ligand | Receptor | LRpair | Pathway | Tissue | Disease Stage |
| Page: 1 |
Top |
Single-cell gene regulatory network inference analysis |
| Find out the significant the regulons (TFs) and the target genes of each regulon across cell types for different disease states |
| TF | Cell Type | Tissue | Disease Stage | Target Gene | RSS | Regulon Activity |
| ∗The dot plots of a searched regulon are shown for all cell subpopulations in each disease state of each tissue based on the regulon specific score inferred using pySCENIC and by calculating the average expression. |
| Page: 1 |
Top |
Somatic mutation of malignant transformation related genes |
| Annotation of somatic variants for genes involved in malignant transformation |
| Hugo Symbol | Variant Class | Variant Classification | dbSNP RS | HGVSc | HGVSp | HGVSp Short | SWISSPROT | BIOTYPE | SIFT | PolyPhen | Tumor Sample Barcode | Tissue | Histology | Sex | Age | Stage | Therapy Types | Drugs | Outcome |
| METTL3 | SNV | Missense_Mutation | c.1177N>G | p.Met393Val | p.M393V | Q86U44 | protein_coding | deleterious(0) | possibly_damaging(0.78) | TCGA-AR-A251-01 | Breast | breast invasive carcinoma | Female | <65 | III/IV | Chemotherapy | doxorubicin | SD | |
| METTL3 | SNV | Missense_Mutation | c.1522N>G | p.Arg508Gly | p.R508G | Q86U44 | protein_coding | deleterious(0) | probably_damaging(1) | TCGA-B6-A1KF-01 | Breast | breast invasive carcinoma | Female | >=65 | I/II | Unknown | Unknown | SD | |
| METTL3 | deletion | Frame_Shift_Del | novel | c.1626delN | p.Asn543ThrfsTer15 | p.N543Tfs*15 | Q86U44 | protein_coding | TCGA-D8-A27V-01 | Breast | breast invasive carcinoma | Female | <65 | I/II | Hormone Therapy | tamoxiphen | SD | ||
| METTL3 | SNV | Missense_Mutation | c.1495N>A | p.Asp499Asn | p.D499N | Q86U44 | protein_coding | deleterious(0) | probably_damaging(0.98) | TCGA-2W-A8YY-01 | Cervix | cervical & endocervical cancer | Female | <65 | I/II | Chemotherapy | cisplatin | CR | |
| METTL3 | SNV | Missense_Mutation | c.656N>T | p.Ser219Leu | p.S219L | Q86U44 | protein_coding | tolerated(0.1) | benign(0.021) | TCGA-Q1-A5R2-01 | Cervix | cervical & endocervical cancer | Female | <65 | I/II | Chemotherapy | cisplatin | PR | |
| METTL3 | SNV | Missense_Mutation | novel | c.52N>G | p.Leu18Val | p.L18V | Q86U44 | protein_coding | deleterious(0) | possibly_damaging(0.891) | TCGA-VS-A953-01 | Cervix | cervical & endocervical cancer | Female | <65 | I/II | Unknown | Unknown | PD |
| METTL3 | SNV | Missense_Mutation | novel | c.341N>G | p.Asp114Gly | p.D114G | Q86U44 | protein_coding | tolerated(0.37) | benign(0) | TCGA-A6-3807-01 | Colorectum | colon adenocarcinoma | Female | <65 | III/IV | Ancillary | leucovorin | SD |
| METTL3 | SNV | Missense_Mutation | c.157C>T | p.Pro53Ser | p.P53S | Q86U44 | protein_coding | tolerated(0.4) | benign(0.019) | TCGA-AA-3815-01 | Colorectum | colon adenocarcinoma | Female | >=65 | I/II | Unknown | Unknown | SD | |
| METTL3 | SNV | Missense_Mutation | c.1243N>T | p.Arg415Cys | p.R415C | Q86U44 | protein_coding | deleterious(0) | probably_damaging(0.99) | TCGA-AA-3864-01 | Colorectum | colon adenocarcinoma | Male | >=65 | I/II | Unknown | Unknown | SD | |
| METTL3 | SNV | Missense_Mutation | c.1217A>G | p.Tyr406Cys | p.Y406C | Q86U44 | protein_coding | deleterious(0) | probably_damaging(1) | TCGA-AA-3989-01 | Colorectum | colon adenocarcinoma | Male | >=65 | III/IV | Unknown | Unknown | PD |
| Page: 1 2 3 4 5 |
Top |
Related drugs of malignant transformation related genes |
| Identification of chemicals and drugs interact with genes involved in malignant transfromation |
| (DGIdb 4.0) |
| Entrez ID | Symbol | Category | Interaction Types | Drug Claim Name | Drug Name | PMIDs |
| Page: 1 |

Copyright 2023-Present -The University of Texas Health Science Center at Houston |