
|
|||||
|
 | |
| |
| |
| |
| |
| |
|
Gene: METTL26 |
Gene summary for METTL26 |
| Gene information | Species | Human | Gene symbol | METTL26 | Gene ID | 84326 |
| Gene name | methyltransferase like 26 | |
| Gene Alias | C16orf13 | |
| Cytomap | 16p13.3 | |
| Gene Type | protein-coding | GO ID | NA | UniProtAcc | Q96S19 |
Top |
Malignant transformation analysis |
| Identification of the aberrant gene expression in precancerous and cancerous lesions by comparing the gene expression of stem-like cells in diseased tissues with normal stem cells |
| Entrez ID | Symbol | Replicates | Species | Organ | Tissue | Adj P-value | Log2FC | Malignancy |
| 84326 | METTL26 | GSM4909281 | Human | Breast | IDC | 1.97e-11 | 4.15e-01 | 0.21 |
| 84326 | METTL26 | GSM4909286 | Human | Breast | IDC | 4.10e-03 | 1.58e-01 | 0.1081 |
| 84326 | METTL26 | GSM4909287 | Human | Breast | IDC | 2.67e-09 | 4.43e-01 | 0.2057 |
| 84326 | METTL26 | GSM4909290 | Human | Breast | IDC | 3.68e-05 | 2.41e-01 | 0.2096 |
| 84326 | METTL26 | GSM4909293 | Human | Breast | IDC | 7.15e-21 | 5.01e-01 | 0.1581 |
| 84326 | METTL26 | GSM4909295 | Human | Breast | IDC | 2.10e-02 | 3.56e-01 | 0.0898 |
| 84326 | METTL26 | GSM4909296 | Human | Breast | IDC | 2.22e-06 | 1.63e-01 | 0.1524 |
| 84326 | METTL26 | GSM4909297 | Human | Breast | IDC | 1.22e-06 | 3.92e-02 | 0.1517 |
| 84326 | METTL26 | GSM4909298 | Human | Breast | IDC | 4.11e-08 | 3.84e-01 | 0.1551 |
| 84326 | METTL26 | GSM4909301 | Human | Breast | IDC | 4.56e-11 | 4.56e-01 | 0.1577 |
| 84326 | METTL26 | GSM4909302 | Human | Breast | IDC | 1.42e-02 | 2.97e-01 | 0.1545 |
| 84326 | METTL26 | GSM4909304 | Human | Breast | IDC | 7.03e-25 | 6.13e-01 | 0.1636 |
| 84326 | METTL26 | GSM4909305 | Human | Breast | IDC | 1.14e-02 | 2.65e-01 | 0.0436 |
| 84326 | METTL26 | GSM4909306 | Human | Breast | IDC | 1.25e-20 | 5.55e-01 | 0.1564 |
| 84326 | METTL26 | GSM4909307 | Human | Breast | IDC | 1.49e-02 | 3.00e-01 | 0.1569 |
| 84326 | METTL26 | GSM4909308 | Human | Breast | IDC | 1.32e-20 | 4.95e-01 | 0.158 |
| 84326 | METTL26 | GSM4909311 | Human | Breast | IDC | 1.10e-19 | 1.05e-01 | 0.1534 |
| 84326 | METTL26 | GSM4909312 | Human | Breast | IDC | 1.10e-06 | 2.35e-01 | 0.1552 |
| 84326 | METTL26 | GSM4909315 | Human | Breast | IDC | 5.97e-18 | 6.05e-01 | 0.21 |
| 84326 | METTL26 | GSM4909317 | Human | Breast | IDC | 9.48e-10 | 4.12e-01 | 0.1355 |
| Page: 1 2 3 4 5 |
| Tissue | Expression Dynamics | Abbreviation |
| Breast | 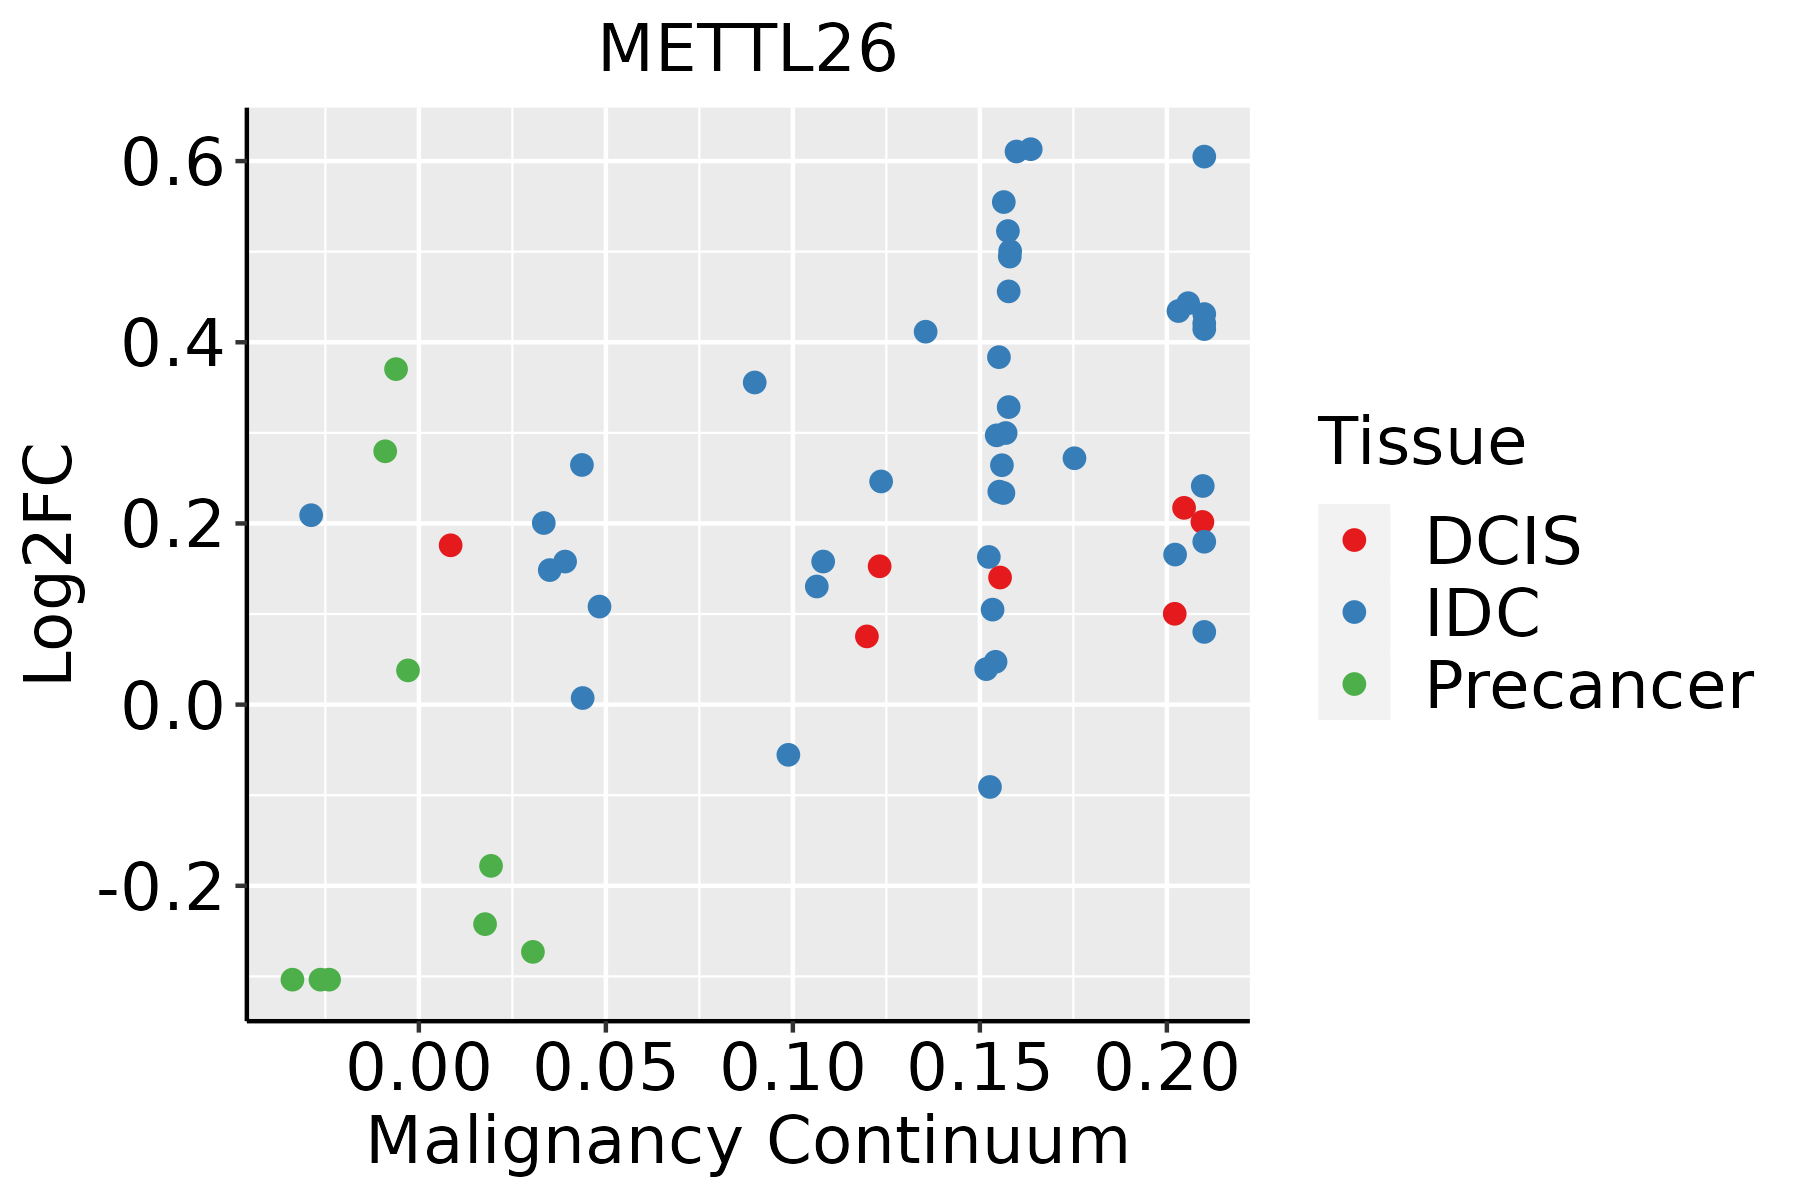 | IDC: Invasive ductal carcinoma |
| DCIS: Ductal carcinoma in situ | ||
| Precancer(BRCA1-mut): Precancerous lesion from BRCA1 mutation carriers | ||
| Esophagus | 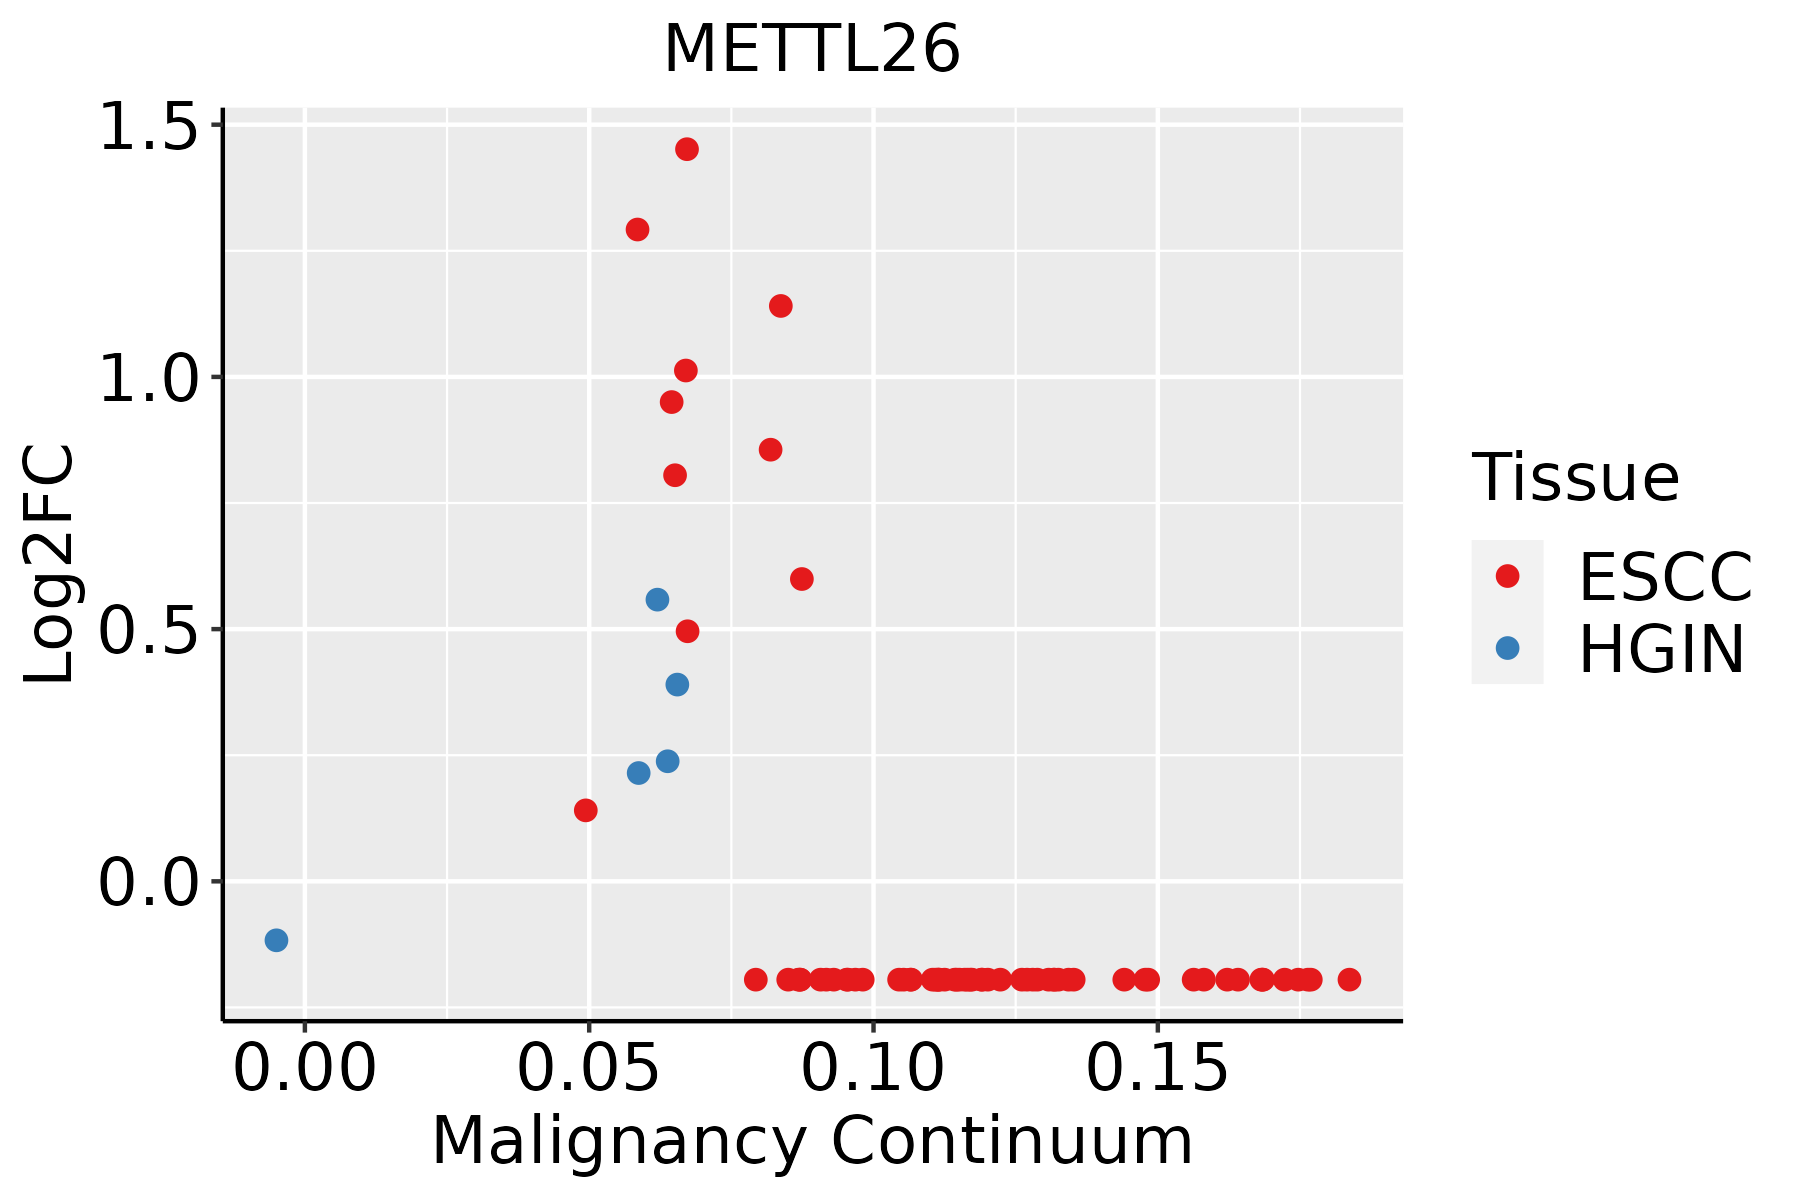 | ESCC: Esophageal squamous cell carcinoma |
| HGIN: High-grade intraepithelial neoplasias | ||
| LGIN: Low-grade intraepithelial neoplasias | ||
| Liver | 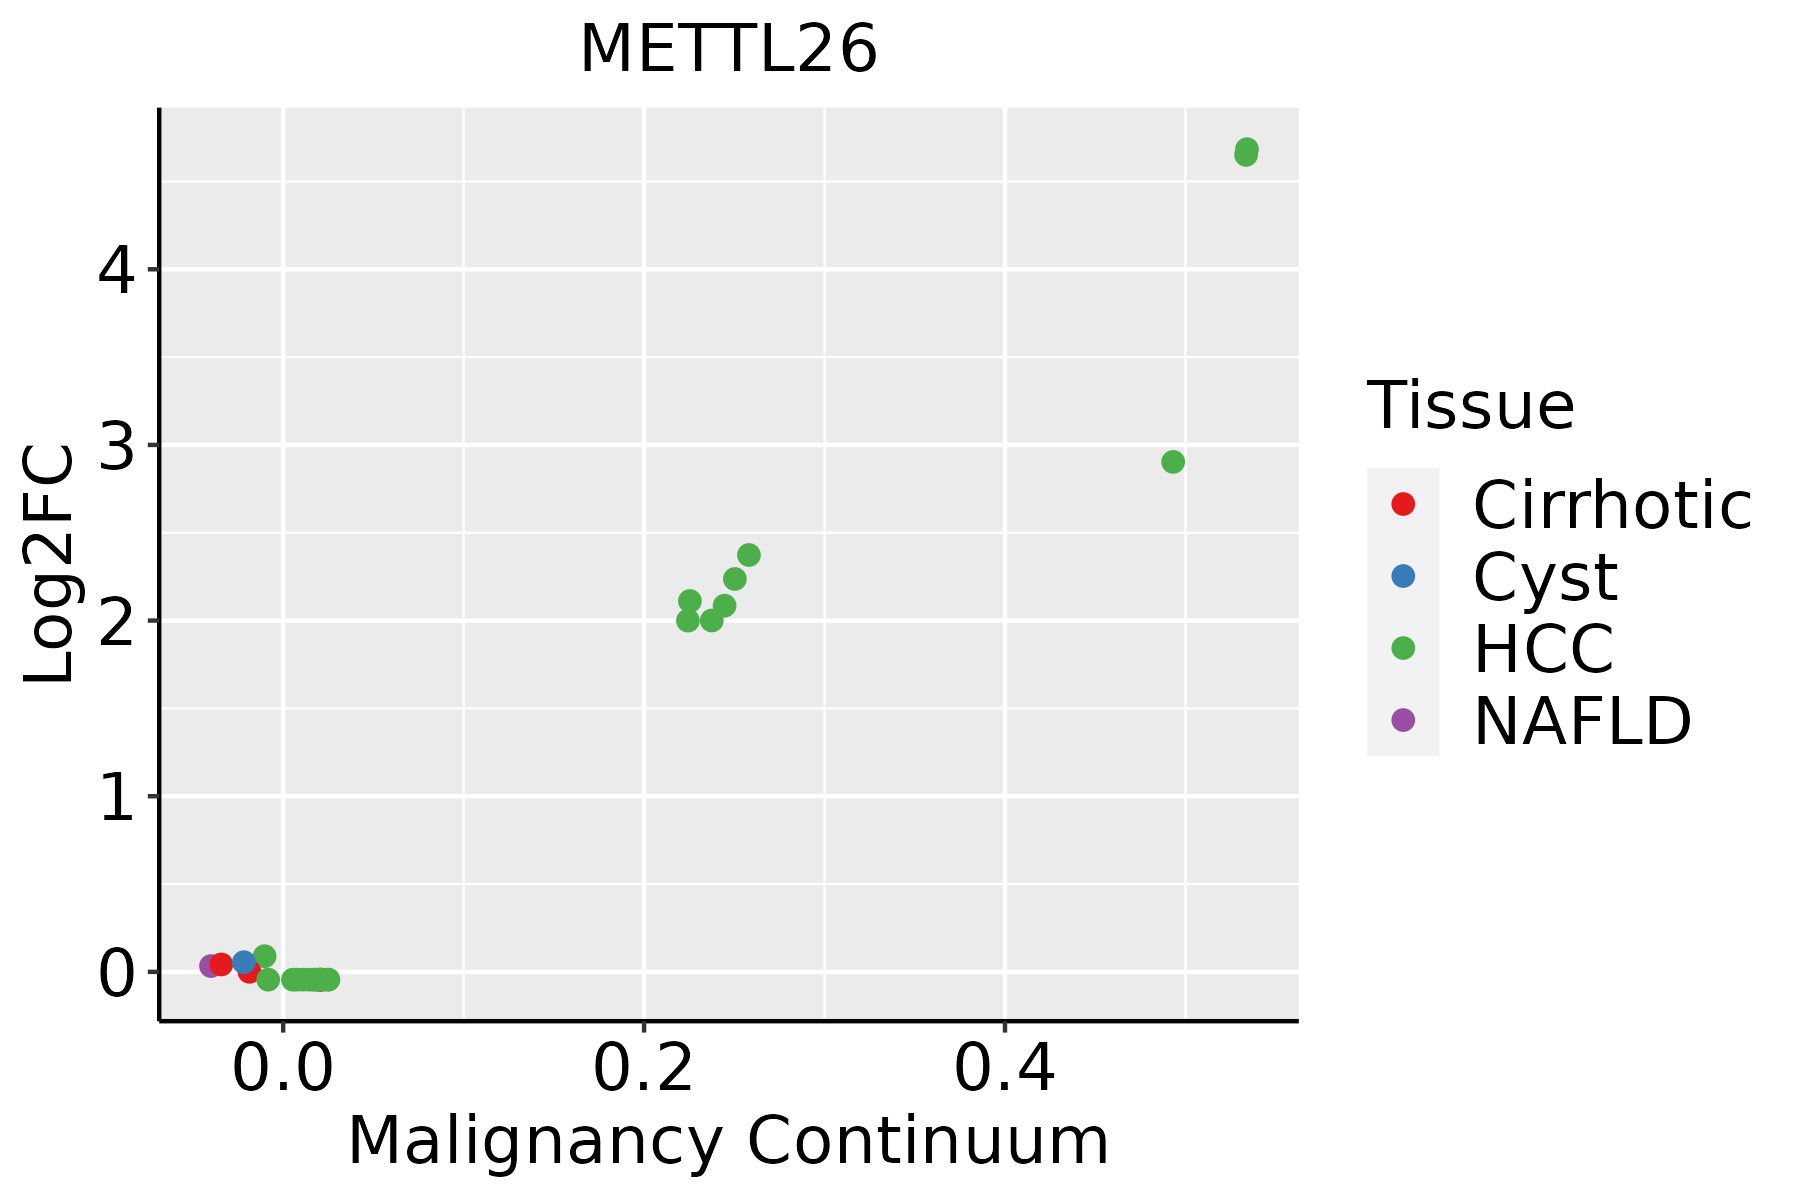 | HCC: Hepatocellular carcinoma |
| NAFLD: Non-alcoholic fatty liver disease | ||
| Thyroid |  | ATC: Anaplastic thyroid cancer |
| HT: Hashimoto's thyroiditis | ||
| PTC: Papillary thyroid cancer |
| ∗log2FC in expression of this searched gene in stem-like cells from each diseased tissue sample relative to stem-like cells in normal samples in each tissue plotted against the malignancy continuum. Samples are colored based on if they are from different disease stage. |
Top |
Malignant transformation related pathway analysis |
| Find out the enriched GO biological processes and KEGG pathways involved in transition from healthy to precancer to cancer |
| Tissue | Disease Stage | Enriched GO biological Processes |
| Colorectum | AD |  |
| Colorectum | SER |  |
| Colorectum | MSS |  |
| Colorectum | MSI-H |  |
| Colorectum | FAP |  |
| ∗Top 15 enriched GO BP terms are showed in the bar plot of each disease state in each tissue. Each row represents a significant GO biological process which is colored according to the -log10(p.adjust). |
| Page: 1 2 3 4 5 6 7 8 9 |
| GO ID | Tissue | Disease Stage | Description | Gene Ratio | Bg Ratio | pvalue | p.adjust | Count |
| Page: 1 |
| Pathway ID | Tissue | Disease Stage | Description | Gene Ratio | Bg Ratio | pvalue | p.adjust | qvalue | Count |
| Page: 1 |
Top |
Cell-cell communication analysis |
| Identification of potential cell-cell interactions between two cell types and their ligand-receptor pairs for different disease states |
| Ligand | Receptor | LRpair | Pathway | Tissue | Disease Stage |
| Page: 1 |
Top |
Single-cell gene regulatory network inference analysis |
| Find out the significant the regulons (TFs) and the target genes of each regulon across cell types for different disease states |
| TF | Cell Type | Tissue | Disease Stage | Target Gene | RSS | Regulon Activity |
| ∗The dot plots of a searched regulon are shown for all cell subpopulations in each disease state of each tissue based on the regulon specific score inferred using pySCENIC and by calculating the average expression. |
| Page: 1 |
Top |
Somatic mutation of malignant transformation related genes |
| Annotation of somatic variants for genes involved in malignant transformation |
| Hugo Symbol | Variant Class | Variant Classification | dbSNP RS | HGVSc | HGVSp | HGVSp Short | SWISSPROT | BIOTYPE | SIFT | PolyPhen | Tumor Sample Barcode | Tissue | Histology | Sex | Age | Stage | Therapy Types | Drugs | Outcome |
| METTL26 | SNV | Missense_Mutation | novel | c.416A>G | p.Tyr139Cys | p.Y139C | Q96S19 | protein_coding | deleterious(0.01) | probably_damaging(1) | TCGA-WT-AB41-01 | Breast | breast invasive carcinoma | Female | <65 | I/II | Chemotherapy | taxotere | CR |
| METTL26 | SNV | Missense_Mutation | c.532N>G | p.Leu178Val | p.L178V | Q96S19 | protein_coding | deleterious_low_confidence(0.01) | benign(0.031) | TCGA-MU-A51Y-01 | Cervix | cervical & endocervical cancer | Female | <65 | I/II | Unknown | Unknown | SD | |
| METTL26 | SNV | Missense_Mutation | rs142689363 | c.512N>A | p.Ser171Asn | p.S171N | Q96S19 | protein_coding | tolerated_low_confidence(0.16) | possibly_damaging(0.474) | TCGA-AA-3672-01 | Colorectum | colon adenocarcinoma | Female | >=65 | III/IV | Unknown | Unknown | SD |
| METTL26 | SNV | Missense_Mutation | novel | c.305T>C | p.Leu102Pro | p.L102P | Q96S19 | protein_coding | deleterious(0.03) | probably_damaging(0.946) | TCGA-AZ-6598-01 | Colorectum | colon adenocarcinoma | Female | >=65 | I/II | Unknown | Unknown | SD |
| METTL26 | SNV | Missense_Mutation | novel | c.269G>A | p.Gly90Asp | p.G90D | Q96S19 | protein_coding | tolerated(0.87) | benign(0) | TCGA-D1-A15X-01 | Endometrium | uterine corpus endometrioid carcinoma | Female | <65 | I/II | Unknown | Unknown | SD |
| Page: 1 |
Top |
Related drugs of malignant transformation related genes |
| Identification of chemicals and drugs interact with genes involved in malignant transfromation |
| (DGIdb 4.0) |
| Entrez ID | Symbol | Category | Interaction Types | Drug Claim Name | Drug Name | PMIDs |
| Page: 1 |

Copyright 2023-Present -The University of Texas Health Science Center at Houston |