
|
|||||
|
 | |
| |
| |
| |
| |
| |
|
Gene: METTL21B |
Gene summary for METTL21B |
| Gene information | Species | Human | Gene symbol | METTL21B | Gene ID | 25895 |
| Gene name | EEF1A lysine methyltransferase 3 | |
| Gene Alias | FAM119B | |
| Cytomap | 12q14.1 | |
| Gene Type | protein-coding | GO ID | GO:0006464 | UniProtAcc | Q96AZ1 |
Top |
Malignant transformation analysis |
| Identification of the aberrant gene expression in precancerous and cancerous lesions by comparing the gene expression of stem-like cells in diseased tissues with normal stem cells |
| Entrez ID | Symbol | Replicates | Species | Organ | Tissue | Adj P-value | Log2FC | Malignancy |
| 25895 | METTL21B | P2T-E | Human | Esophagus | ESCC | 1.48e-19 | 2.24e-01 | 0.1177 |
| 25895 | METTL21B | P4T-E | Human | Esophagus | ESCC | 6.63e-11 | 9.98e-02 | 0.1323 |
| 25895 | METTL21B | P5T-E | Human | Esophagus | ESCC | 1.51e-09 | 4.70e-02 | 0.1327 |
| 25895 | METTL21B | P8T-E | Human | Esophagus | ESCC | 7.82e-05 | 9.21e-02 | 0.0889 |
| 25895 | METTL21B | P10T-E | Human | Esophagus | ESCC | 1.18e-18 | 1.25e-01 | 0.116 |
| 25895 | METTL21B | P11T-E | Human | Esophagus | ESCC | 2.98e-04 | 2.08e-01 | 0.1426 |
| 25895 | METTL21B | P12T-E | Human | Esophagus | ESCC | 1.28e-20 | 1.74e-01 | 0.1122 |
| 25895 | METTL21B | P16T-E | Human | Esophagus | ESCC | 7.73e-15 | 2.04e-01 | 0.1153 |
| 25895 | METTL21B | P20T-E | Human | Esophagus | ESCC | 9.56e-03 | 9.69e-02 | 0.1124 |
| 25895 | METTL21B | P21T-E | Human | Esophagus | ESCC | 2.63e-12 | 8.05e-02 | 0.1617 |
| 25895 | METTL21B | P22T-E | Human | Esophagus | ESCC | 2.73e-07 | 8.05e-02 | 0.1236 |
| 25895 | METTL21B | P23T-E | Human | Esophagus | ESCC | 5.06e-09 | 2.06e-01 | 0.108 |
| 25895 | METTL21B | P24T-E | Human | Esophagus | ESCC | 8.56e-04 | 9.30e-02 | 0.1287 |
| 25895 | METTL21B | P26T-E | Human | Esophagus | ESCC | 7.72e-09 | 7.06e-02 | 0.1276 |
| 25895 | METTL21B | P27T-E | Human | Esophagus | ESCC | 6.71e-10 | 1.10e-01 | 0.1055 |
| 25895 | METTL21B | P28T-E | Human | Esophagus | ESCC | 1.89e-04 | 4.08e-02 | 0.1149 |
| 25895 | METTL21B | P30T-E | Human | Esophagus | ESCC | 1.90e-04 | 2.25e-01 | 0.137 |
| 25895 | METTL21B | P31T-E | Human | Esophagus | ESCC | 3.40e-05 | 3.63e-02 | 0.1251 |
| 25895 | METTL21B | P32T-E | Human | Esophagus | ESCC | 1.26e-03 | 6.41e-02 | 0.1666 |
| 25895 | METTL21B | P36T-E | Human | Esophagus | ESCC | 8.94e-09 | 1.94e-01 | 0.1187 |
| Page: 1 2 3 |
| Tissue | Expression Dynamics | Abbreviation |
| Esophagus | 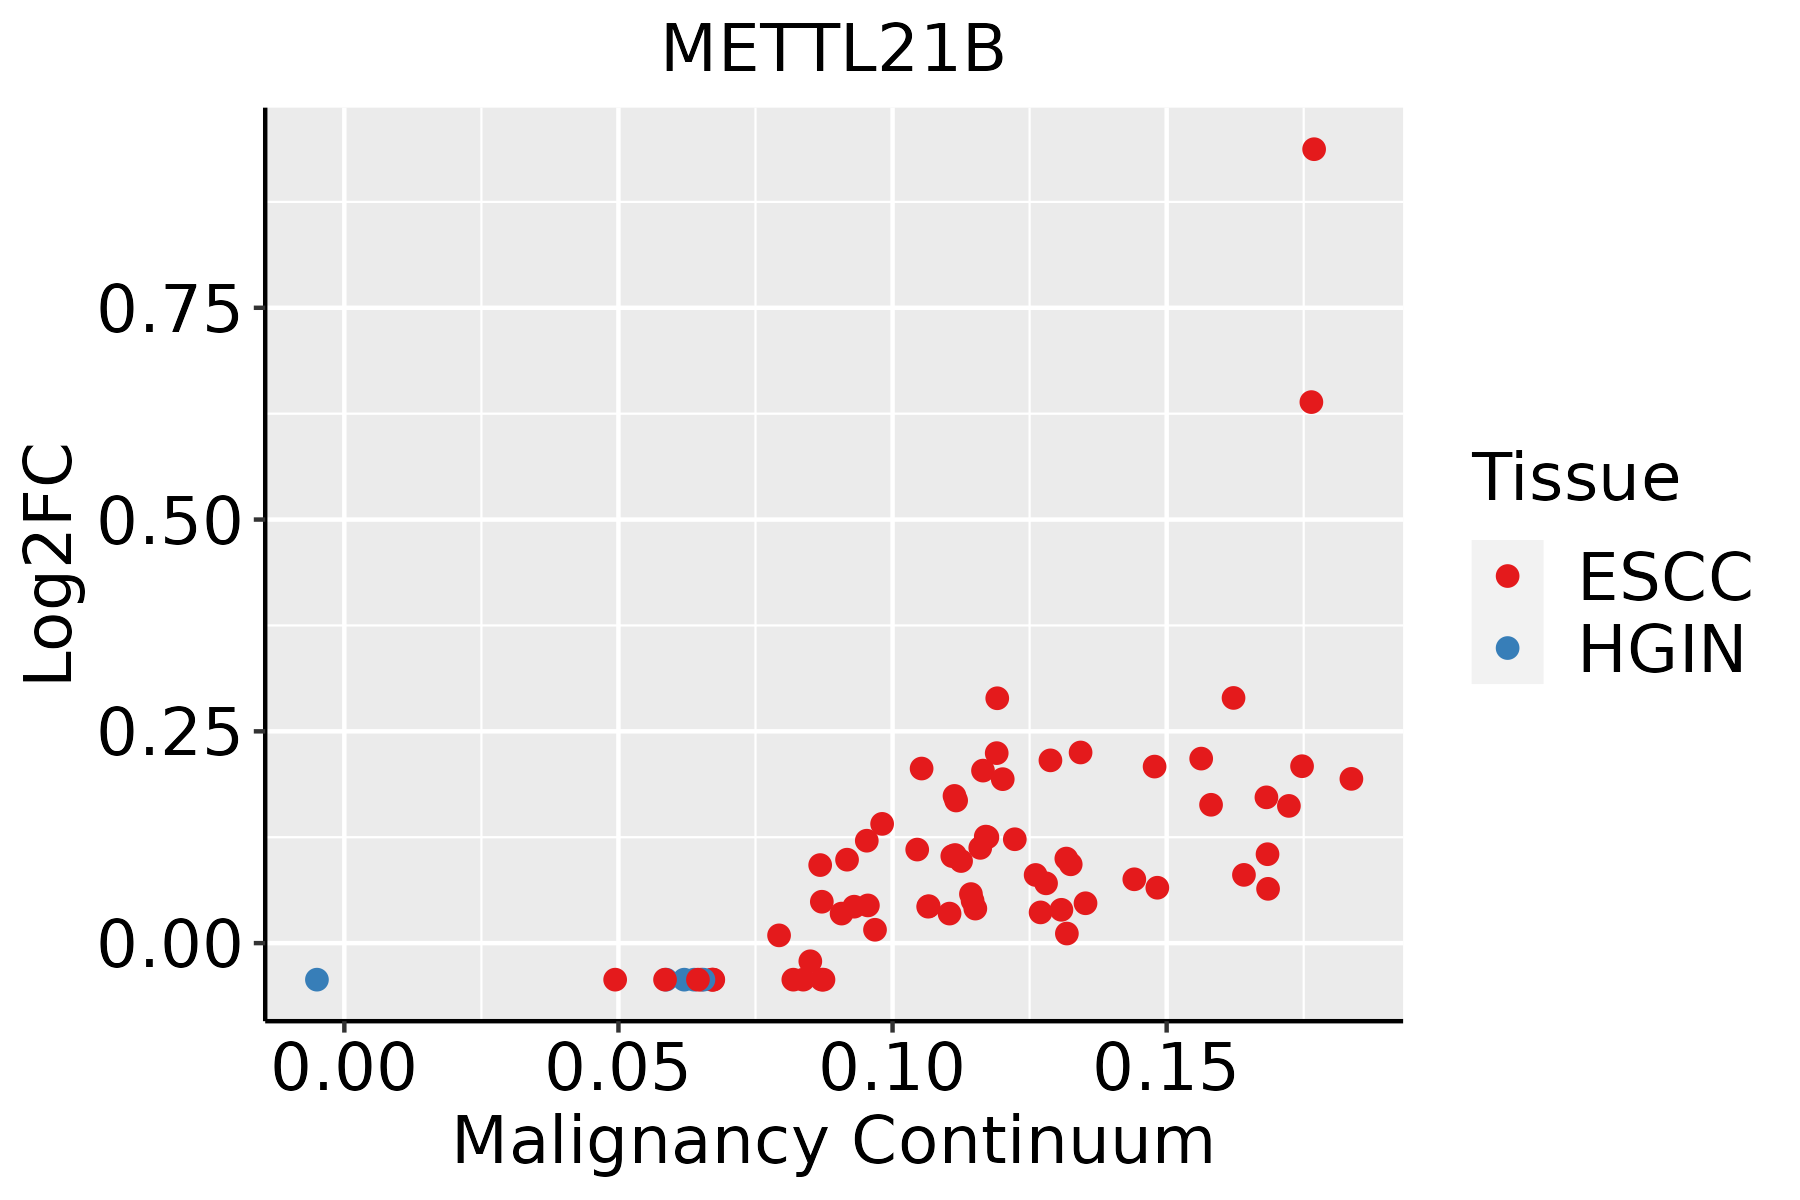 | ESCC: Esophageal squamous cell carcinoma |
| HGIN: High-grade intraepithelial neoplasias | ||
| LGIN: Low-grade intraepithelial neoplasias |
| ∗log2FC in expression of this searched gene in stem-like cells from each diseased tissue sample relative to stem-like cells in normal samples in each tissue plotted against the malignancy continuum. Samples are colored based on if they are from different disease stage. |
Top |
Malignant transformation related pathway analysis |
| Find out the enriched GO biological processes and KEGG pathways involved in transition from healthy to precancer to cancer |
| Tissue | Disease Stage | Enriched GO biological Processes |
| Colorectum | AD |  |
| Colorectum | SER |  |
| Colorectum | MSS |  |
| Colorectum | MSI-H |  |
| Colorectum | FAP |  |
| ∗Top 15 enriched GO BP terms are showed in the bar plot of each disease state in each tissue. Each row represents a significant GO biological process which is colored according to the -log10(p.adjust). |
| Page: 1 2 3 4 5 6 7 8 9 |
| GO ID | Tissue | Disease Stage | Description | Gene Ratio | Bg Ratio | pvalue | p.adjust | Count |
| Page: 1 |
| Pathway ID | Tissue | Disease Stage | Description | Gene Ratio | Bg Ratio | pvalue | p.adjust | qvalue | Count |
| Page: 1 |
Top |
Cell-cell communication analysis |
| Identification of potential cell-cell interactions between two cell types and their ligand-receptor pairs for different disease states |
| Ligand | Receptor | LRpair | Pathway | Tissue | Disease Stage |
| Page: 1 |
Top |
Single-cell gene regulatory network inference analysis |
| Find out the significant the regulons (TFs) and the target genes of each regulon across cell types for different disease states |
| TF | Cell Type | Tissue | Disease Stage | Target Gene | RSS | Regulon Activity |
| ∗The dot plots of a searched regulon are shown for all cell subpopulations in each disease state of each tissue based on the regulon specific score inferred using pySCENIC and by calculating the average expression. |
| Page: 1 |
Top |
Somatic mutation of malignant transformation related genes |
| Annotation of somatic variants for genes involved in malignant transformation |
| Hugo Symbol | Variant Class | Variant Classification | dbSNP RS | HGVSc | HGVSp | HGVSp Short | SWISSPROT | BIOTYPE | SIFT | PolyPhen | Tumor Sample Barcode | Tissue | Histology | Sex | Age | Stage | Therapy Types | Drugs | Outcome |
| METTL21B | SNV | Missense_Mutation | novel | c.631N>A | p.Glu211Lys | p.E211K | Q96AZ1 | protein_coding | tolerated(0.56) | benign(0.01) | TCGA-3C-AALI-01 | Breast | breast invasive carcinoma | Female | <65 | I/II | Unspecific | Poly E | Complete Response |
| METTL21B | SNV | Missense_Mutation | novel | c.549N>C | p.Arg183Ser | p.R183S | Q96AZ1 | protein_coding | deleterious(0) | probably_damaging(0.999) | TCGA-AN-A046-01 | Breast | breast invasive carcinoma | Female | >=65 | I/II | Unknown | Unknown | SD |
| METTL21B | insertion | In_Frame_Ins | novel | c.235_236insGATGGCGGACCCCGGCCCAGATCCCGAATC | p.Val79delinsGlyTrpArgThrProAlaGlnIleProAsnLeu | p.V79delinsGWRTPAQIPNL | Q96AZ1 | protein_coding | TCGA-AR-A0TY-01 | Breast | breast invasive carcinoma | Female | <65 | I/II | Unspecific | Paclitaxel | PD | ||
| METTL21B | SNV | Missense_Mutation | novel | c.368N>C | p.Gly123Ala | p.G123A | Q96AZ1 | protein_coding | tolerated(0.8) | benign(0.103) | TCGA-AA-A02J-01 | Colorectum | colon adenocarcinoma | Female | >=65 | III/IV | Unknown | Unknown | PD |
| METTL21B | SNV | Missense_Mutation | c.356A>T | p.Asn119Ile | p.N119I | Q96AZ1 | protein_coding | deleterious(0) | probably_damaging(1) | TCGA-F4-6806-01 | Colorectum | colon adenocarcinoma | Female | <65 | I/II | Chemotherapy | irinotecan | PD | |
| METTL21B | SNV | Missense_Mutation | novel | c.233N>C | p.Lys78Thr | p.K78T | Q96AZ1 | protein_coding | deleterious(0.04) | possibly_damaging(0.772) | TCGA-F5-6814-01 | Colorectum | rectum adenocarcinoma | Male | <65 | I/II | Unknown | Unknown | SD |
| METTL21B | SNV | Missense_Mutation | novel | c.505N>A | p.Leu169Met | p.L169M | Q96AZ1 | protein_coding | deleterious(0) | probably_damaging(0.999) | TCGA-AJ-A3BH-01 | Endometrium | uterine corpus endometrioid carcinoma | Female | Unknown | I/II | Unknown | Unknown | SD |
| METTL21B | SNV | Missense_Mutation | rs745316941 | c.386N>A | p.Arg129His | p.R129H | Q96AZ1 | protein_coding | tolerated(0.55) | possibly_damaging(0.636) | TCGA-B5-A3FC-01 | Endometrium | uterine corpus endometrioid carcinoma | Female | <65 | I/II | Unknown | Unknown | SD |
| METTL21B | SNV | Missense_Mutation | novel | c.115N>A | p.Val39Met | p.V39M | Q96AZ1 | protein_coding | tolerated(0.09) | benign(0.007) | TCGA-D1-A103-01 | Endometrium | uterine corpus endometrioid carcinoma | Female | >=65 | I/II | Unknown | Unknown | SD |
| METTL21B | SNV | Missense_Mutation | rs113145238 | c.356N>G | p.Asn119Ser | p.N119S | Q96AZ1 | protein_coding | deleterious(0) | probably_damaging(0.998) | TCGA-EO-A22X-01 | Endometrium | uterine corpus endometrioid carcinoma | Female | <65 | III/IV | Unspecific | Carboplatin | Complete Response |
| Page: 1 2 |
Top |
Related drugs of malignant transformation related genes |
| Identification of chemicals and drugs interact with genes involved in malignant transfromation |
| (DGIdb 4.0) |
| Entrez ID | Symbol | Category | Interaction Types | Drug Claim Name | Drug Name | PMIDs |
| Page: 1 |

Copyright 2023-Present -The University of Texas Health Science Center at Houston |