
|
|||||
|
 | |
| |
| |
| |
| |
| |
|
Gene: METTL15 |
Gene summary for METTL15 |
| Gene information | Species | Human | Gene symbol | METTL15 | Gene ID | 196074 |
| Gene name | methyltransferase like 15 | |
| Gene Alias | METT5D1 | |
| Cytomap | 11p14.1 | |
| Gene Type | protein-coding | GO ID | GO:0000154 | UniProtAcc | A6NJ78 |
Top |
Malignant transformation analysis |
| Identification of the aberrant gene expression in precancerous and cancerous lesions by comparing the gene expression of stem-like cells in diseased tissues with normal stem cells |
| Entrez ID | Symbol | Replicates | Species | Organ | Tissue | Adj P-value | Log2FC | Malignancy |
| 196074 | METTL15 | HTA11_3410_2000001011 | Human | Colorectum | AD | 2.43e-20 | -6.58e-01 | 0.0155 |
| 196074 | METTL15 | HTA11_2487_2000001011 | Human | Colorectum | SER | 3.41e-03 | -4.74e-01 | -0.1808 |
| 196074 | METTL15 | HTA11_3361_2000001011 | Human | Colorectum | AD | 7.69e-10 | -5.54e-01 | -0.1207 |
| 196074 | METTL15 | HTA11_696_2000001011 | Human | Colorectum | AD | 3.14e-07 | -3.49e-01 | -0.1464 |
| 196074 | METTL15 | HTA11_866_2000001011 | Human | Colorectum | AD | 1.82e-09 | -3.29e-01 | -0.1001 |
| 196074 | METTL15 | HTA11_866_3004761011 | Human | Colorectum | AD | 1.08e-15 | -6.38e-01 | 0.096 |
| 196074 | METTL15 | HTA11_8622_2000001021 | Human | Colorectum | SER | 1.40e-05 | -6.46e-01 | 0.0528 |
| 196074 | METTL15 | HTA11_6801_2000001011 | Human | Colorectum | SER | 2.24e-02 | -4.25e-01 | 0.0171 |
| 196074 | METTL15 | HTA11_6818_2000001021 | Human | Colorectum | AD | 4.59e-08 | 7.02e-01 | 0.0588 |
| 196074 | METTL15 | HTA11_99999970781_79442 | Human | Colorectum | MSS | 1.55e-03 | -3.11e-01 | 0.294 |
| 196074 | METTL15 | HTA11_99999974143_84620 | Human | Colorectum | MSS | 1.31e-29 | -6.76e-01 | 0.3005 |
| 196074 | METTL15 | F007 | Human | Colorectum | FAP | 3.24e-03 | -2.25e-01 | 0.1176 |
| 196074 | METTL15 | A001-C-207 | Human | Colorectum | FAP | 1.53e-02 | -1.10e-01 | 0.1278 |
| 196074 | METTL15 | A015-C-203 | Human | Colorectum | FAP | 6.10e-32 | -4.92e-01 | -0.1294 |
| 196074 | METTL15 | A015-C-204 | Human | Colorectum | FAP | 1.67e-08 | -3.66e-01 | -0.0228 |
| 196074 | METTL15 | A014-C-040 | Human | Colorectum | FAP | 6.19e-08 | -6.20e-01 | -0.1184 |
| 196074 | METTL15 | A002-C-201 | Human | Colorectum | FAP | 1.41e-16 | -3.56e-01 | 0.0324 |
| 196074 | METTL15 | A002-C-203 | Human | Colorectum | FAP | 7.45e-03 | 2.29e-02 | 0.2786 |
| 196074 | METTL15 | A001-C-119 | Human | Colorectum | FAP | 5.01e-13 | -5.92e-01 | -0.1557 |
| 196074 | METTL15 | A001-C-108 | Human | Colorectum | FAP | 7.34e-20 | -4.23e-01 | -0.0272 |
| Page: 1 2 3 4 5 6 7 |
| Tissue | Expression Dynamics | Abbreviation |
| Colorectum (GSE201348) |  | FAP: Familial adenomatous polyposis |
| CRC: Colorectal cancer | ||
| Colorectum (HTA11) | 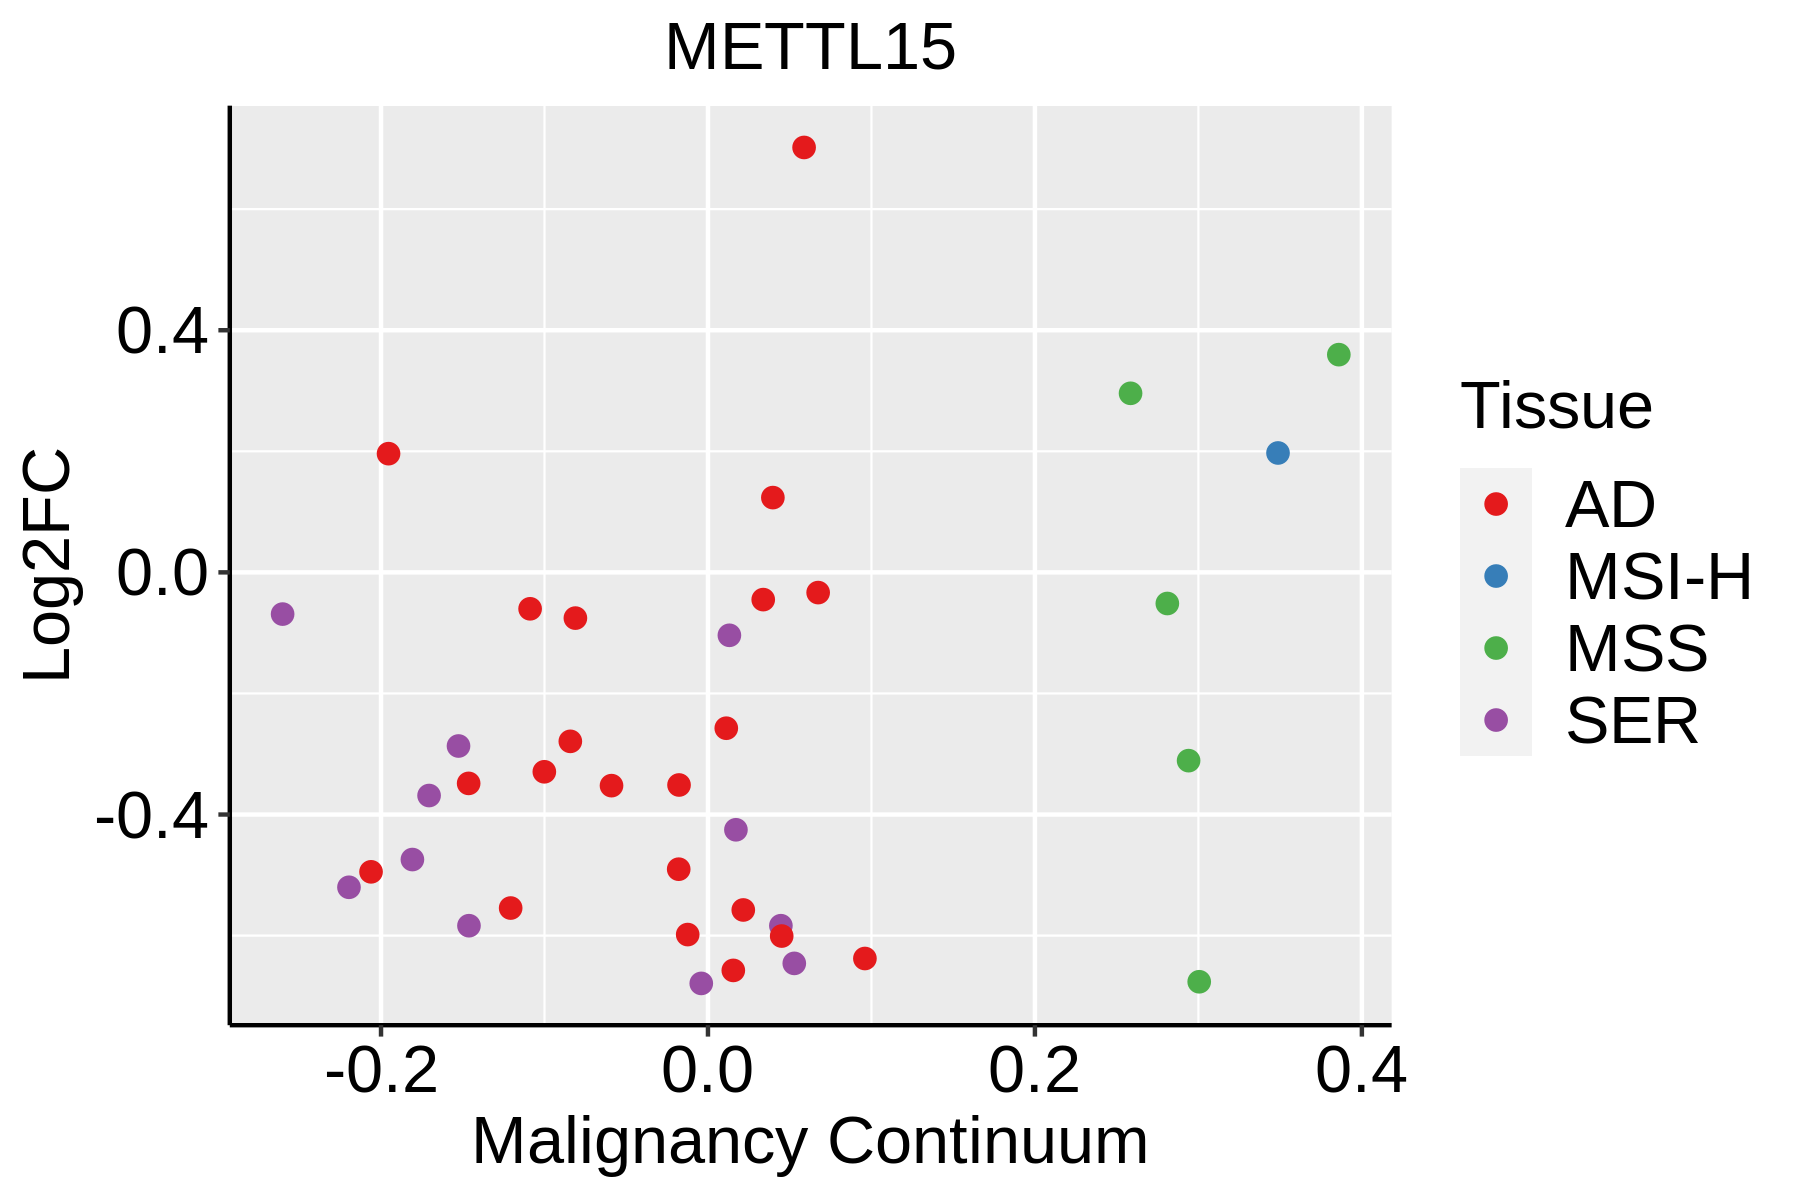 | AD: Adenomas |
| SER: Sessile serrated lesions | ||
| MSI-H: Microsatellite-high colorectal cancer | ||
| MSS: Microsatellite stable colorectal cancer | ||
| Endometrium |  | AEH: Atypical endometrial hyperplasia |
| EEC: Endometrioid Cancer | ||
| Esophagus |  | ESCC: Esophageal squamous cell carcinoma |
| HGIN: High-grade intraepithelial neoplasias | ||
| LGIN: Low-grade intraepithelial neoplasias | ||
| Lung | 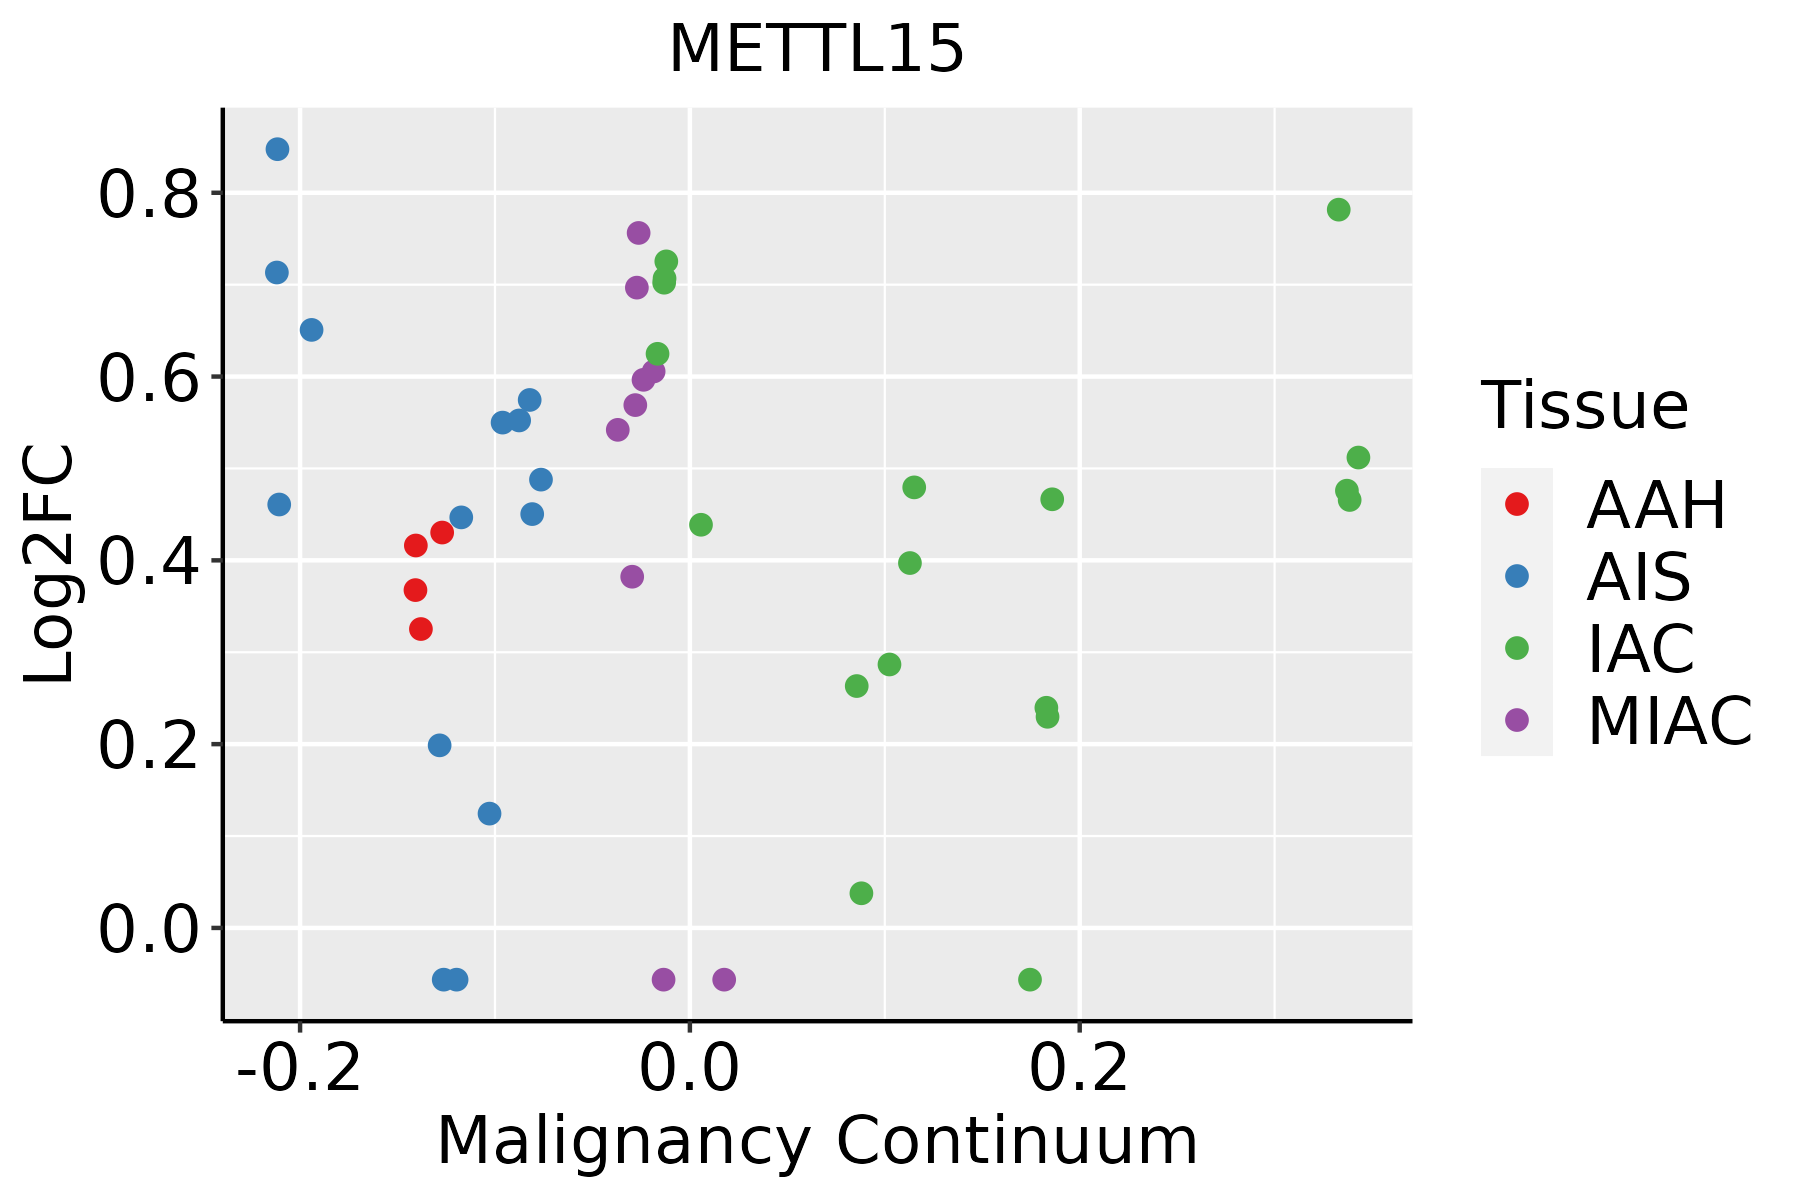 | AAH: Atypical adenomatous hyperplasia |
| AIS: Adenocarcinoma in situ | ||
| IAC: Invasive lung adenocarcinoma | ||
| MIA: Minimally invasive adenocarcinoma | ||
| Oral Cavity |  | EOLP: Erosive Oral lichen planus |
| LP: leukoplakia | ||
| NEOLP: Non-erosive oral lichen planus | ||
| OSCC: Oral squamous cell carcinoma |
| ∗log2FC in expression of this searched gene in stem-like cells from each diseased tissue sample relative to stem-like cells in normal samples in each tissue plotted against the malignancy continuum. Samples are colored based on if they are from different disease stage. |
Top |
Malignant transformation related pathway analysis |
| Find out the enriched GO biological processes and KEGG pathways involved in transition from healthy to precancer to cancer |
| Tissue | Disease Stage | Enriched GO biological Processes |
| Colorectum | AD |  |
| Colorectum | SER |  |
| Colorectum | MSS |  |
| Colorectum | MSI-H |  |
| Colorectum | FAP |  |
| ∗Top 15 enriched GO BP terms are showed in the bar plot of each disease state in each tissue. Each row represents a significant GO biological process which is colored according to the -log10(p.adjust). |
| Page: 1 2 3 4 5 6 7 8 9 |
| GO ID | Tissue | Disease Stage | Description | Gene Ratio | Bg Ratio | pvalue | p.adjust | Count |
| GO:0022613 | Colorectum | AD | ribonucleoprotein complex biogenesis | 151/3918 | 463/18723 | 1.96e-09 | 1.39e-07 | 151 |
| GO:0042254 | Colorectum | AD | ribosome biogenesis | 84/3918 | 299/18723 | 1.82e-03 | 1.50e-02 | 84 |
| GO:00226131 | Colorectum | SER | ribonucleoprotein complex biogenesis | 112/2897 | 463/18723 | 5.01e-07 | 2.48e-05 | 112 |
| GO:00422541 | Colorectum | SER | ribosome biogenesis | 66/2897 | 299/18723 | 1.48e-03 | 1.60e-02 | 66 |
| GO:00226132 | Colorectum | MSS | ribonucleoprotein complex biogenesis | 144/3467 | 463/18723 | 2.76e-11 | 3.67e-09 | 144 |
| GO:00422542 | Colorectum | MSS | ribosome biogenesis | 79/3467 | 299/18723 | 4.32e-04 | 5.23e-03 | 79 |
| GO:0006364 | Colorectum | MSS | rRNA processing | 58/3467 | 225/18723 | 4.17e-03 | 3.03e-02 | 58 |
| GO:0016072 | Colorectum | MSS | rRNA metabolic process | 60/3467 | 236/18723 | 5.01e-03 | 3.46e-02 | 60 |
| GO:00226134 | Colorectum | FAP | ribonucleoprotein complex biogenesis | 91/2622 | 463/18723 | 4.28e-04 | 5.12e-03 | 91 |
| GO:00226135 | Colorectum | CRC | ribonucleoprotein complex biogenesis | 76/2078 | 463/18723 | 3.04e-04 | 4.78e-03 | 76 |
| GO:002261316 | Endometrium | AEH | ribonucleoprotein complex biogenesis | 107/2100 | 463/18723 | 1.43e-13 | 4.08e-11 | 107 |
| GO:004225416 | Endometrium | AEH | ribosome biogenesis | 67/2100 | 299/18723 | 1.95e-08 | 1.18e-06 | 67 |
| GO:00063648 | Endometrium | AEH | rRNA processing | 47/2100 | 225/18723 | 1.78e-05 | 3.65e-04 | 47 |
| GO:00160728 | Endometrium | AEH | rRNA metabolic process | 48/2100 | 236/18723 | 3.01e-05 | 5.54e-04 | 48 |
| GO:00344707 | Endometrium | AEH | ncRNA processing | 62/2100 | 395/18723 | 3.93e-03 | 2.65e-02 | 62 |
| GO:002261317 | Endometrium | EEC | ribonucleoprotein complex biogenesis | 108/2168 | 463/18723 | 4.60e-13 | 9.86e-11 | 108 |
| GO:004225417 | Endometrium | EEC | ribosome biogenesis | 68/2168 | 299/18723 | 2.90e-08 | 1.68e-06 | 68 |
| GO:000636416 | Endometrium | EEC | rRNA processing | 48/2168 | 225/18723 | 1.88e-05 | 3.50e-04 | 48 |
| GO:001607216 | Endometrium | EEC | rRNA metabolic process | 49/2168 | 236/18723 | 3.27e-05 | 5.62e-04 | 49 |
| GO:003447012 | Endometrium | EEC | ncRNA processing | 63/2168 | 395/18723 | 5.20e-03 | 3.26e-02 | 63 |
| Page: 1 2 3 |
| Pathway ID | Tissue | Disease Stage | Description | Gene Ratio | Bg Ratio | pvalue | p.adjust | qvalue | Count |
| Page: 1 |
Top |
Cell-cell communication analysis |
| Identification of potential cell-cell interactions between two cell types and their ligand-receptor pairs for different disease states |
| Ligand | Receptor | LRpair | Pathway | Tissue | Disease Stage |
| Page: 1 |
Top |
Single-cell gene regulatory network inference analysis |
| Find out the significant the regulons (TFs) and the target genes of each regulon across cell types for different disease states |
| TF | Cell Type | Tissue | Disease Stage | Target Gene | RSS | Regulon Activity |
| ∗The dot plots of a searched regulon are shown for all cell subpopulations in each disease state of each tissue based on the regulon specific score inferred using pySCENIC and by calculating the average expression. |
| Page: 1 |
Top |
Somatic mutation of malignant transformation related genes |
| Annotation of somatic variants for genes involved in malignant transformation |
| Hugo Symbol | Variant Class | Variant Classification | dbSNP RS | HGVSc | HGVSp | HGVSp Short | SWISSPROT | BIOTYPE | SIFT | PolyPhen | Tumor Sample Barcode | Tissue | Histology | Sex | Age | Stage | Therapy Types | Drugs | Outcome |
| METTL15 | SNV | Missense_Mutation | rs546057534 | c.157N>G | p.Gln53Glu | p.Q53E | A6NJ78 | protein_coding | tolerated_low_confidence(1) | benign(0) | TCGA-A1-A0SH-01 | Breast | breast invasive carcinoma | Female | <65 | I/II | Chemotherapy | tc | SD |
| METTL15 | SNV | Missense_Mutation | novel | c.999G>T | p.Leu333Phe | p.L333F | A6NJ78 | protein_coding | tolerated(0.14) | possibly_damaging(0.721) | TCGA-A2-A1FX-01 | Breast | breast invasive carcinoma | Female | <65 | III/IV | Chemotherapy | taxotere | SD |
| METTL15 | SNV | Missense_Mutation | novel | c.862N>T | p.Leu288Phe | p.L288F | A6NJ78 | protein_coding | tolerated(0.12) | benign(0.367) | TCGA-C5-A901-01 | Cervix | cervical & endocervical cancer | Female | <65 | I/II | Unknown | Unknown | SD |
| METTL15 | SNV | Missense_Mutation | novel | c.794N>T | p.Ser265Phe | p.S265F | A6NJ78 | protein_coding | deleterious(0) | possibly_damaging(0.878) | TCGA-UC-A7PG-06 | Cervix | cervical & endocervical cancer | Female | <65 | III/IV | Chemotherapy | cisplatin | PD |
| METTL15 | SNV | Missense_Mutation | c.518N>A | p.Ser173Tyr | p.S173Y | A6NJ78 | protein_coding | deleterious(0) | probably_damaging(1) | TCGA-A6-A56B-01 | Colorectum | colon adenocarcinoma | Male | <65 | III/IV | Chemotherapy | fluorouracil | PD | |
| METTL15 | SNV | Missense_Mutation | c.602N>G | p.Tyr201Cys | p.Y201C | A6NJ78 | protein_coding | tolerated(0.21) | benign(0.026) | TCGA-AA-3966-01 | Colorectum | colon adenocarcinoma | Female | >=65 | I/II | Unknown | Unknown | SD | |
| METTL15 | SNV | Missense_Mutation | novel | c.1081N>A | p.Glu361Lys | p.E361K | A6NJ78 | protein_coding | tolerated(0.09) | benign(0.019) | TCGA-AA-3984-01 | Colorectum | colon adenocarcinoma | Female | <65 | I/II | Unknown | Unknown | SD |
| METTL15 | SNV | Missense_Mutation | c.651N>T | p.Gln217His | p.Q217H | A6NJ78 | protein_coding | deleterious(0.01) | benign(0.015) | TCGA-AM-5821-01 | Colorectum | colon adenocarcinoma | Female | >=65 | I/II | Unknown | Unknown | SD | |
| METTL15 | SNV | Missense_Mutation | rs549371768 | c.902N>T | p.Thr301Met | p.T301M | A6NJ78 | protein_coding | tolerated(0.21) | benign(0.085) | TCGA-AY-6197-01 | Colorectum | colon adenocarcinoma | Male | <65 | I/II | Unknown | Unknown | SD |
| METTL15 | SNV | Missense_Mutation | rs753752723 | c.523A>G | p.Met175Val | p.M175V | A6NJ78 | protein_coding | deleterious(0) | probably_damaging(0.93) | TCGA-DM-A1HB-01 | Colorectum | colon adenocarcinoma | Male | >=65 | III/IV | Unknown | Unknown | SD |
| Page: 1 2 3 4 |
Top |
Related drugs of malignant transformation related genes |
| Identification of chemicals and drugs interact with genes involved in malignant transfromation |
| (DGIdb 4.0) |
| Entrez ID | Symbol | Category | Interaction Types | Drug Claim Name | Drug Name | PMIDs |
| Page: 1 |

Copyright 2023-Present -The University of Texas Health Science Center at Houston |