
|
|||||
|
 | |
| |
| |
| |
| |
| |
|
Gene: METRN |
Gene summary for METRN |
| Gene information | Species | Human | Gene symbol | METRN | Gene ID | 79006 |
| Gene name | meteorin, glial cell differentiation regulator | |
| Gene Alias | C16orf23 | |
| Cytomap | 16p13.3 | |
| Gene Type | protein-coding | GO ID | GO:0000902 | UniProtAcc | Q9UJH8 |
Top |
Malignant transformation analysis |
| Identification of the aberrant gene expression in precancerous and cancerous lesions by comparing the gene expression of stem-like cells in diseased tissues with normal stem cells |
| Entrez ID | Symbol | Replicates | Species | Organ | Tissue | Adj P-value | Log2FC | Malignancy |
| 79006 | METRN | GSM4909285 | Human | Breast | IDC | 1.72e-05 | -1.87e-01 | 0.21 |
| 79006 | METRN | GSM4909291 | Human | Breast | IDC | 2.13e-08 | 3.98e-01 | 0.1753 |
| 79006 | METRN | GSM4909293 | Human | Breast | IDC | 3.34e-31 | 6.93e-01 | 0.1581 |
| 79006 | METRN | GSM4909294 | Human | Breast | IDC | 2.57e-19 | 6.32e-01 | 0.2022 |
| 79006 | METRN | GSM4909298 | Human | Breast | IDC | 1.40e-20 | 4.01e-01 | 0.1551 |
| 79006 | METRN | GSM4909302 | Human | Breast | IDC | 4.20e-07 | 3.33e-01 | 0.1545 |
| 79006 | METRN | GSM4909304 | Human | Breast | IDC | 2.02e-128 | 1.49e+00 | 0.1636 |
| 79006 | METRN | GSM4909306 | Human | Breast | IDC | 1.61e-26 | 6.55e-01 | 0.1564 |
| 79006 | METRN | GSM4909311 | Human | Breast | IDC | 2.85e-06 | -3.35e-02 | 0.1534 |
| 79006 | METRN | GSM4909315 | Human | Breast | IDC | 1.53e-05 | 3.66e-01 | 0.21 |
| 79006 | METRN | GSM4909316 | Human | Breast | IDC | 3.24e-31 | 1.14e+00 | 0.21 |
| 79006 | METRN | GSM4909317 | Human | Breast | IDC | 1.45e-06 | 2.73e-01 | 0.1355 |
| 79006 | METRN | GSM4909318 | Human | Breast | IDC | 1.29e-04 | 5.31e-01 | 0.2031 |
| 79006 | METRN | GSM4909319 | Human | Breast | IDC | 1.91e-22 | 3.79e-01 | 0.1563 |
| 79006 | METRN | GSM4909321 | Human | Breast | IDC | 9.30e-08 | 2.93e-01 | 0.1559 |
| 79006 | METRN | M1 | Human | Breast | IDC | 5.33e-23 | 6.18e-01 | 0.1577 |
| 79006 | METRN | M2 | Human | Breast | IDC | 1.97e-06 | 5.20e-01 | 0.21 |
| 79006 | METRN | M5 | Human | Breast | IDC | 3.85e-16 | 9.71e-01 | 0.1598 |
| 79006 | METRN | NCCBC11 | Human | Breast | DCIS | 3.41e-04 | 4.96e-01 | 0.1232 |
| 79006 | METRN | NCCBC14 | Human | Breast | DCIS | 1.57e-32 | 8.72e-01 | 0.2021 |
| Page: 1 2 3 4 5 |
| Tissue | Expression Dynamics | Abbreviation |
| Breast | 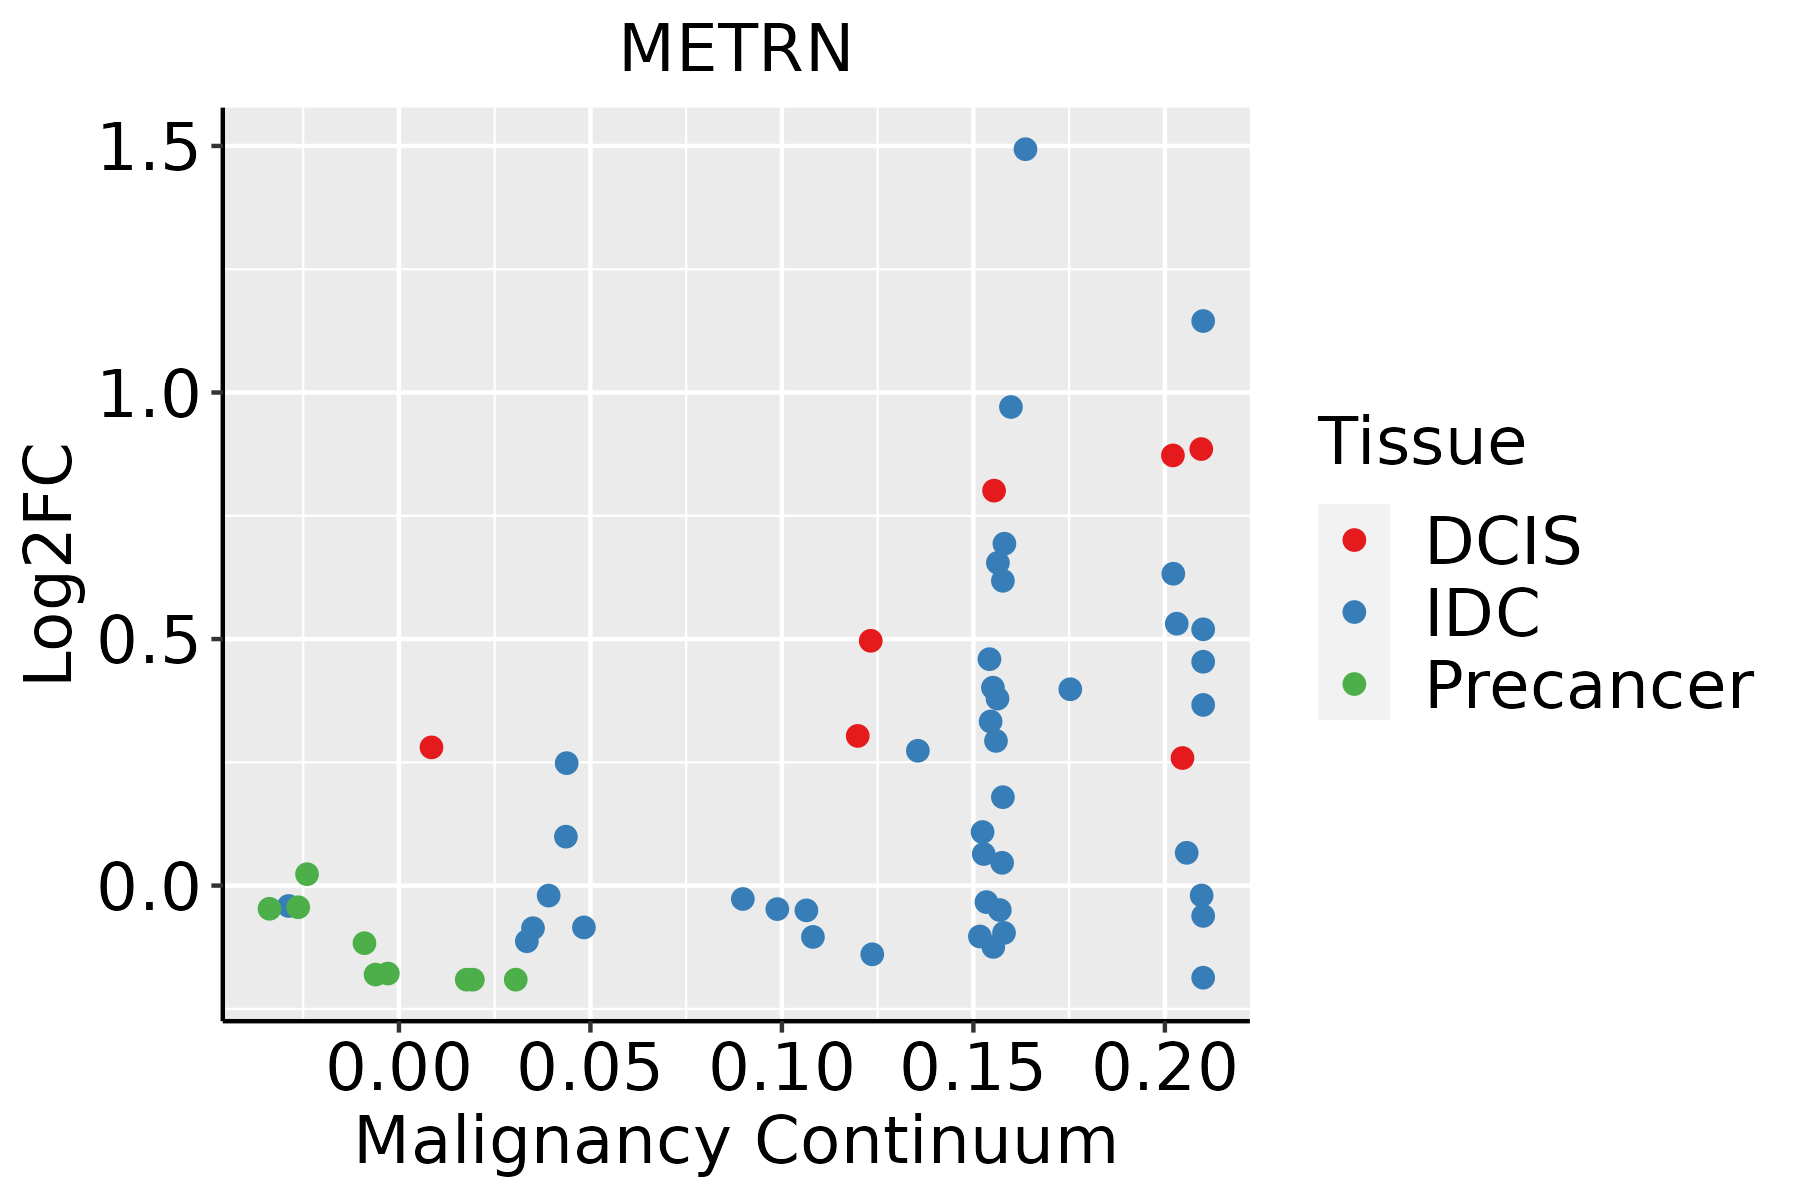 | IDC: Invasive ductal carcinoma |
| DCIS: Ductal carcinoma in situ | ||
| Precancer(BRCA1-mut): Precancerous lesion from BRCA1 mutation carriers | ||
| Esophagus |  | ESCC: Esophageal squamous cell carcinoma |
| HGIN: High-grade intraepithelial neoplasias | ||
| LGIN: Low-grade intraepithelial neoplasias | ||
| Liver | 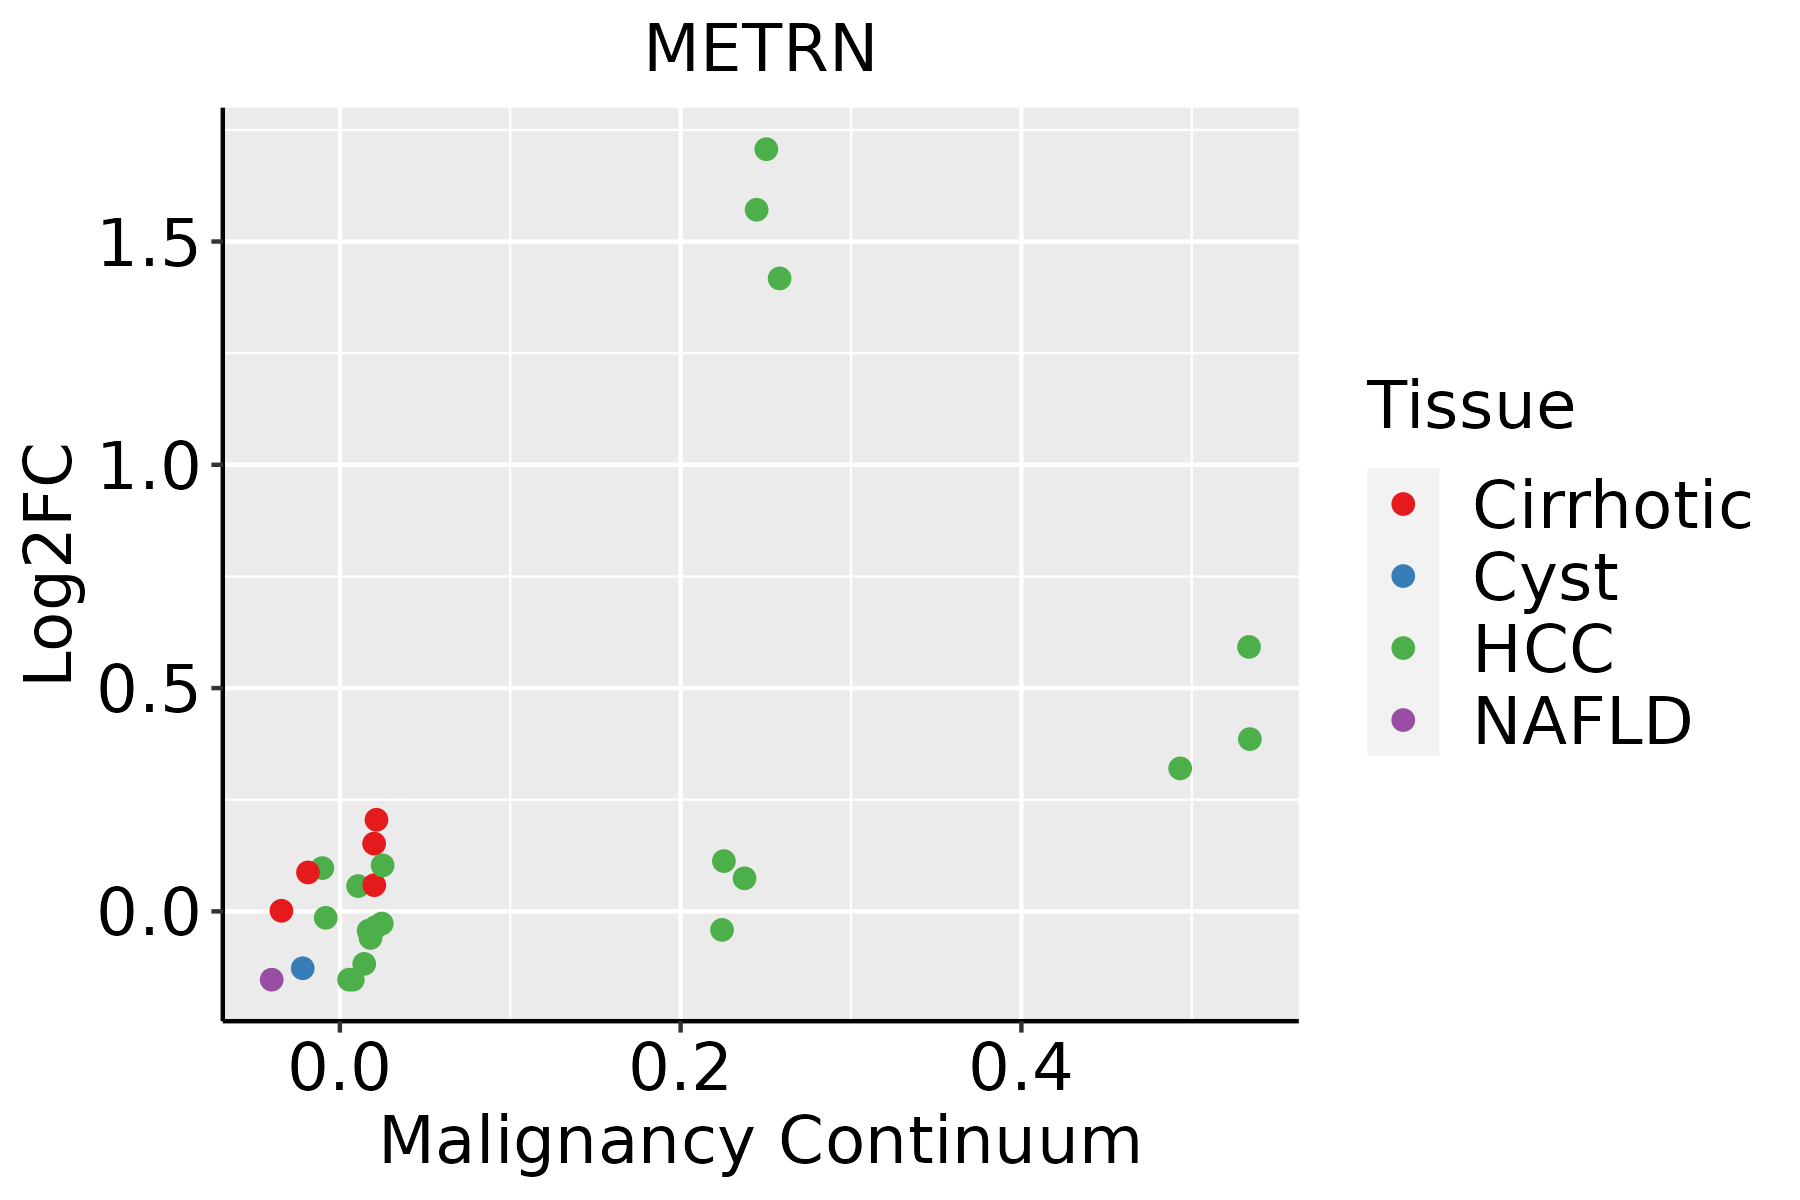 | HCC: Hepatocellular carcinoma |
| NAFLD: Non-alcoholic fatty liver disease | ||
| Oral Cavity | 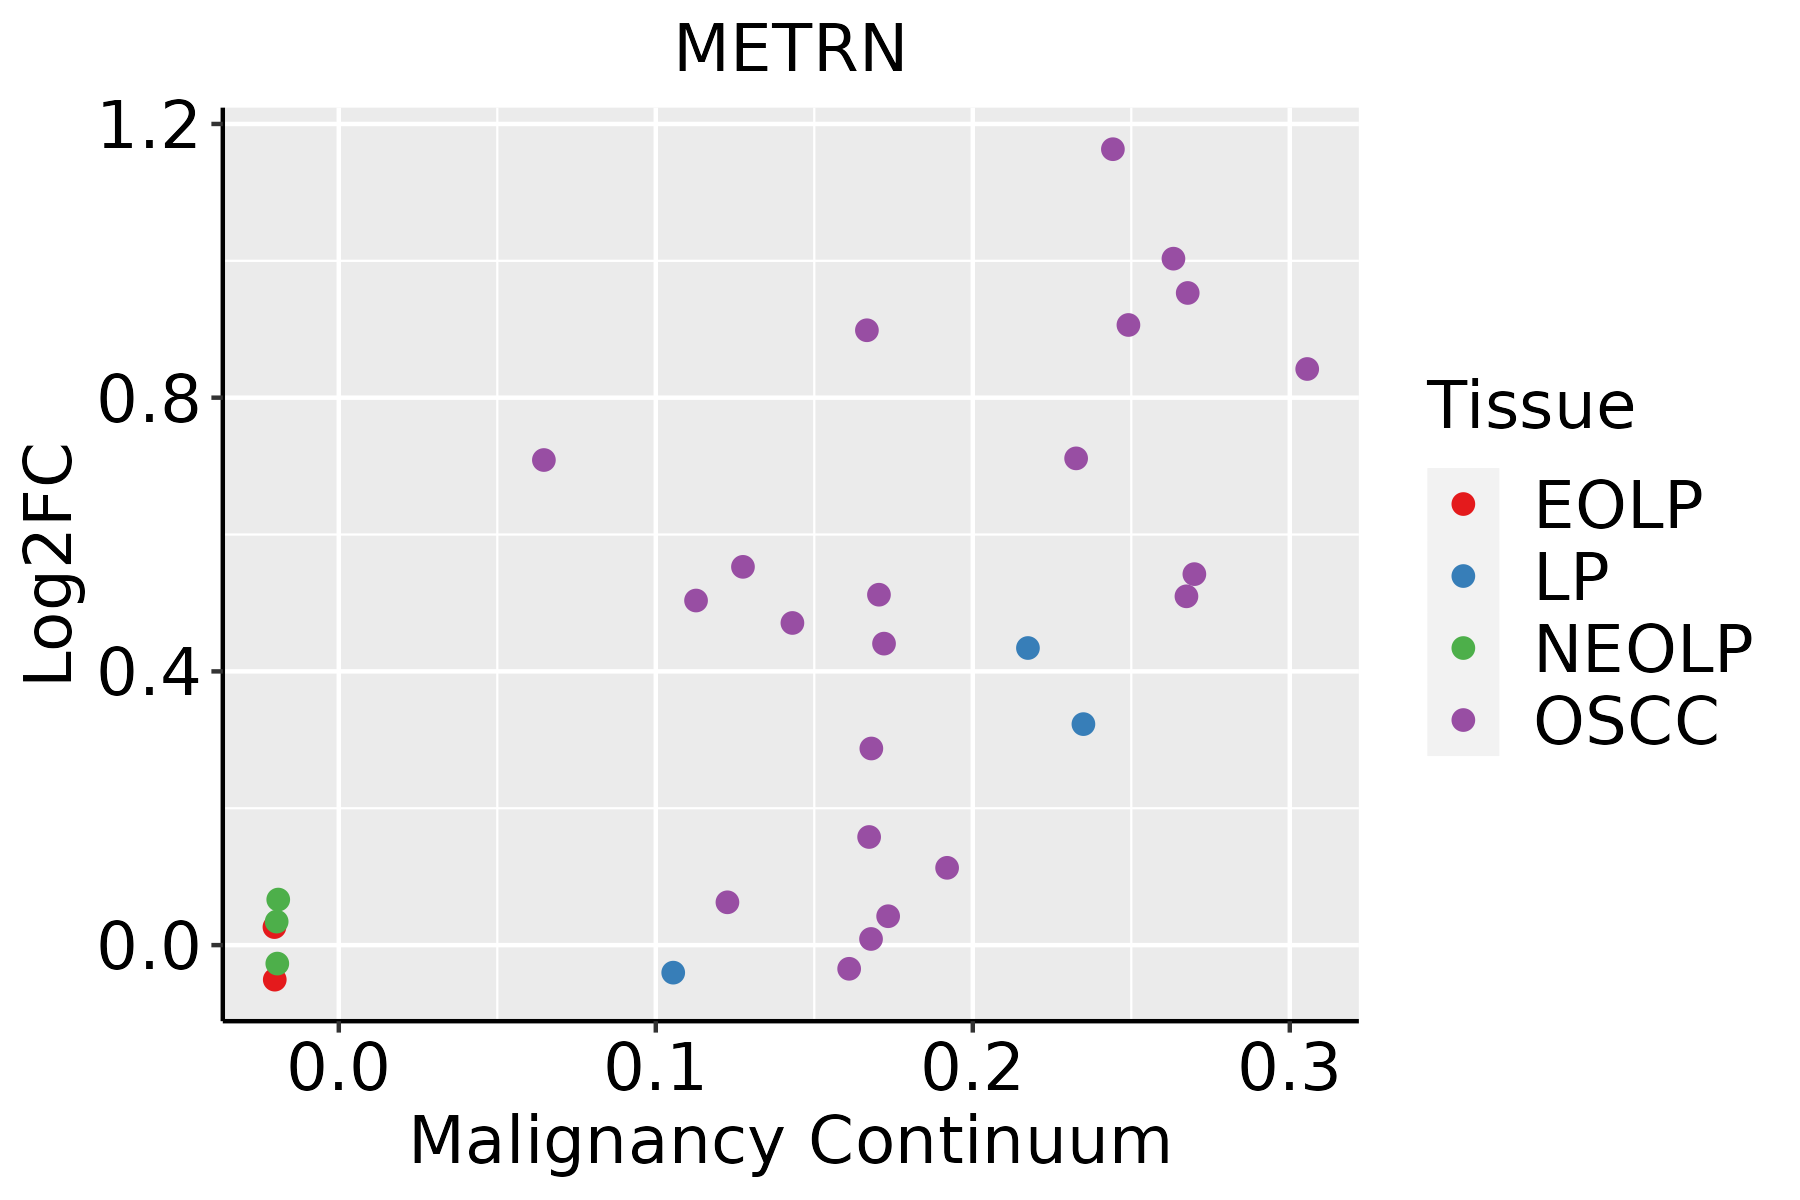 | EOLP: Erosive Oral lichen planus |
| LP: leukoplakia | ||
| NEOLP: Non-erosive oral lichen planus | ||
| OSCC: Oral squamous cell carcinoma | ||
| Thyroid | 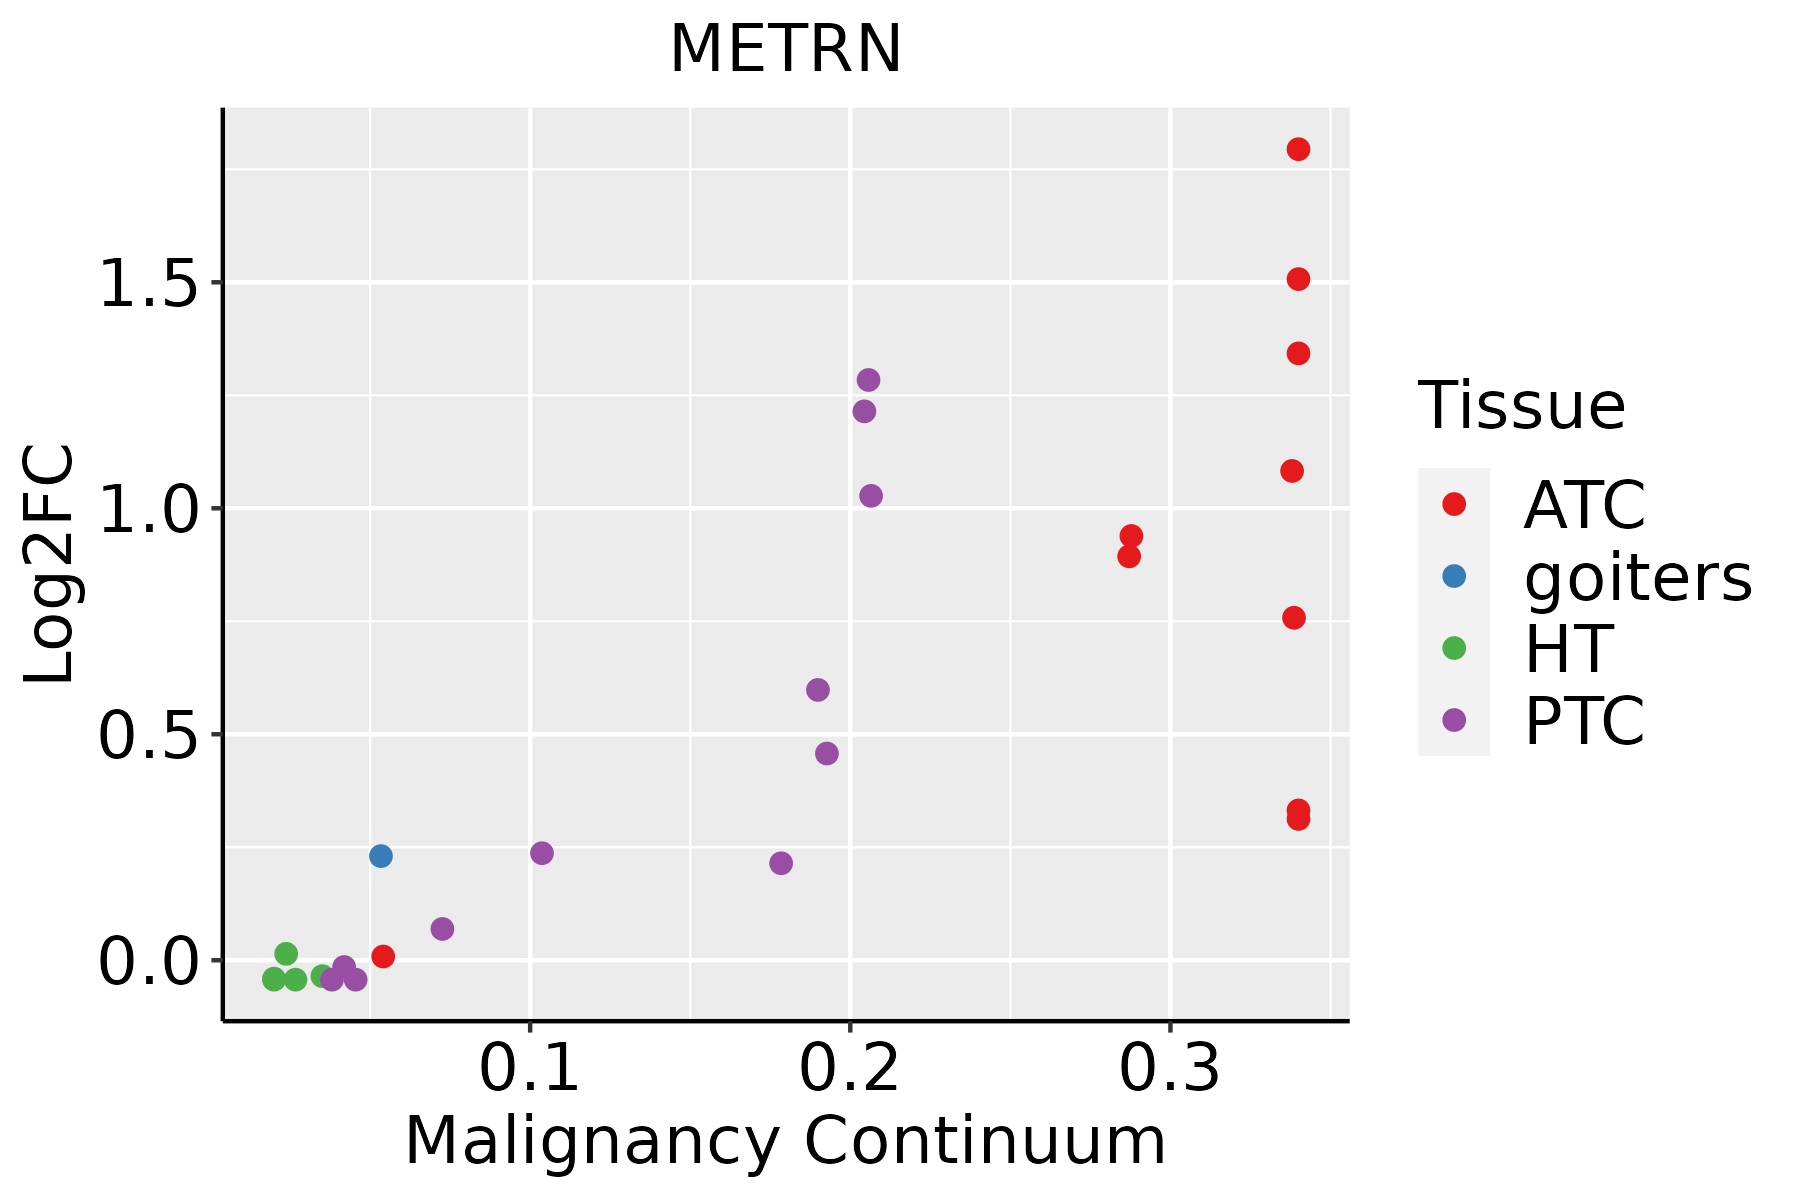 | ATC: Anaplastic thyroid cancer |
| HT: Hashimoto's thyroiditis | ||
| PTC: Papillary thyroid cancer |
| ∗log2FC in expression of this searched gene in stem-like cells from each diseased tissue sample relative to stem-like cells in normal samples in each tissue plotted against the malignancy continuum. Samples are colored based on if they are from different disease stage. |
Top |
Malignant transformation related pathway analysis |
| Find out the enriched GO biological processes and KEGG pathways involved in transition from healthy to precancer to cancer |
| Tissue | Disease Stage | Enriched GO biological Processes |
| Colorectum | AD |  |
| Colorectum | SER |  |
| Colorectum | MSS |  |
| Colorectum | MSI-H |  |
| Colorectum | FAP |  |
| ∗Top 15 enriched GO BP terms are showed in the bar plot of each disease state in each tissue. Each row represents a significant GO biological process which is colored according to the -log10(p.adjust). |
| Page: 1 2 3 4 5 6 7 8 9 |
| GO ID | Tissue | Disease Stage | Description | Gene Ratio | Bg Ratio | pvalue | p.adjust | Count |
| GO:004206311 | Breast | IDC | gliogenesis | 39/1434 | 301/18723 | 8.63e-04 | 1.00e-02 | 39 |
| GO:00100011 | Breast | IDC | glial cell differentiation | 31/1434 | 225/18723 | 1.04e-03 | 1.15e-02 | 31 |
| GO:00420632 | Breast | DCIS | gliogenesis | 39/1390 | 301/18723 | 4.76e-04 | 6.25e-03 | 39 |
| GO:00100012 | Breast | DCIS | glial cell differentiation | 31/1390 | 225/18723 | 6.24e-04 | 7.87e-03 | 31 |
| GO:0009409 | Colorectum | AD | response to cold | 22/3918 | 49/18723 | 1.40e-04 | 1.98e-03 | 22 |
| GO:00094091 | Colorectum | SER | response to cold | 16/2897 | 49/18723 | 2.11e-03 | 2.06e-02 | 16 |
| GO:0045444 | Colorectum | SER | fat cell differentiation | 51/2897 | 229/18723 | 3.96e-03 | 3.26e-02 | 51 |
| GO:0045600 | Colorectum | SER | positive regulation of fat cell differentiation | 19/2897 | 66/18723 | 4.29e-03 | 3.45e-02 | 19 |
| GO:00094092 | Colorectum | MSS | response to cold | 19/3467 | 49/18723 | 7.20e-04 | 7.70e-03 | 19 |
| GO:003134616 | Esophagus | ESCC | positive regulation of cell projection organization | 201/8552 | 353/18723 | 1.19e-05 | 1.11e-04 | 201 |
| GO:001072010 | Esophagus | ESCC | positive regulation of cell development | 172/8552 | 298/18723 | 1.74e-05 | 1.55e-04 | 172 |
| GO:00420636 | Esophagus | ESCC | gliogenesis | 172/8552 | 301/18723 | 3.75e-05 | 3.04e-04 | 172 |
| GO:005076710 | Esophagus | ESCC | regulation of neurogenesis | 203/8552 | 364/18723 | 6.10e-05 | 4.68e-04 | 203 |
| GO:00507697 | Esophagus | ESCC | positive regulation of neurogenesis | 131/8552 | 225/18723 | 9.71e-05 | 6.90e-04 | 131 |
| GO:006156415 | Esophagus | ESCC | axon development | 251/8552 | 467/18723 | 2.41e-04 | 1.49e-03 | 251 |
| GO:001097516 | Esophagus | ESCC | regulation of neuron projection development | 240/8552 | 445/18723 | 2.48e-04 | 1.53e-03 | 240 |
| GO:00100016 | Esophagus | ESCC | glial cell differentiation | 129/8552 | 225/18723 | 2.73e-04 | 1.65e-03 | 129 |
| GO:00519606 | Esophagus | ESCC | regulation of nervous system development | 237/8552 | 443/18723 | 5.02e-04 | 2.78e-03 | 237 |
| GO:00519625 | Esophagus | ESCC | positive regulation of nervous system development | 149/8552 | 272/18723 | 1.50e-03 | 7.06e-03 | 149 |
| GO:000740915 | Esophagus | ESCC | axonogenesis | 219/8552 | 418/18723 | 3.14e-03 | 1.31e-02 | 219 |
| Page: 1 2 3 4 5 |
| Pathway ID | Tissue | Disease Stage | Description | Gene Ratio | Bg Ratio | pvalue | p.adjust | qvalue | Count |
| Page: 1 |
Top |
Cell-cell communication analysis |
| Identification of potential cell-cell interactions between two cell types and their ligand-receptor pairs for different disease states |
| Ligand | Receptor | LRpair | Pathway | Tissue | Disease Stage |
| Page: 1 |
Top |
Single-cell gene regulatory network inference analysis |
| Find out the significant the regulons (TFs) and the target genes of each regulon across cell types for different disease states |
| TF | Cell Type | Tissue | Disease Stage | Target Gene | RSS | Regulon Activity |
| ∗The dot plots of a searched regulon are shown for all cell subpopulations in each disease state of each tissue based on the regulon specific score inferred using pySCENIC and by calculating the average expression. |
| Page: 1 |
Top |
Somatic mutation of malignant transformation related genes |
| Annotation of somatic variants for genes involved in malignant transformation |
| Hugo Symbol | Variant Class | Variant Classification | dbSNP RS | HGVSc | HGVSp | HGVSp Short | SWISSPROT | BIOTYPE | SIFT | PolyPhen | Tumor Sample Barcode | Tissue | Histology | Sex | Age | Stage | Therapy Types | Drugs | Outcome |
| METRN | SNV | Missense_Mutation | c.532N>C | p.Glu178Gln | p.E178Q | Q9UJH8 | protein_coding | deleterious(0.02) | possibly_damaging(0.467) | TCGA-AC-A23H-01 | Breast | breast invasive carcinoma | Female | >=65 | I/II | Unknown | Unknown | PD | |
| METRN | SNV | Missense_Mutation | rs566182946 | c.709N>T | p.Arg237Cys | p.R237C | Q9UJH8 | protein_coding | deleterious(0) | benign(0.067) | TCGA-LL-A9Q3-01 | Breast | breast invasive carcinoma | Female | >=65 | III/IV | Immunotherapy | herceptin | CR |
| METRN | SNV | Missense_Mutation | rs773257021 | c.824N>A | p.Arg275His | p.R275H | Q9UJH8 | protein_coding | tolerated(0.05) | benign(0.007) | TCGA-A6-5662-01 | Colorectum | colon adenocarcinoma | Male | <65 | I/II | Chemotherapy | oxaliplatin | PD |
| METRN | SNV | Missense_Mutation | rs754170916 | c.547G>A | p.Ala183Thr | p.A183T | Q9UJH8 | protein_coding | tolerated(0.08) | benign(0.014) | TCGA-FI-A2D5-01 | Endometrium | uterine corpus endometrioid carcinoma | Female | <65 | III/IV | Chemotherapy | carboplatinum | PD |
| METRN | SNV | Missense_Mutation | c.640N>A | p.Arg214Ser | p.R214S | Q9UJH8 | protein_coding | deleterious(0.01) | possibly_damaging(0.524) | TCGA-EJ-7125-01 | Prostate | prostate adenocarcinoma | Male | <65 | 7 | Unknown | Unknown | SD | |
| METRN | SNV | Missense_Mutation | c.568N>G | p.Ile190Val | p.I190V | Q9UJH8 | protein_coding | tolerated(1) | benign(0.001) | TCGA-J4-A67L-01 | Prostate | prostate adenocarcinoma | Male | <65 | 7 | Unknown | Unknown | SD | |
| METRN | SNV | Missense_Mutation | rs754170916 | c.547G>A | p.Ala183Thr | p.A183T | Q9UJH8 | protein_coding | tolerated(0.08) | benign(0.014) | TCGA-B7-5816-01 | Stomach | stomach adenocarcinoma | Female | <65 | I/II | Unknown | Unknown | SD |
| METRN | SNV | Missense_Mutation | rs780450000 | c.637N>A | p.Ala213Thr | p.A213T | Q9UJH8 | protein_coding | tolerated(0.77) | benign(0.001) | TCGA-DJ-A3UN-01 | Thyroid | thyroid carcinoma | Female | <65 | I/II | Unknown | Unknown | SD |
| Page: 1 |
Top |
Related drugs of malignant transformation related genes |
| Identification of chemicals and drugs interact with genes involved in malignant transfromation |
| (DGIdb 4.0) |
| Entrez ID | Symbol | Category | Interaction Types | Drug Claim Name | Drug Name | PMIDs |
| Page: 1 |

Copyright 2023-Present -The University of Texas Health Science Center at Houston |