
|
|||||
|
 | |
| |
| |
| |
| |
| |
|
Gene: METAP2 |
Gene summary for METAP2 |
| Gene information | Species | Human | Gene symbol | METAP2 | Gene ID | 10988 |
| Gene name | methionyl aminopeptidase 2 | |
| Gene Alias | MAP2 | |
| Cytomap | 12q22 | |
| Gene Type | protein-coding | GO ID | GO:0006464 | UniProtAcc | P50579 |
Top |
Malignant transformation analysis |
| Identification of the aberrant gene expression in precancerous and cancerous lesions by comparing the gene expression of stem-like cells in diseased tissues with normal stem cells |
| Entrez ID | Symbol | Replicates | Species | Organ | Tissue | Adj P-value | Log2FC | Malignancy |
| 10988 | METAP2 | AEH-subject2 | Human | Endometrium | AEH | 1.83e-07 | -1.81e-01 | -0.2525 |
| 10988 | METAP2 | AEH-subject3 | Human | Endometrium | AEH | 2.57e-08 | -1.82e-01 | -0.2576 |
| 10988 | METAP2 | AEH-subject4 | Human | Endometrium | AEH | 4.09e-05 | -2.59e-01 | -0.2657 |
| 10988 | METAP2 | AEH-subject5 | Human | Endometrium | AEH | 4.32e-03 | -2.64e-01 | -0.2953 |
| 10988 | METAP2 | EEC-subject1 | Human | Endometrium | EEC | 9.56e-08 | -2.77e-01 | -0.2682 |
| 10988 | METAP2 | EEC-subject2 | Human | Endometrium | EEC | 1.24e-06 | -1.69e-01 | -0.2607 |
| 10988 | METAP2 | EEC-subject3 | Human | Endometrium | EEC | 1.66e-24 | -1.69e-01 | -0.2525 |
| 10988 | METAP2 | EEC-subject4 | Human | Endometrium | EEC | 1.30e-10 | -3.56e-01 | -0.2571 |
| 10988 | METAP2 | EEC-subject5 | Human | Endometrium | EEC | 3.97e-02 | -2.42e-01 | -0.249 |
| 10988 | METAP2 | GSM5276934 | Human | Endometrium | EEC | 2.14e-03 | 1.19e-01 | -0.0913 |
| 10988 | METAP2 | GSM6177620_NYU_UCEC1_lib1_lib1 | Human | Endometrium | EEC | 1.00e-29 | -1.08e-01 | -0.1869 |
| 10988 | METAP2 | GSM6177620_NYU_UCEC1_lib2_lib2 | Human | Endometrium | EEC | 1.38e-31 | -5.08e-02 | -0.1875 |
| 10988 | METAP2 | GSM6177620_NYU_UCEC1_lib3_lib3 | Human | Endometrium | EEC | 2.35e-33 | -1.97e-01 | -0.1883 |
| 10988 | METAP2 | GSM6177621_NYU_UCEC2_lib1_lib1 | Human | Endometrium | EEC | 2.12e-27 | 1.96e-02 | -0.1934 |
| 10988 | METAP2 | GSM6177622_NYU_UCEC3_lib1_lib1 | Human | Endometrium | EEC | 6.51e-39 | -1.66e-01 | -0.1917 |
| 10988 | METAP2 | GSM6177622_NYU_UCEC3_lib2_lib2 | Human | Endometrium | EEC | 3.58e-44 | -9.72e-02 | -0.1916 |
| 10988 | METAP2 | GSM6177623_NYU_UCEC3_Vis | Human | Endometrium | EEC | 1.27e-03 | -2.05e-01 | -0.1269 |
| 10988 | METAP2 | LZE4T | Human | Esophagus | ESCC | 5.02e-24 | 1.30e-01 | 0.0811 |
| 10988 | METAP2 | LZE7T | Human | Esophagus | ESCC | 3.35e-06 | 8.32e-01 | 0.0667 |
| 10988 | METAP2 | LZE8T | Human | Esophagus | ESCC | 5.09e-03 | 1.25e-01 | 0.067 |
| Page: 1 2 3 4 5 6 7 8 9 |
| Tissue | Expression Dynamics | Abbreviation |
| Endometrium | 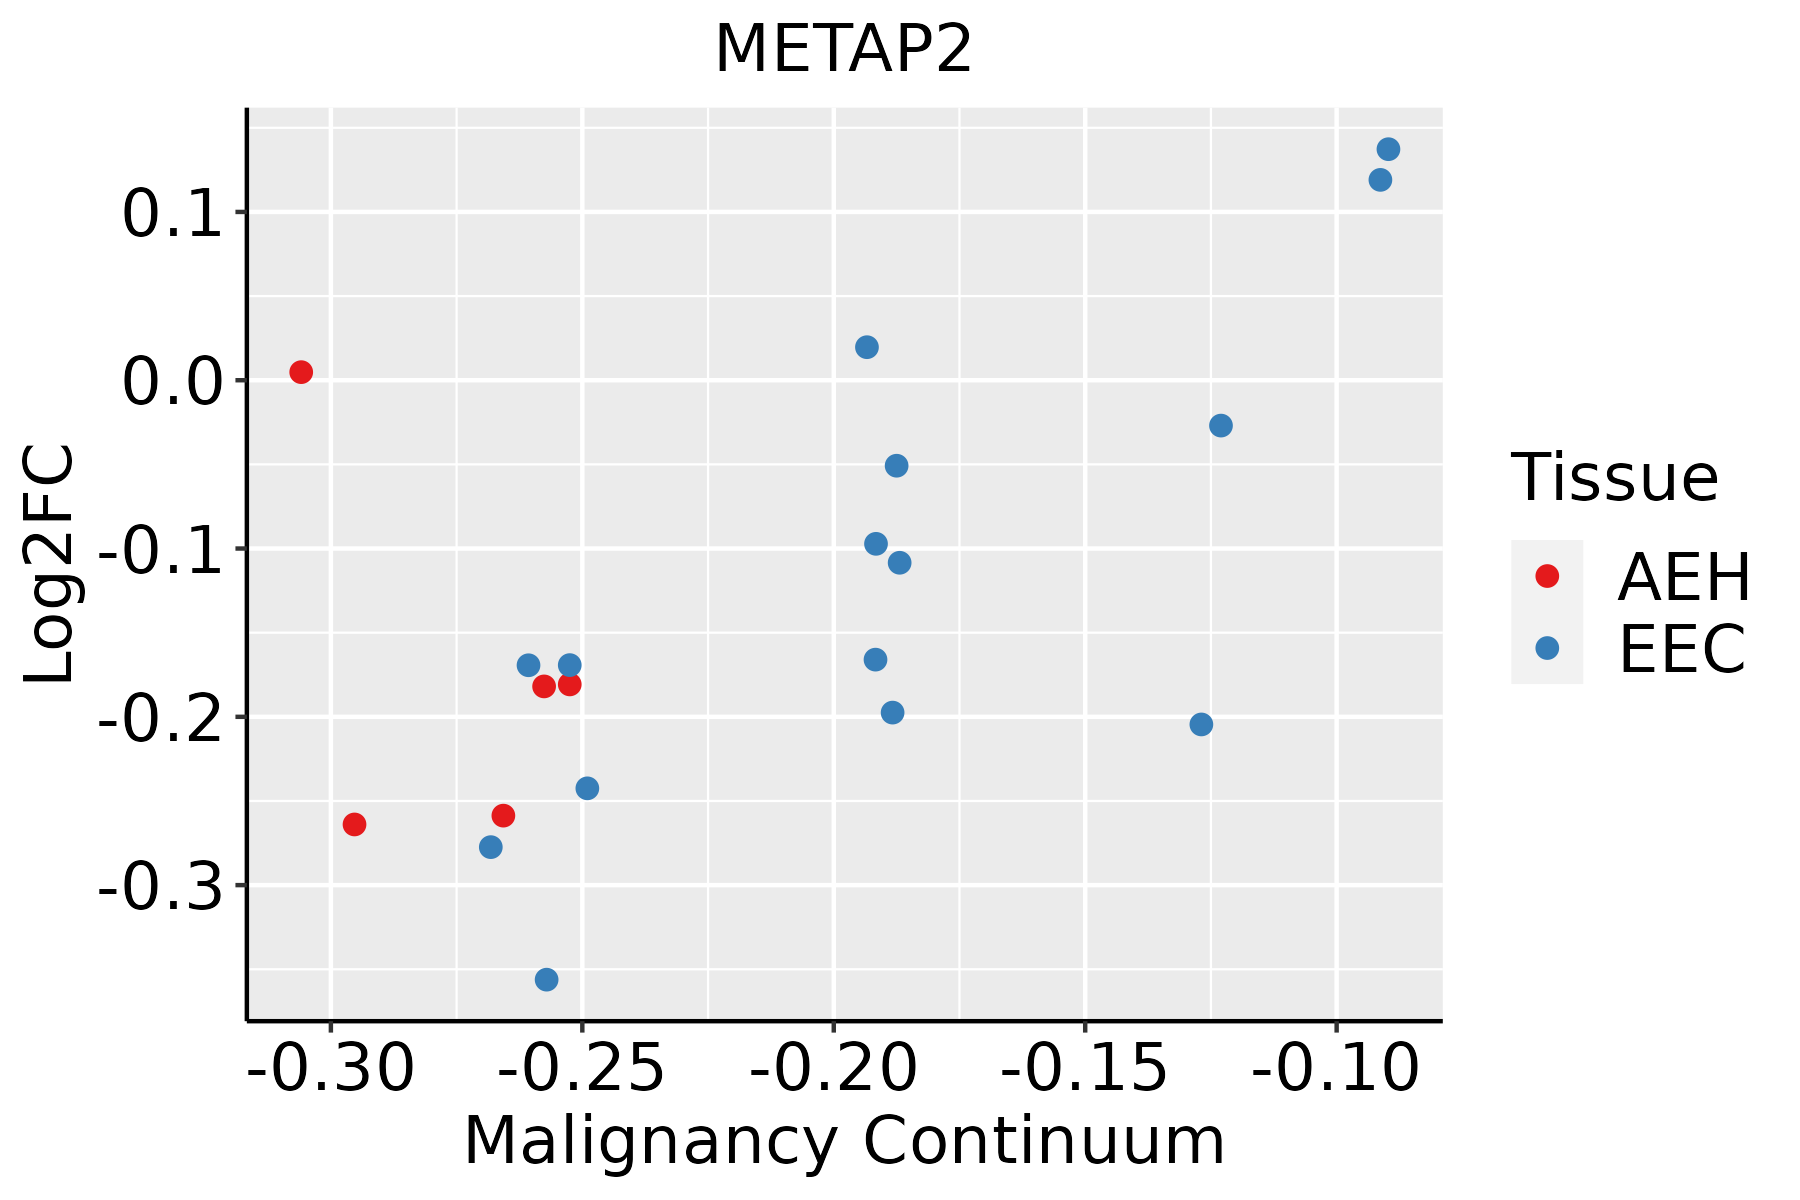 | AEH: Atypical endometrial hyperplasia |
| EEC: Endometrioid Cancer | ||
| Esophagus | 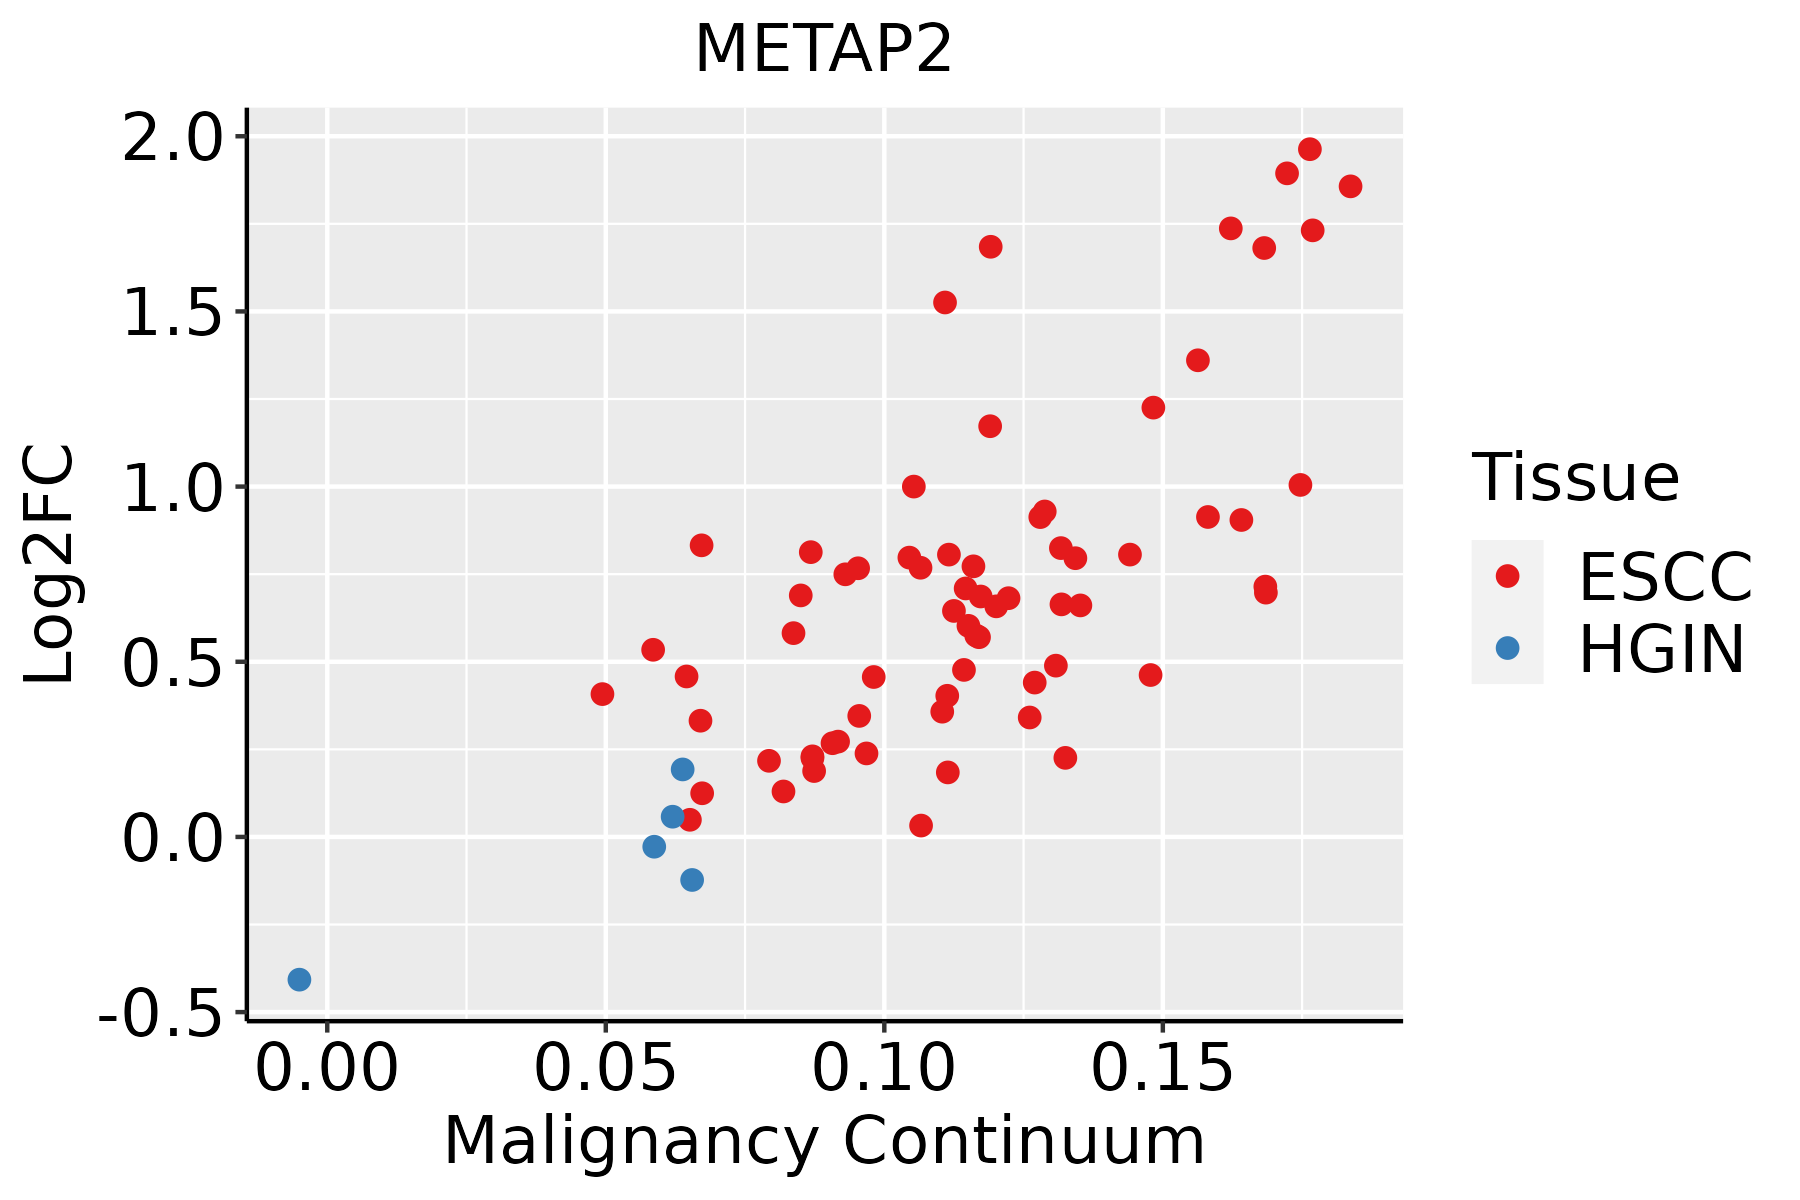 | ESCC: Esophageal squamous cell carcinoma |
| HGIN: High-grade intraepithelial neoplasias | ||
| LGIN: Low-grade intraepithelial neoplasias | ||
| Liver | 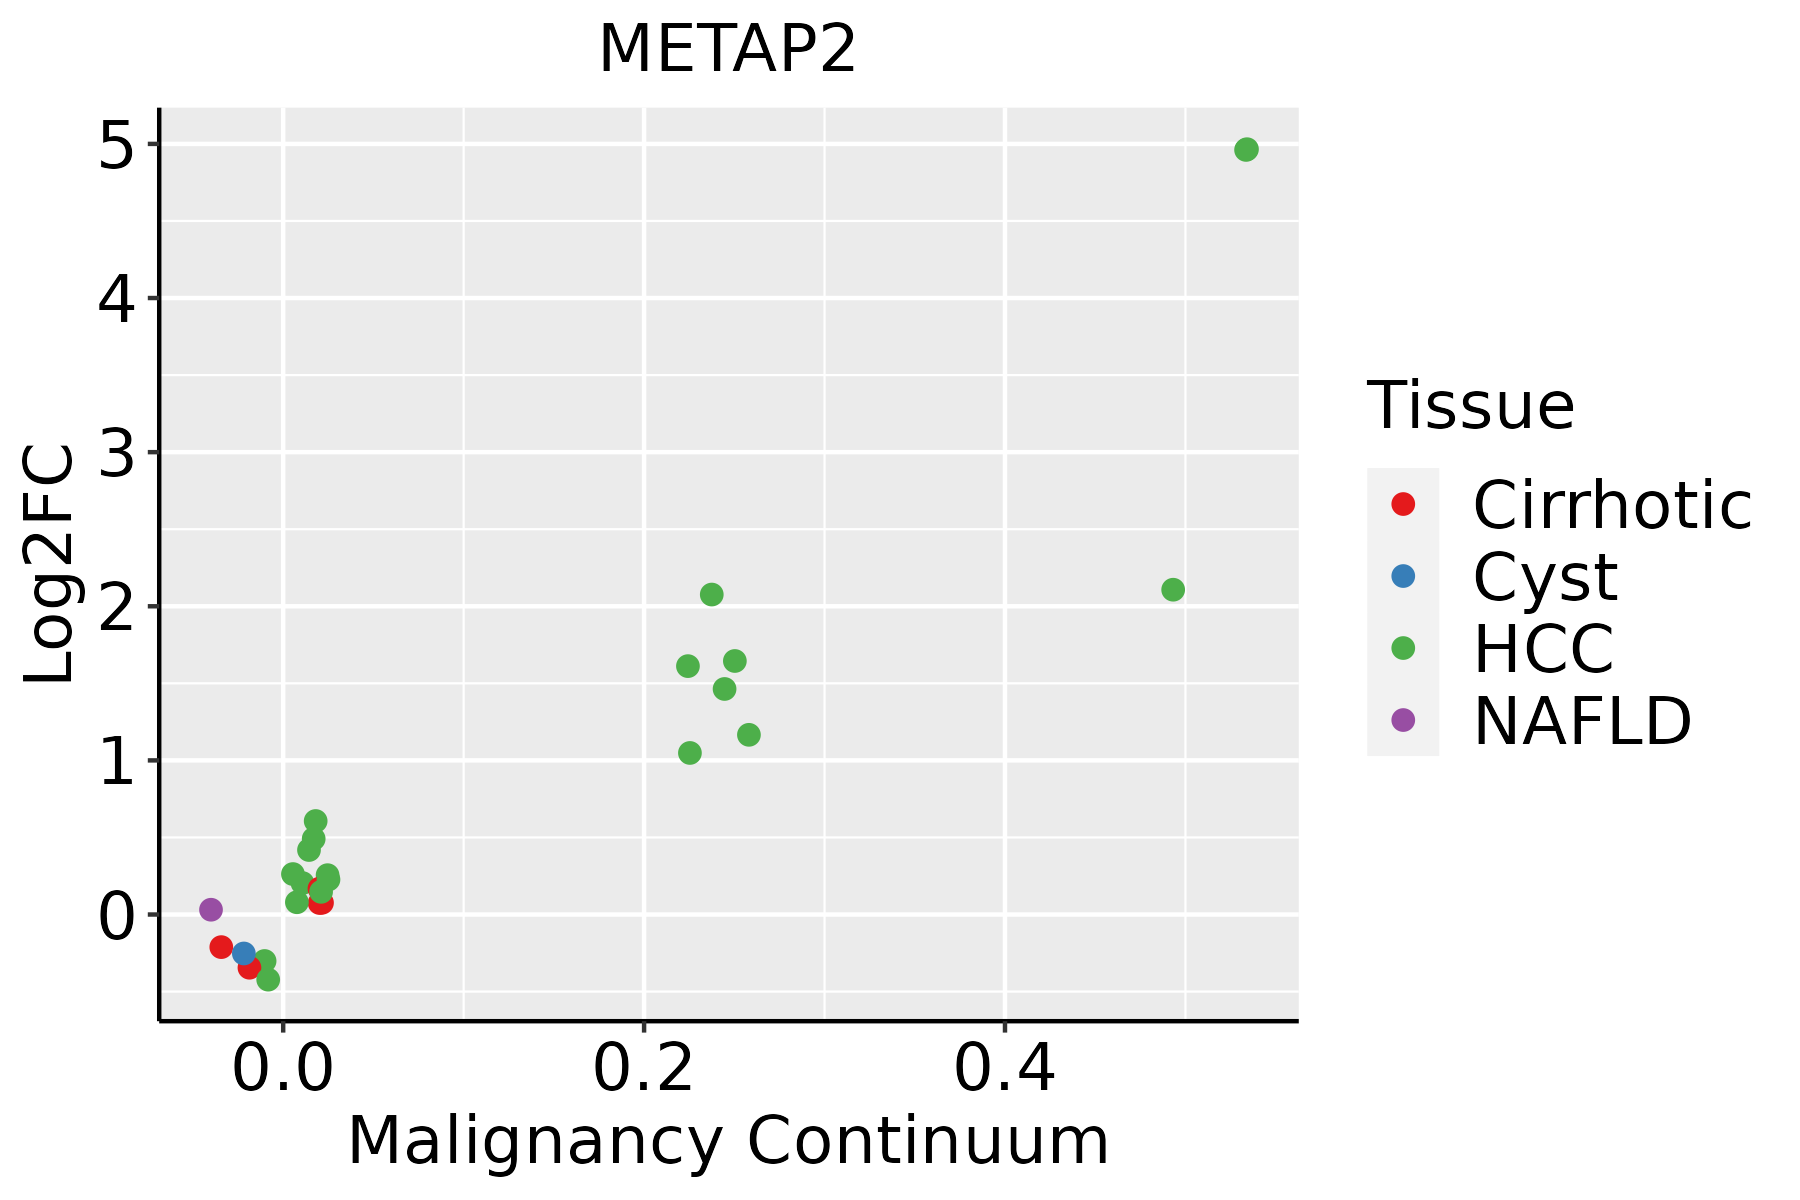 | HCC: Hepatocellular carcinoma |
| NAFLD: Non-alcoholic fatty liver disease | ||
| Oral Cavity | 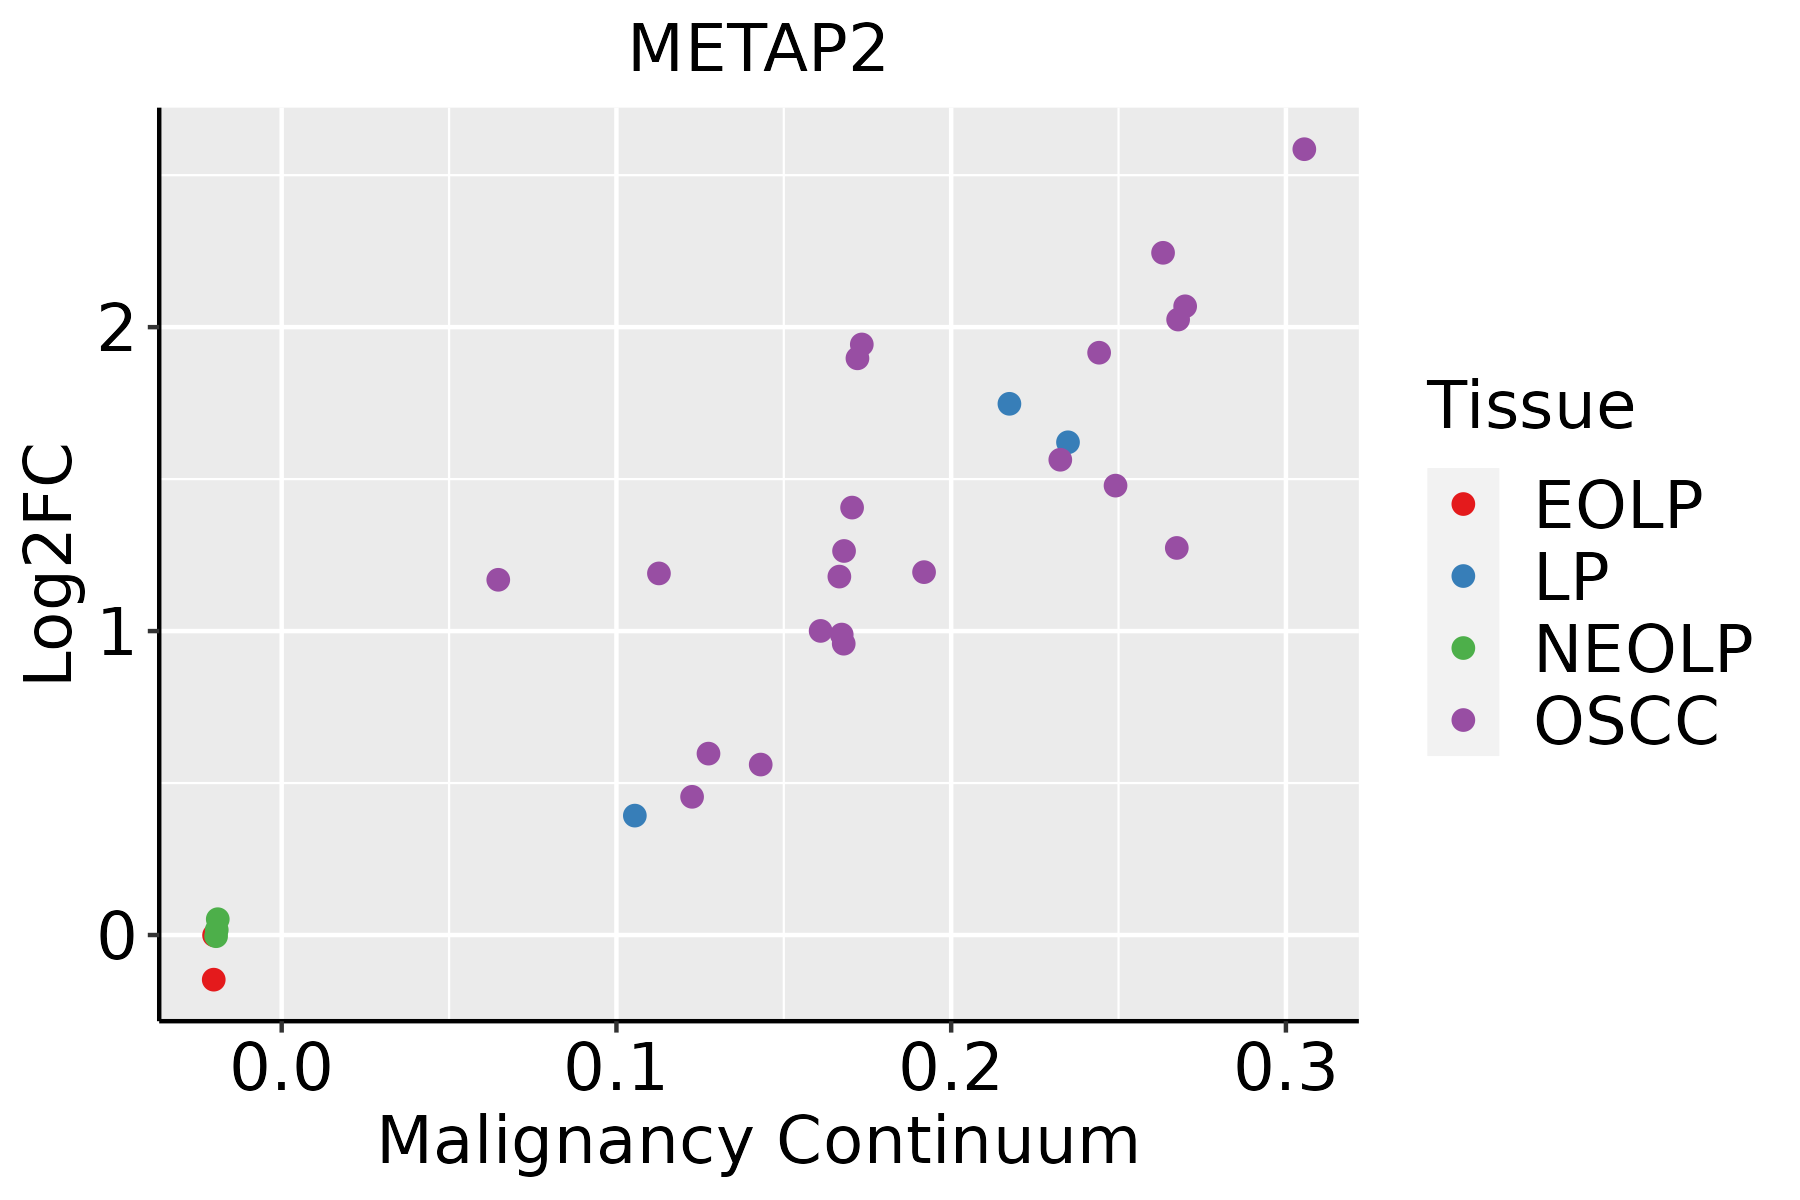 | EOLP: Erosive Oral lichen planus |
| LP: leukoplakia | ||
| NEOLP: Non-erosive oral lichen planus | ||
| OSCC: Oral squamous cell carcinoma | ||
| Prostate | 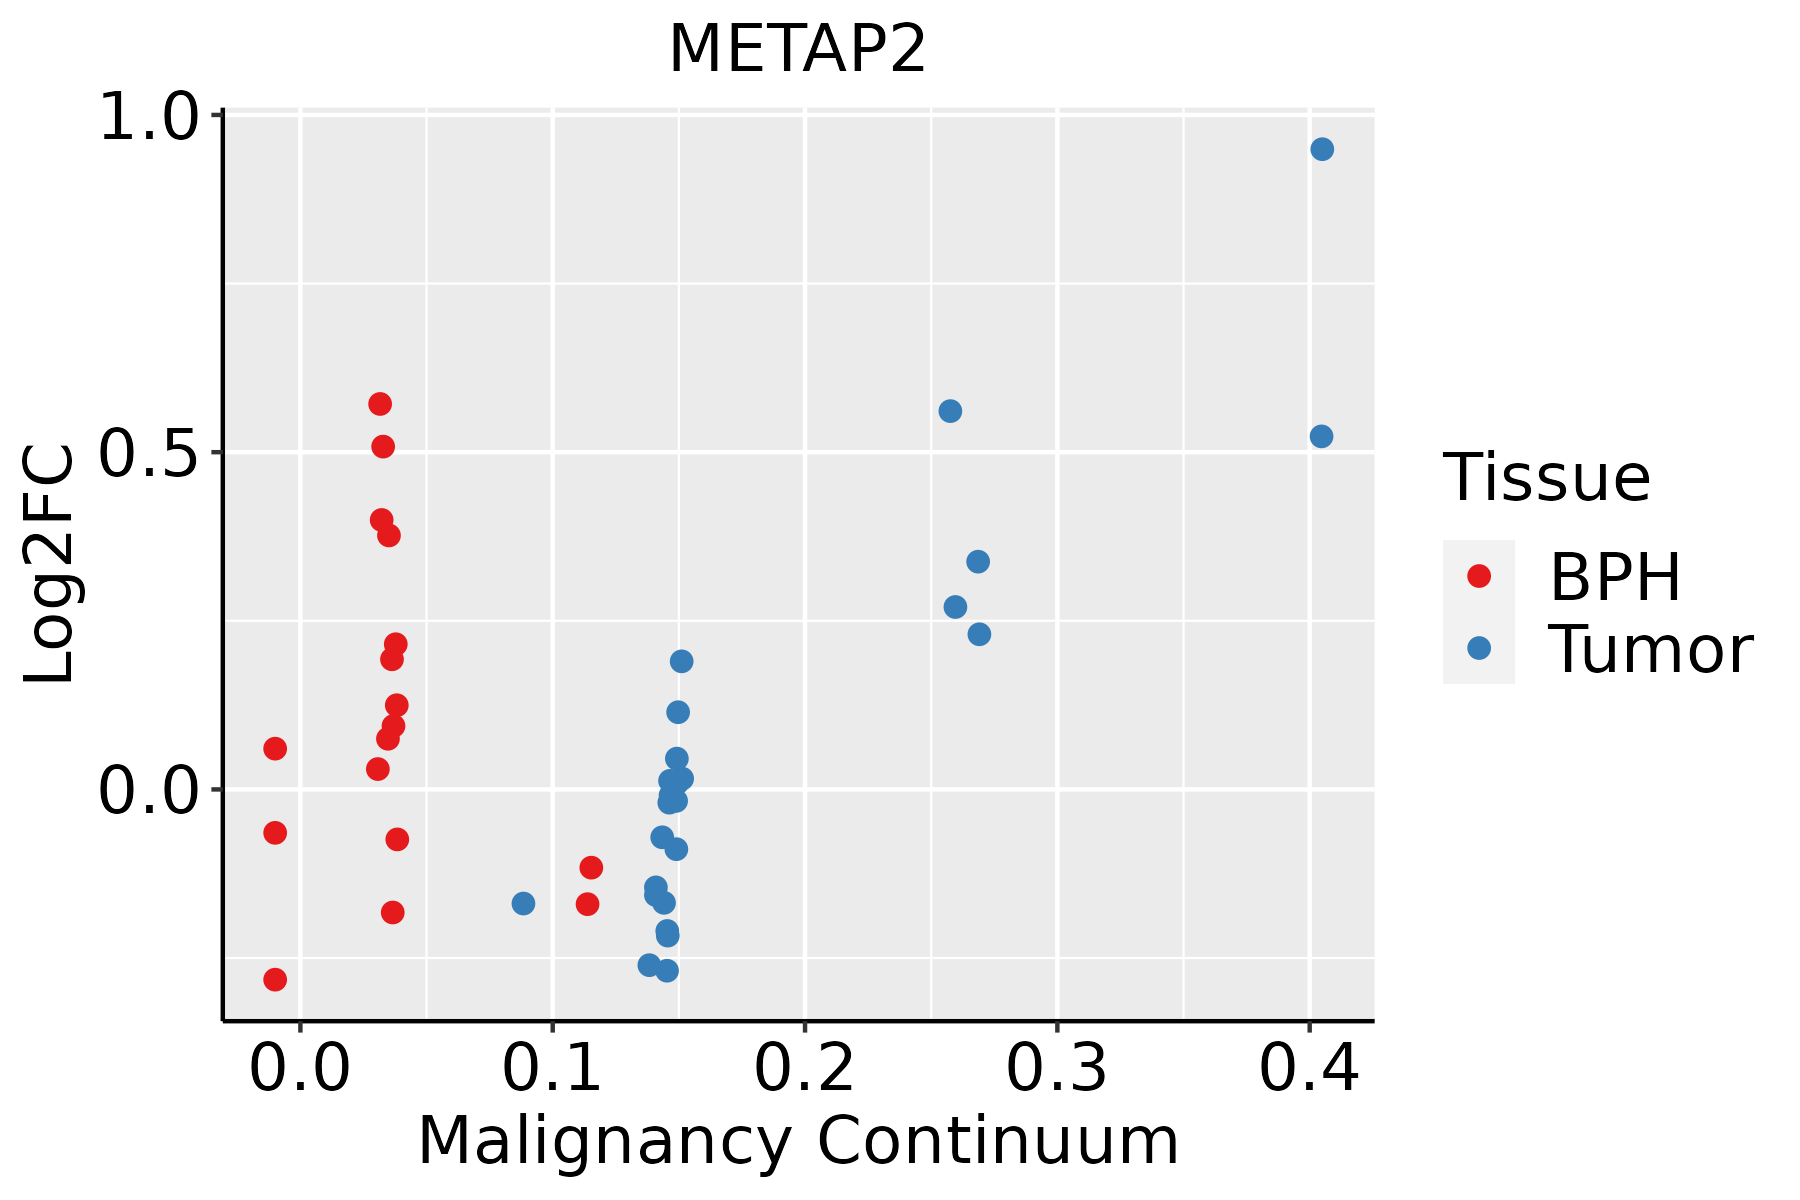 | BPH: Benign Prostatic Hyperplasia |
| Skin |  | AK: Actinic keratosis |
| cSCC: Cutaneous squamous cell carcinoma | ||
| SCCIS:squamous cell carcinoma in situ | ||
| Thyroid | 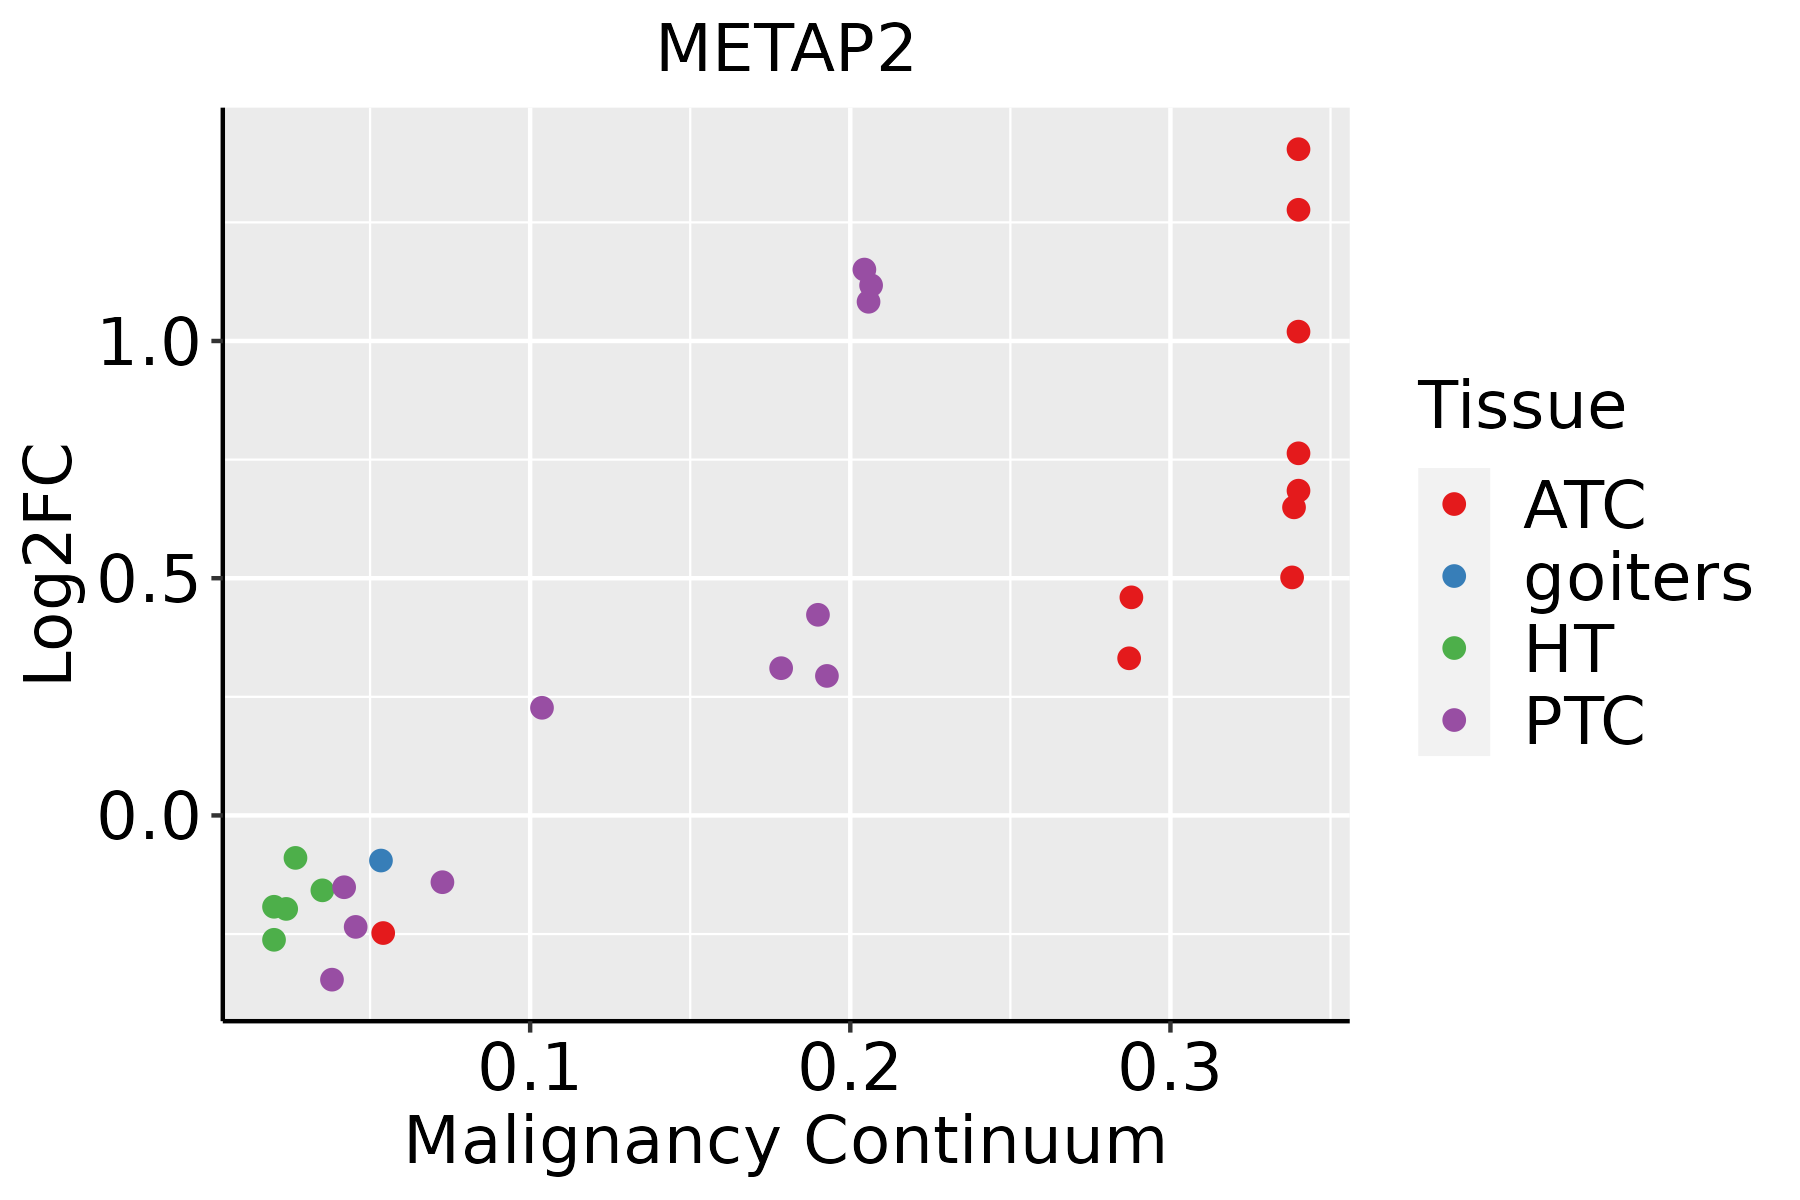 | ATC: Anaplastic thyroid cancer |
| HT: Hashimoto's thyroiditis | ||
| PTC: Papillary thyroid cancer |
| ∗log2FC in expression of this searched gene in stem-like cells from each diseased tissue sample relative to stem-like cells in normal samples in each tissue plotted against the malignancy continuum. Samples are colored based on if they are from different disease stage. |
Top |
Malignant transformation related pathway analysis |
| Find out the enriched GO biological processes and KEGG pathways involved in transition from healthy to precancer to cancer |
| Tissue | Disease Stage | Enriched GO biological Processes |
| Colorectum | AD |  |
| Colorectum | SER |  |
| Colorectum | MSS |  |
| Colorectum | MSI-H |  |
| Colorectum | FAP |  |
| ∗Top 15 enriched GO BP terms are showed in the bar plot of each disease state in each tissue. Each row represents a significant GO biological process which is colored according to the -log10(p.adjust). |
| Page: 1 2 3 4 5 6 7 8 9 |
| GO ID | Tissue | Disease Stage | Description | Gene Ratio | Bg Ratio | pvalue | p.adjust | Count |
| GO:005160417 | Esophagus | HGIN | protein maturation | 68/2587 | 294/18723 | 9.77e-06 | 2.86e-04 | 68 |
| GO:00164857 | Esophagus | HGIN | protein processing | 49/2587 | 225/18723 | 7.04e-04 | 9.52e-03 | 49 |
| GO:005160418 | Esophagus | ESCC | protein maturation | 189/8552 | 294/18723 | 7.64e-11 | 2.39e-09 | 189 |
| GO:001648514 | Esophagus | ESCC | protein processing | 134/8552 | 225/18723 | 1.81e-05 | 1.60e-04 | 134 |
| GO:00182061 | Esophagus | ESCC | peptidyl-methionine modification | 12/8552 | 13/18723 | 6.18e-04 | 3.32e-03 | 12 |
| GO:0031365 | Esophagus | ESCC | N-terminal protein amino acid modification | 21/8552 | 30/18723 | 6.17e-03 | 2.27e-02 | 21 |
| GO:00516046 | Liver | Cirrhotic | protein maturation | 121/4634 | 294/18723 | 3.54e-10 | 1.68e-08 | 121 |
| GO:00164853 | Liver | Cirrhotic | protein processing | 85/4634 | 225/18723 | 9.01e-06 | 1.32e-04 | 85 |
| GO:005160412 | Liver | HCC | protein maturation | 171/7958 | 294/18723 | 3.80e-08 | 8.30e-07 | 171 |
| GO:001648511 | Liver | HCC | protein processing | 121/7958 | 225/18723 | 4.01e-04 | 2.71e-03 | 121 |
| GO:0018206 | Liver | HCC | peptidyl-methionine modification | 10/7958 | 13/18723 | 1.28e-02 | 4.61e-02 | 10 |
| GO:005160410 | Oral cavity | OSCC | protein maturation | 170/7305 | 294/18723 | 3.97e-11 | 1.28e-09 | 170 |
| GO:00164856 | Oral cavity | OSCC | protein processing | 121/7305 | 225/18723 | 4.56e-06 | 5.23e-05 | 121 |
| GO:005160416 | Oral cavity | LP | protein maturation | 122/4623 | 294/18723 | 1.37e-10 | 7.72e-09 | 122 |
| GO:001648513 | Oral cavity | LP | protein processing | 83/4623 | 225/18723 | 2.87e-05 | 4.52e-04 | 83 |
| GO:00516049 | Prostate | BPH | protein maturation | 80/3107 | 294/18723 | 2.64e-06 | 4.23e-05 | 80 |
| GO:00164855 | Prostate | BPH | protein processing | 62/3107 | 225/18723 | 2.22e-05 | 2.67e-04 | 62 |
| GO:005160415 | Prostate | Tumor | protein maturation | 81/3246 | 294/18723 | 7.58e-06 | 1.13e-04 | 81 |
| GO:001648512 | Prostate | Tumor | protein processing | 63/3246 | 225/18723 | 4.40e-05 | 4.98e-04 | 63 |
| GO:00313651 | Skin | AK | N-terminal protein amino acid modification | 9/1910 | 30/18723 | 2.30e-03 | 1.52e-02 | 9 |
| Page: 1 2 |
| Pathway ID | Tissue | Disease Stage | Description | Gene Ratio | Bg Ratio | pvalue | p.adjust | qvalue | Count |
| Page: 1 |
Top |
Cell-cell communication analysis |
| Identification of potential cell-cell interactions between two cell types and their ligand-receptor pairs for different disease states |
| Ligand | Receptor | LRpair | Pathway | Tissue | Disease Stage |
| Page: 1 |
Top |
Single-cell gene regulatory network inference analysis |
| Find out the significant the regulons (TFs) and the target genes of each regulon across cell types for different disease states |
| TF | Cell Type | Tissue | Disease Stage | Target Gene | RSS | Regulon Activity |
| ∗The dot plots of a searched regulon are shown for all cell subpopulations in each disease state of each tissue based on the regulon specific score inferred using pySCENIC and by calculating the average expression. |
| Page: 1 |
Top |
Somatic mutation of malignant transformation related genes |
| Annotation of somatic variants for genes involved in malignant transformation |
| Hugo Symbol | Variant Class | Variant Classification | dbSNP RS | HGVSc | HGVSp | HGVSp Short | SWISSPROT | BIOTYPE | SIFT | PolyPhen | Tumor Sample Barcode | Tissue | Histology | Sex | Age | Stage | Therapy Types | Drugs | Outcome |
| METAP2 | SNV | Missense_Mutation | c.758N>T | p.Gly253Val | p.G253V | P50579 | protein_coding | deleterious(0) | probably_damaging(1) | TCGA-A8-A06U-01 | Breast | breast invasive carcinoma | Female | >=65 | I/II | Unknown | Unknown | SD | |
| METAP2 | SNV | Missense_Mutation | rs752983315 | c.614G>A | p.Arg205His | p.R205H | P50579 | protein_coding | deleterious(0) | probably_damaging(0.994) | TCGA-AO-A0JC-01 | Breast | breast invasive carcinoma | Female | <65 | I/II | Chemotherapy | fluorouracil | SD |
| METAP2 | SNV | Missense_Mutation | c.1051N>A | p.Glu351Lys | p.E351K | P50579 | protein_coding | deleterious(0.01) | possibly_damaging(0.822) | TCGA-GM-A2DO-01 | Breast | breast invasive carcinoma | Female | <65 | I/II | Hormone Therapy | tamoxiphen | CR | |
| METAP2 | SNV | Missense_Mutation | novel | c.1253N>A | p.Arg418Lys | p.R418K | P50579 | protein_coding | deleterious(0.04) | possibly_damaging(0.769) | TCGA-LD-A74U-01 | Breast | breast invasive carcinoma | Female | >=65 | III/IV | Chemotherapy | taxotere | SD |
| METAP2 | SNV | Missense_Mutation | novel | c.281N>A | p.Gly94Glu | p.G94E | P50579 | protein_coding | tolerated(0.28) | benign(0.025) | TCGA-C5-A2LZ-01 | Cervix | cervical & endocervical cancer | Female | >=65 | III/IV | Unknown | Unknown | PD |
| METAP2 | SNV | Missense_Mutation | novel | c.797N>T | p.Thr266Ile | p.T266I | P50579 | protein_coding | deleterious(0) | probably_damaging(1) | TCGA-AA-3811-01 | Colorectum | colon adenocarcinoma | Female | >=65 | III/IV | Unknown | Unknown | PD |
| METAP2 | SNV | Missense_Mutation | novel | c.463N>C | p.Lys155Gln | p.K155Q | P50579 | protein_coding | deleterious(0) | benign(0.049) | TCGA-AZ-4315-01 | Colorectum | colon adenocarcinoma | Male | <65 | I/II | Unknown | Unknown | SD |
| METAP2 | SNV | Missense_Mutation | c.473N>C | p.Leu158Ser | p.L158S | P50579 | protein_coding | deleterious(0.02) | benign(0.024) | TCGA-CA-6718-01 | Colorectum | colon adenocarcinoma | Male | <65 | I/II | Unknown | Unknown | PD | |
| METAP2 | SNV | Missense_Mutation | c.908N>T | p.Ala303Val | p.A303V | P50579 | protein_coding | deleterious(0.05) | benign(0.028) | TCGA-G4-6588-01 | Colorectum | colon adenocarcinoma | Female | <65 | I/II | Unknown | Unknown | SD | |
| METAP2 | SNV | Missense_Mutation | c.223G>A | p.Ala75Thr | p.A75T | P50579 | protein_coding | tolerated_low_confidence(0.36) | benign(0) | TCGA-G4-6628-01 | Colorectum | colon adenocarcinoma | Male | >=65 | I/II | Unknown | Unknown | SD |
| Page: 1 2 3 4 5 |
Top |
Related drugs of malignant transformation related genes |
| Identification of chemicals and drugs interact with genes involved in malignant transfromation |
| (DGIdb 4.0) |
| Entrez ID | Symbol | Category | Interaction Types | Drug Claim Name | Drug Name | PMIDs |
| 10988 | METAP2 | ENZYME, DRUGGABLE GENOME, KINASE, PROTEASE | PPI-2458 | PPI-2458 | ||
| 10988 | METAP2 | ENZYME, DRUGGABLE GENOME, KINASE, PROTEASE | PPI-2458 | PPI-2458 | ||
| 10988 | METAP2 | ENZYME, DRUGGABLE GENOME, KINASE, PROTEASE | BELORANIB | BELORANIB | ||
| 10988 | METAP2 | ENZYME, DRUGGABLE GENOME, KINASE, PROTEASE | Beloranib | BELORANIB | ||
| 10988 | METAP2 | ENZYME, DRUGGABLE GENOME, KINASE, PROTEASE | XMT-1107 | |||
| 10988 | METAP2 | ENZYME, DRUGGABLE GENOME, KINASE, PROTEASE | D-Methionine | |||
| 10988 | METAP2 | ENZYME, DRUGGABLE GENOME, KINASE, PROTEASE | inhibitor | CHEMBL2103847 | TOSEDOSTAT | |
| 10988 | METAP2 | ENZYME, DRUGGABLE GENOME, KINASE, PROTEASE | inhibitor | 252166655 | BELORANIB | |
| 10988 | METAP2 | ENZYME, DRUGGABLE GENOME, KINASE, PROTEASE | inhibitor | 178103100 | ||
| 10988 | METAP2 | ENZYME, DRUGGABLE GENOME, KINASE, PROTEASE | M8891 |
| Page: 1 2 |

Copyright 2023-Present -The University of Texas Health Science Center at Houston |