
|
|||||
|
 | |
| |
| |
| |
| |
| |
|
Gene: METAP1 |
Gene summary for METAP1 |
| Gene information | Species | Human | Gene symbol | METAP1 | Gene ID | 23173 |
| Gene name | methionyl aminopeptidase 1 | |
| Gene Alias | MAP1A | |
| Cytomap | 4q23 | |
| Gene Type | protein-coding | GO ID | GO:0001775 | UniProtAcc | P53582 |
Top |
Malignant transformation analysis |
| Identification of the aberrant gene expression in precancerous and cancerous lesions by comparing the gene expression of stem-like cells in diseased tissues with normal stem cells |
| Entrez ID | Symbol | Replicates | Species | Organ | Tissue | Adj P-value | Log2FC | Malignancy |
| 23173 | METAP1 | LZE2T | Human | Esophagus | ESCC | 1.10e-02 | 3.16e-01 | 0.082 |
| 23173 | METAP1 | LZE4T | Human | Esophagus | ESCC | 2.41e-13 | 4.24e-01 | 0.0811 |
| 23173 | METAP1 | LZE5T | Human | Esophagus | ESCC | 4.27e-05 | 1.37e-01 | 0.0514 |
| 23173 | METAP1 | LZE7T | Human | Esophagus | ESCC | 2.10e-07 | 3.65e-01 | 0.0667 |
| 23173 | METAP1 | LZE8T | Human | Esophagus | ESCC | 2.01e-10 | 5.07e-01 | 0.067 |
| 23173 | METAP1 | LZE20T | Human | Esophagus | ESCC | 8.46e-08 | 1.23e-01 | 0.0662 |
| 23173 | METAP1 | LZE24T | Human | Esophagus | ESCC | 2.09e-09 | 3.41e-01 | 0.0596 |
| 23173 | METAP1 | LZE21T | Human | Esophagus | ESCC | 1.46e-02 | 3.49e-01 | 0.0655 |
| 23173 | METAP1 | LZE6T | Human | Esophagus | ESCC | 3.71e-09 | 2.12e-01 | 0.0845 |
| 23173 | METAP1 | P1T-E | Human | Esophagus | ESCC | 6.13e-10 | 3.11e-01 | 0.0875 |
| 23173 | METAP1 | P2T-E | Human | Esophagus | ESCC | 1.31e-35 | 6.85e-01 | 0.1177 |
| 23173 | METAP1 | P4T-E | Human | Esophagus | ESCC | 4.44e-35 | 1.03e+00 | 0.1323 |
| 23173 | METAP1 | P5T-E | Human | Esophagus | ESCC | 6.50e-19 | 2.15e-01 | 0.1327 |
| 23173 | METAP1 | P8T-E | Human | Esophagus | ESCC | 1.70e-14 | 2.15e-01 | 0.0889 |
| 23173 | METAP1 | P9T-E | Human | Esophagus | ESCC | 4.78e-19 | 2.64e-01 | 0.1131 |
| 23173 | METAP1 | P10T-E | Human | Esophagus | ESCC | 3.25e-23 | 1.22e-01 | 0.116 |
| 23173 | METAP1 | P11T-E | Human | Esophagus | ESCC | 5.00e-12 | 6.57e-01 | 0.1426 |
| 23173 | METAP1 | P12T-E | Human | Esophagus | ESCC | 9.79e-21 | 5.44e-01 | 0.1122 |
| 23173 | METAP1 | P15T-E | Human | Esophagus | ESCC | 2.31e-39 | 9.44e-01 | 0.1149 |
| 23173 | METAP1 | P16T-E | Human | Esophagus | ESCC | 1.34e-22 | 4.64e-01 | 0.1153 |
| Page: 1 2 3 4 5 |
| Tissue | Expression Dynamics | Abbreviation |
| Esophagus | 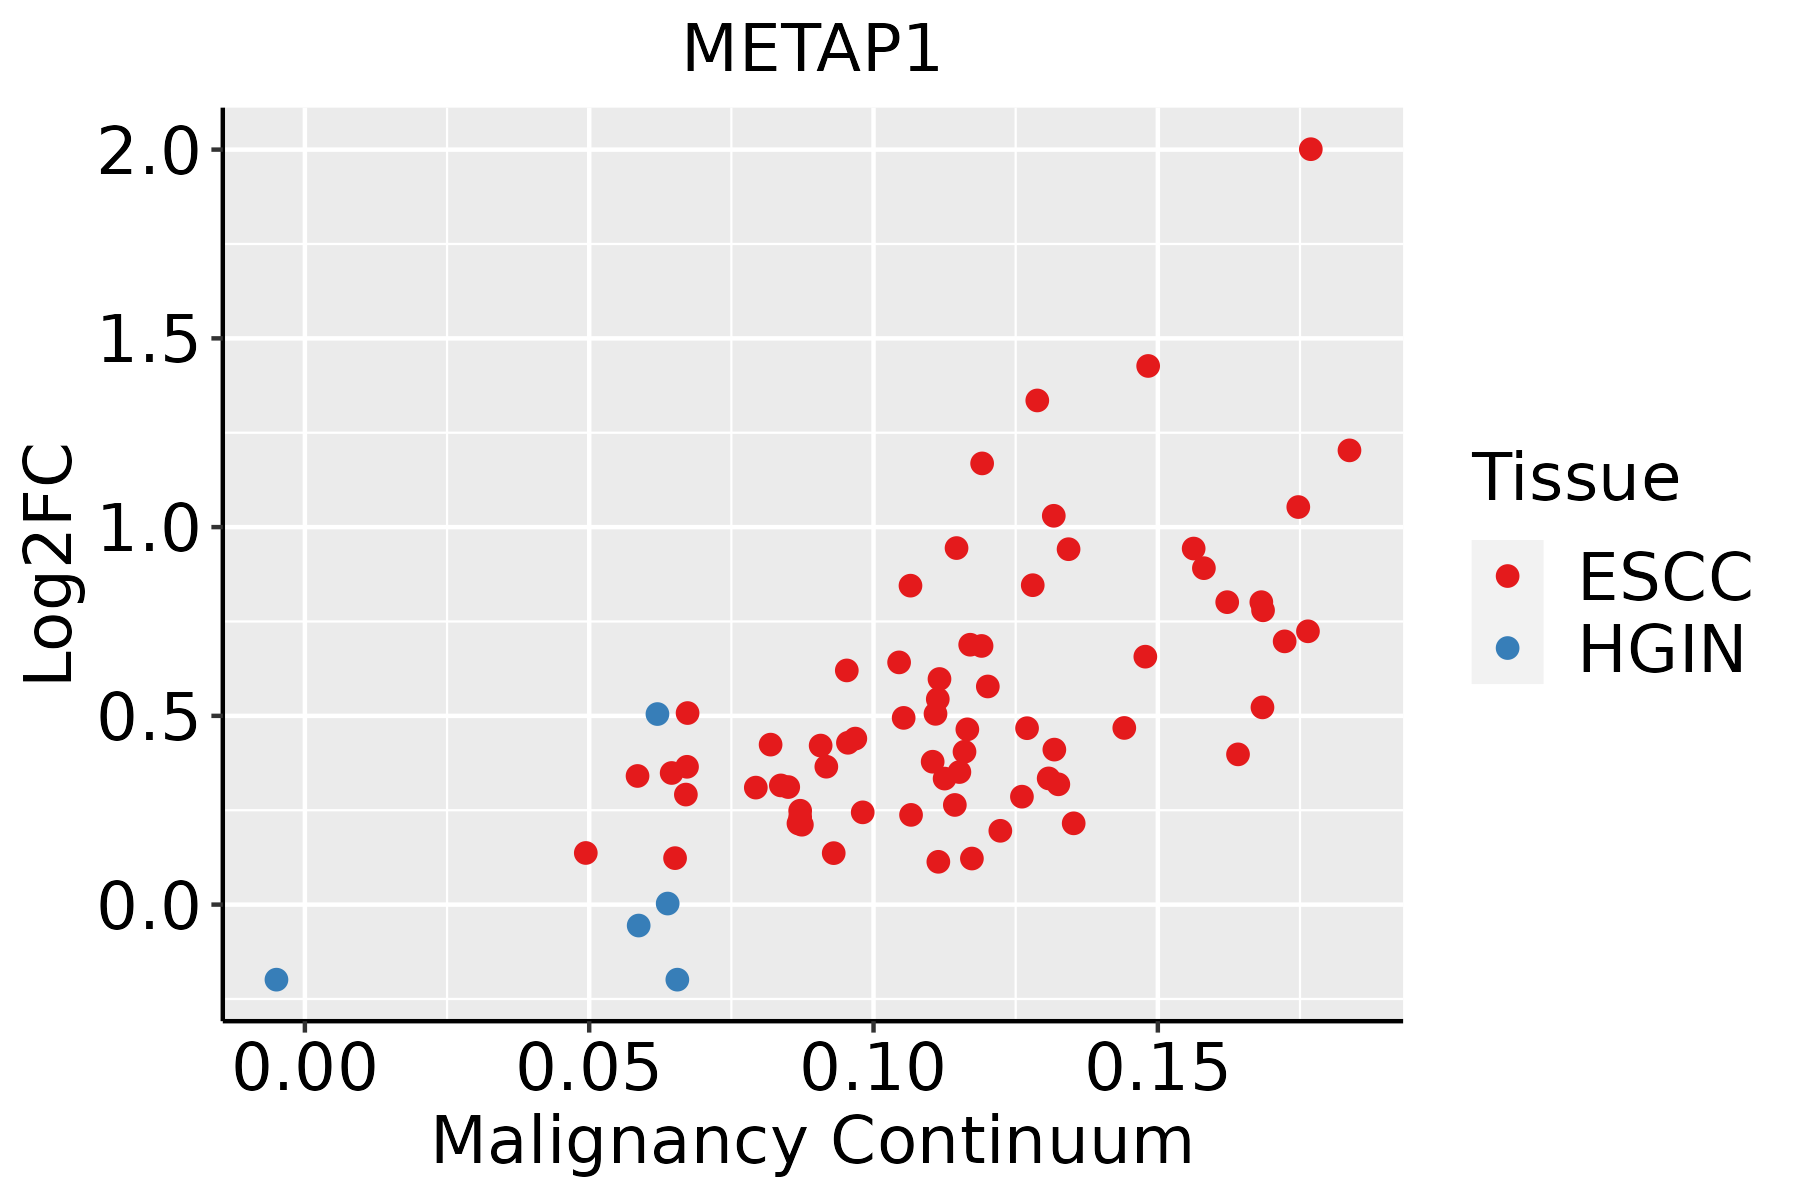 | ESCC: Esophageal squamous cell carcinoma |
| HGIN: High-grade intraepithelial neoplasias | ||
| LGIN: Low-grade intraepithelial neoplasias | ||
| Liver | 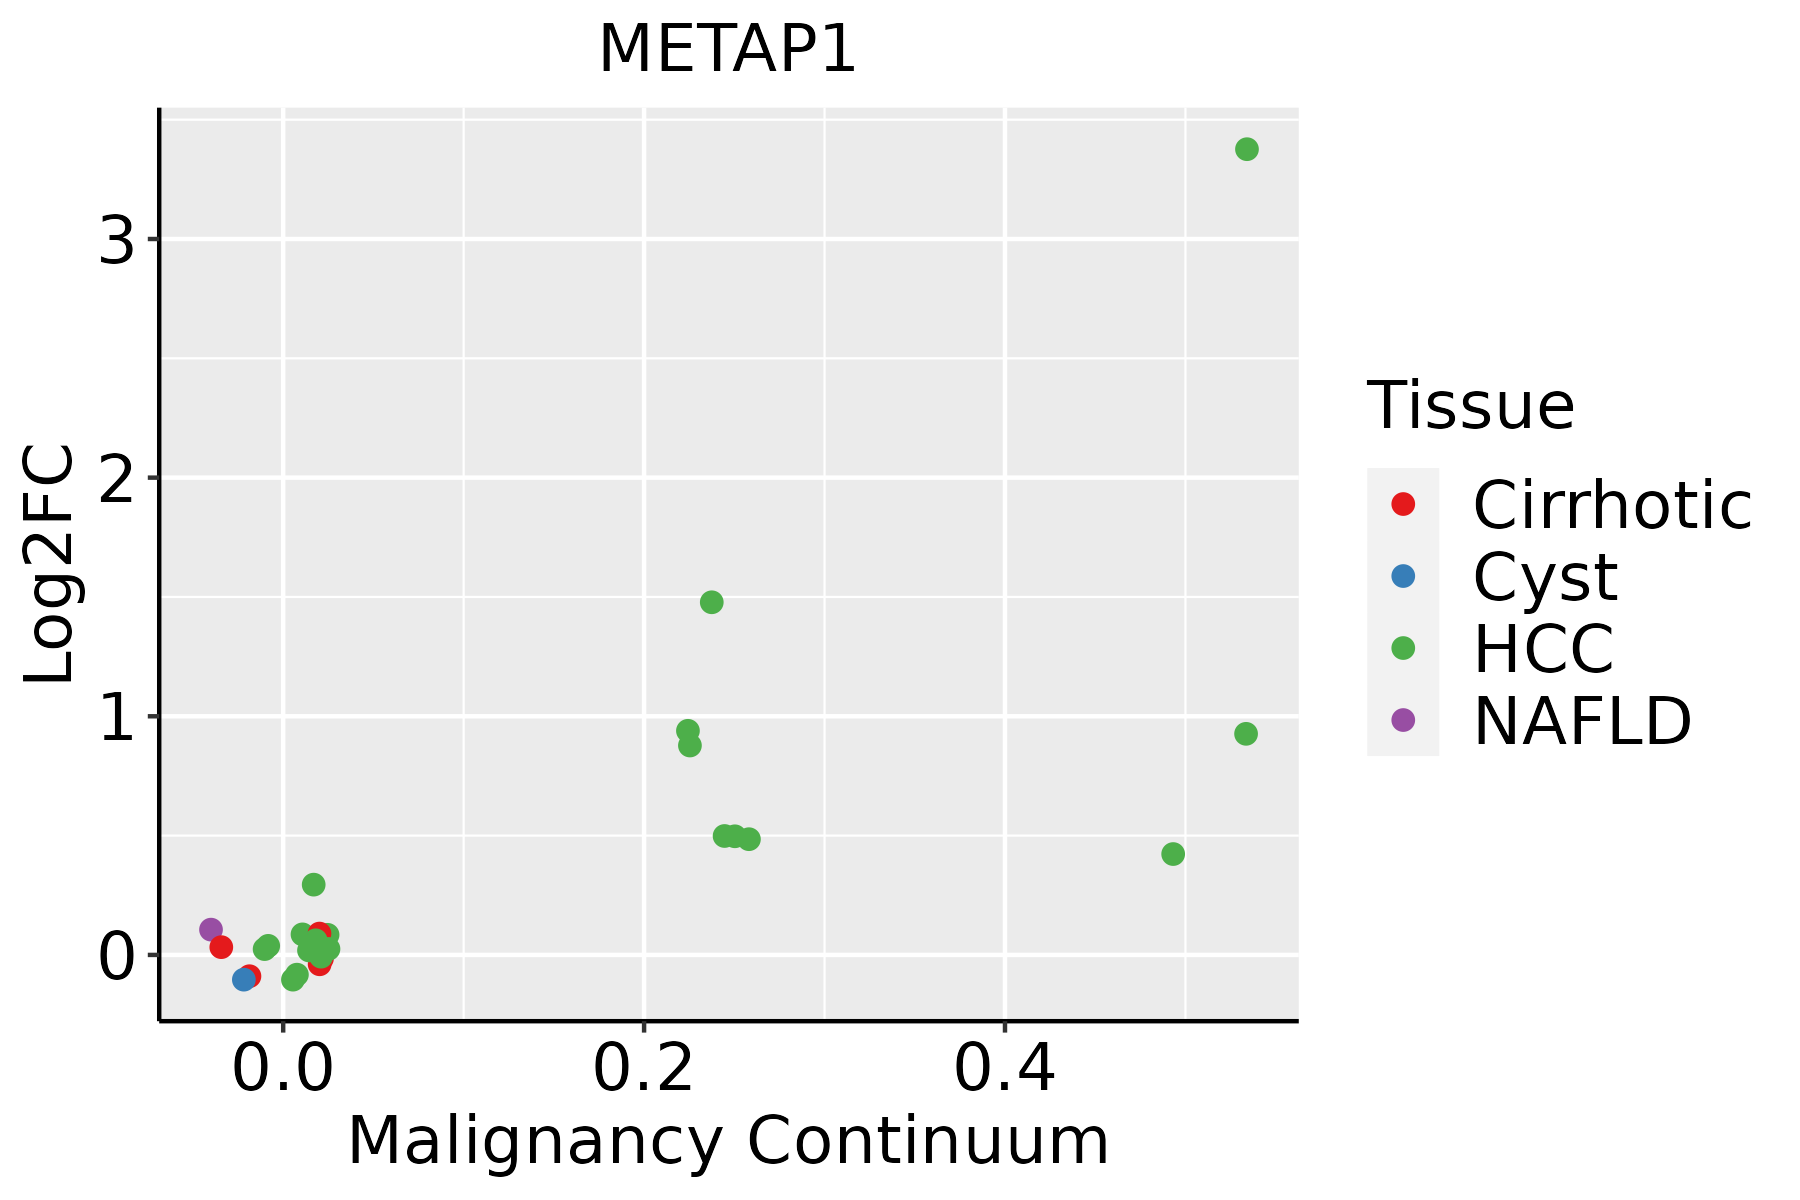 | HCC: Hepatocellular carcinoma |
| NAFLD: Non-alcoholic fatty liver disease | ||
| Oral Cavity | 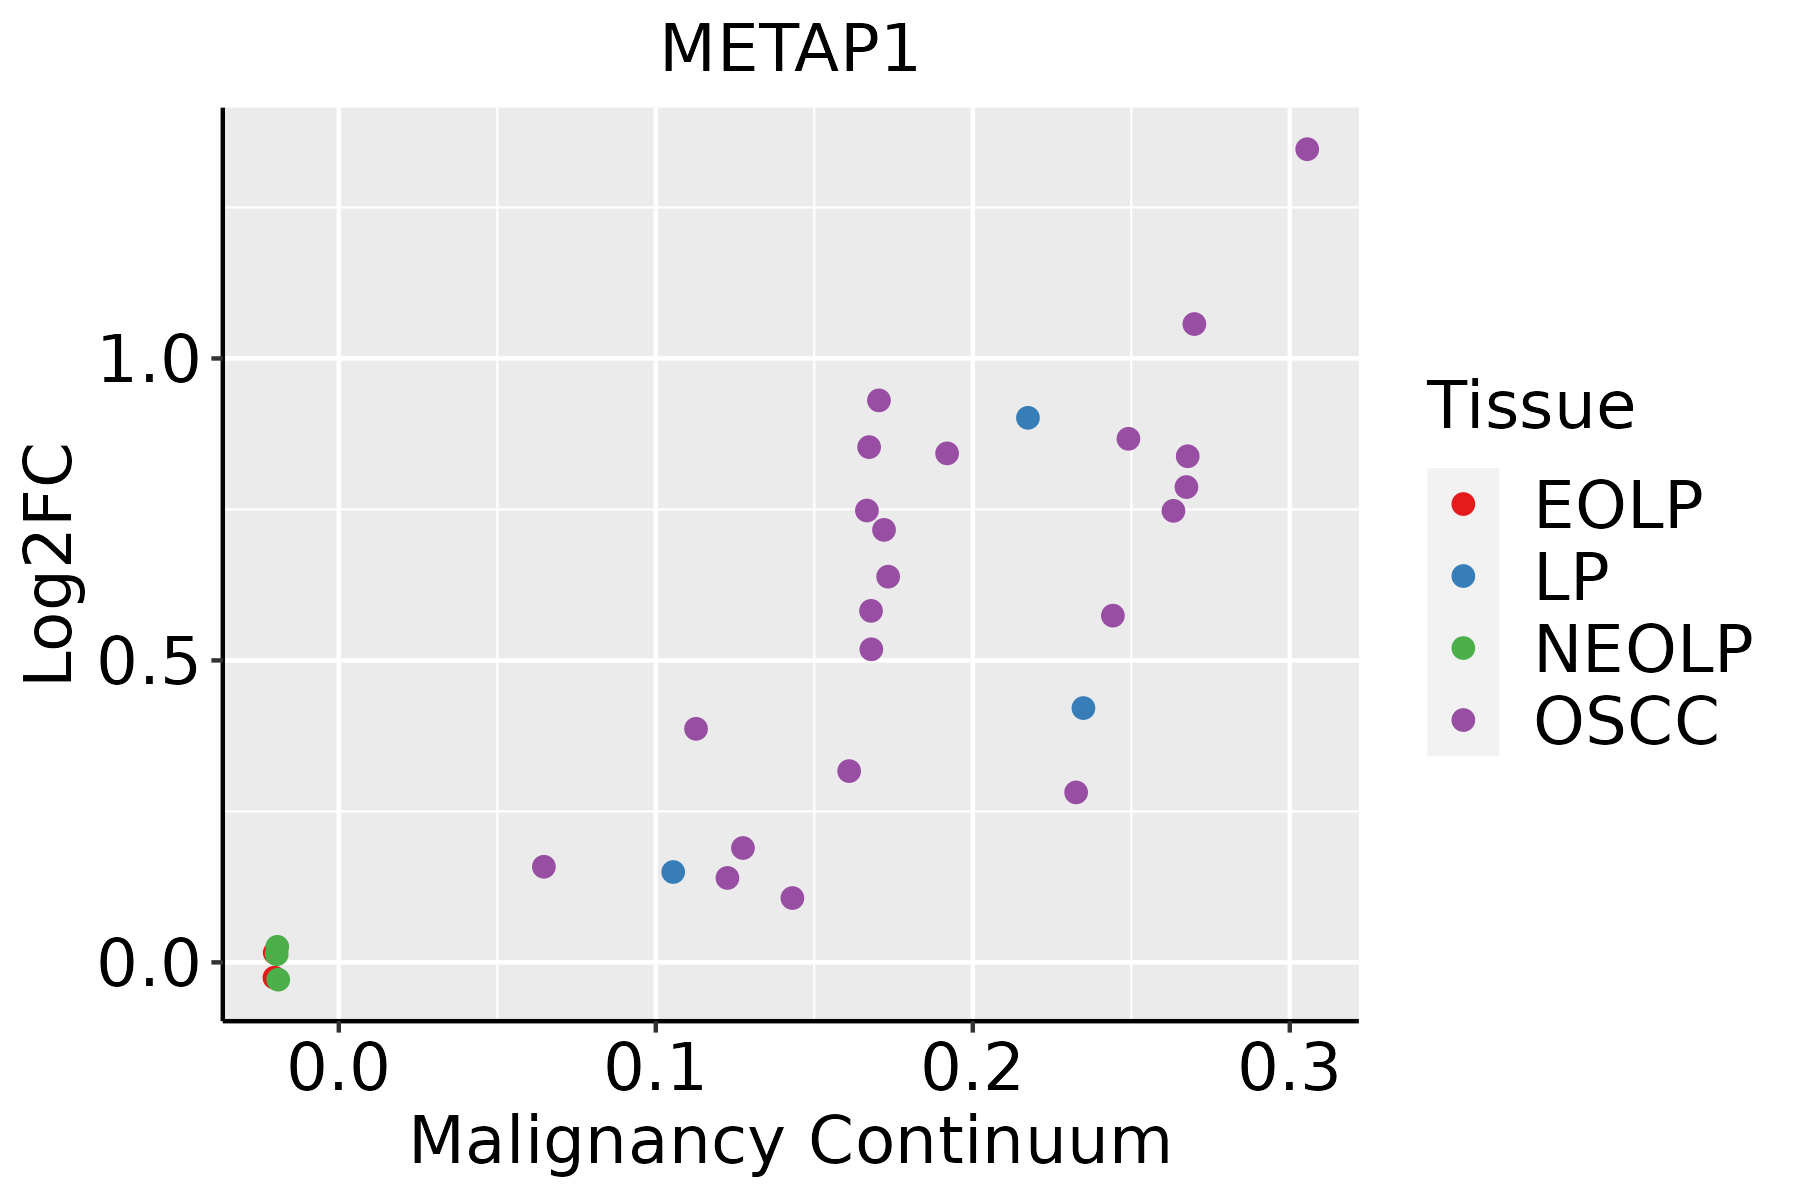 | EOLP: Erosive Oral lichen planus |
| LP: leukoplakia | ||
| NEOLP: Non-erosive oral lichen planus | ||
| OSCC: Oral squamous cell carcinoma | ||
| Skin | 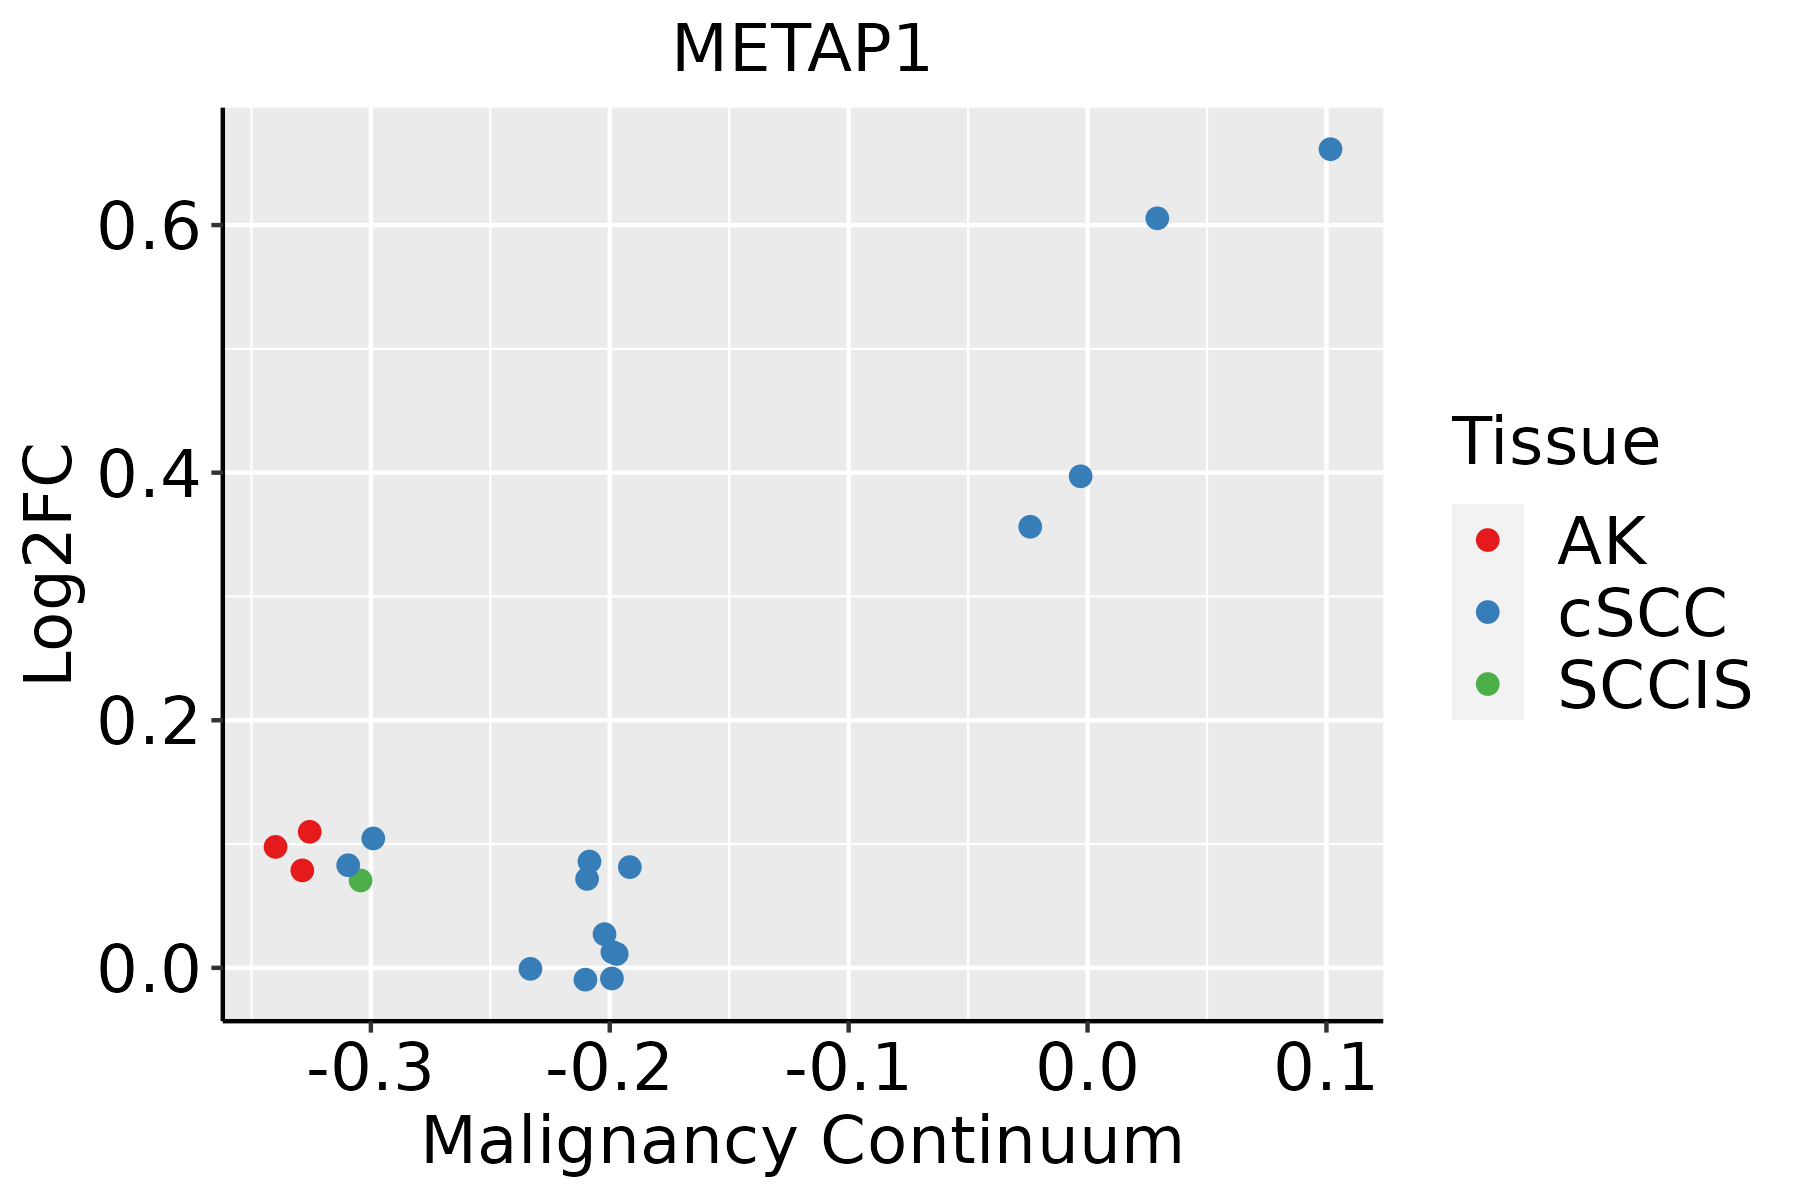 | AK: Actinic keratosis |
| cSCC: Cutaneous squamous cell carcinoma | ||
| SCCIS:squamous cell carcinoma in situ |
| ∗log2FC in expression of this searched gene in stem-like cells from each diseased tissue sample relative to stem-like cells in normal samples in each tissue plotted against the malignancy continuum. Samples are colored based on if they are from different disease stage. |
Top |
Malignant transformation related pathway analysis |
| Find out the enriched GO biological processes and KEGG pathways involved in transition from healthy to precancer to cancer |
| Tissue | Disease Stage | Enriched GO biological Processes |
| Colorectum | AD |  |
| Colorectum | SER |  |
| Colorectum | MSS |  |
| Colorectum | MSI-H |  |
| Colorectum | FAP |  |
| ∗Top 15 enriched GO BP terms are showed in the bar plot of each disease state in each tissue. Each row represents a significant GO biological process which is colored according to the -log10(p.adjust). |
| Page: 1 2 3 4 5 6 7 8 9 |
| GO ID | Tissue | Disease Stage | Description | Gene Ratio | Bg Ratio | pvalue | p.adjust | Count |
| GO:0006417111 | Esophagus | ESCC | regulation of translation | 304/8552 | 468/18723 | 1.53e-17 | 1.33e-15 | 304 |
| GO:004206027 | Esophagus | ESCC | wound healing | 243/8552 | 422/18723 | 4.62e-07 | 6.25e-06 | 243 |
| GO:00182061 | Esophagus | ESCC | peptidyl-methionine modification | 12/8552 | 13/18723 | 6.18e-04 | 3.32e-03 | 12 |
| GO:003410920 | Esophagus | ESCC | homotypic cell-cell adhesion | 54/8552 | 90/18723 | 4.33e-03 | 1.72e-02 | 54 |
| GO:0031365 | Esophagus | ESCC | N-terminal protein amino acid modification | 21/8552 | 30/18723 | 6.17e-03 | 2.27e-02 | 21 |
| GO:000641722 | Liver | HCC | regulation of translation | 287/7958 | 468/18723 | 8.79e-17 | 8.08e-15 | 287 |
| GO:004206022 | Liver | HCC | wound healing | 219/7958 | 422/18723 | 5.34e-05 | 5.04e-04 | 219 |
| GO:00075962 | Liver | HCC | blood coagulation | 118/7958 | 217/18723 | 2.63e-04 | 1.94e-03 | 118 |
| GO:003410912 | Liver | HCC | homotypic cell-cell adhesion | 55/7958 | 90/18723 | 2.81e-04 | 2.02e-03 | 55 |
| GO:00075992 | Liver | HCC | hemostasis | 119/7958 | 222/18723 | 5.25e-04 | 3.41e-03 | 119 |
| GO:00508172 | Liver | HCC | coagulation | 118/7958 | 222/18723 | 8.41e-04 | 5.03e-03 | 118 |
| GO:005087822 | Liver | HCC | regulation of body fluid levels | 191/7958 | 379/18723 | 1.06e-03 | 6.11e-03 | 191 |
| GO:007052712 | Liver | HCC | platelet aggregation | 40/7958 | 67/18723 | 3.35e-03 | 1.53e-02 | 40 |
| GO:0018206 | Liver | HCC | peptidyl-methionine modification | 10/7958 | 13/18723 | 1.28e-02 | 4.61e-02 | 10 |
| GO:000641720 | Oral cavity | OSCC | regulation of translation | 274/7305 | 468/18723 | 4.39e-18 | 4.63e-16 | 274 |
| GO:004206020 | Oral cavity | OSCC | wound healing | 237/7305 | 422/18723 | 4.51e-13 | 2.18e-11 | 237 |
| GO:003410919 | Oral cavity | OSCC | homotypic cell-cell adhesion | 55/7305 | 90/18723 | 1.78e-05 | 1.73e-04 | 55 |
| GO:005087819 | Oral cavity | OSCC | regulation of body fluid levels | 179/7305 | 379/18723 | 6.19e-04 | 3.50e-03 | 179 |
| GO:007052718 | Oral cavity | OSCC | platelet aggregation | 37/7305 | 67/18723 | 5.14e-03 | 2.01e-02 | 37 |
| GO:00075969 | Oral cavity | OSCC | blood coagulation | 102/7305 | 217/18723 | 9.69e-03 | 3.43e-02 | 102 |
| Page: 1 2 |
| Pathway ID | Tissue | Disease Stage | Description | Gene Ratio | Bg Ratio | pvalue | p.adjust | qvalue | Count |
| Page: 1 |
Top |
Cell-cell communication analysis |
| Identification of potential cell-cell interactions between two cell types and their ligand-receptor pairs for different disease states |
| Ligand | Receptor | LRpair | Pathway | Tissue | Disease Stage |
| Page: 1 |
Top |
Single-cell gene regulatory network inference analysis |
| Find out the significant the regulons (TFs) and the target genes of each regulon across cell types for different disease states |
| TF | Cell Type | Tissue | Disease Stage | Target Gene | RSS | Regulon Activity |
| ∗The dot plots of a searched regulon are shown for all cell subpopulations in each disease state of each tissue based on the regulon specific score inferred using pySCENIC and by calculating the average expression. |
| Page: 1 |
Top |
Somatic mutation of malignant transformation related genes |
| Annotation of somatic variants for genes involved in malignant transformation |
| Hugo Symbol | Variant Class | Variant Classification | dbSNP RS | HGVSc | HGVSp | HGVSp Short | SWISSPROT | BIOTYPE | SIFT | PolyPhen | Tumor Sample Barcode | Tissue | Histology | Sex | Age | Stage | Therapy Types | Drugs | Outcome |
| METAP1 | SNV | Missense_Mutation | novel | c.691N>T | p.Asp231Tyr | p.D231Y | P53582 | protein_coding | deleterious(0) | probably_damaging(1) | TCGA-A1-A0SQ-01 | Breast | breast invasive carcinoma | Female | <65 | I/II | Chemotherapy | ac | SD |
| METAP1 | SNV | Missense_Mutation | c.310N>G | p.Gln104Glu | p.Q104E | P53582 | protein_coding | tolerated(0.48) | benign(0) | TCGA-AC-A23H-01 | Breast | breast invasive carcinoma | Female | >=65 | I/II | Unknown | Unknown | PD | |
| METAP1 | SNV | Missense_Mutation | novel | c.494A>G | p.Glu165Gly | p.E165G | P53582 | protein_coding | deleterious(0) | probably_damaging(0.973) | TCGA-XS-A8TJ-01 | Cervix | cervical & endocervical cancer | Female | <65 | I/II | Chemotherapy | cisplatin | SD |
| METAP1 | SNV | Missense_Mutation | c.848N>T | p.Asn283Ile | p.N283I | P53582 | protein_coding | deleterious(0.03) | possibly_damaging(0.564) | TCGA-AA-3715-01 | Colorectum | colon adenocarcinoma | Male | >=65 | I/II | Unknown | Unknown | PD | |
| METAP1 | SNV | Missense_Mutation | c.866G>A | p.Arg289Gln | p.R289Q | P53582 | protein_coding | deleterious(0) | possibly_damaging(0.745) | TCGA-CA-6718-01 | Colorectum | colon adenocarcinoma | Male | <65 | I/II | Unknown | Unknown | PD | |
| METAP1 | SNV | Missense_Mutation | c.644A>G | p.Asp215Gly | p.D215G | P53582 | protein_coding | deleterious(0) | probably_damaging(1) | TCGA-DM-A1HB-01 | Colorectum | colon adenocarcinoma | Male | >=65 | III/IV | Unknown | Unknown | SD | |
| METAP1 | SNV | Missense_Mutation | c.229N>A | p.Pro77Thr | p.P77T | P53582 | protein_coding | deleterious(0.03) | benign(0.094) | TCGA-AG-A02N-01 | Colorectum | rectum adenocarcinoma | Male | >=65 | I/II | Chemotherapy | folinic | CR | |
| METAP1 | insertion | Frame_Shift_Ins | novel | c.162_163insCATTTTAAGGAATATT | p.Ala55HisfsTer9 | p.A55Hfs*9 | P53582 | protein_coding | TCGA-AM-5820-01 | Colorectum | colon adenocarcinoma | Female | <65 | I/II | Unknown | Unknown | SD | ||
| METAP1 | SNV | Missense_Mutation | novel | c.655N>A | p.Val219Met | p.V219M | P53582 | protein_coding | deleterious(0) | possibly_damaging(0.828) | TCGA-A5-A1OF-01 | Endometrium | uterine corpus endometrioid carcinoma | Female | <65 | I/II | Unknown | Unknown | SD |
| METAP1 | SNV | Missense_Mutation | novel | c.254N>A | p.Gly85Asp | p.G85D | P53582 | protein_coding | deleterious(0) | probably_damaging(0.994) | TCGA-A5-A2K5-01 | Endometrium | uterine corpus endometrioid carcinoma | Female | >=65 | I/II | Unknown | Unknown | SD |
| Page: 1 2 3 4 |
Top |
Related drugs of malignant transformation related genes |
| Identification of chemicals and drugs interact with genes involved in malignant transfromation |
| (DGIdb 4.0) |
| Entrez ID | Symbol | Category | Interaction Types | Drug Claim Name | Drug Name | PMIDs |
| 23173 | METAP1 | DRUGGABLE GENOME, PROTEASE, ENZYME | inhibitor | CHEMBL2103847 | TOSEDOSTAT | |
| 23173 | METAP1 | DRUGGABLE GENOME, PROTEASE, ENZYME | inhibitor | 252166758 |
| Page: 1 |

Copyright 2023-Present -The University of Texas Health Science Center at Houston |