
|
|||||
|
 | |
| |
| |
| |
| |
| |
|
Gene: MEST |
Gene summary for MEST |
| Gene information | Species | Human | Gene symbol | MEST | Gene ID | 4232 |
| Gene name | mesoderm specific transcript | |
| Gene Alias | PEG1 | |
| Cytomap | 7q32.2 | |
| Gene Type | protein-coding | GO ID | GO:0007498 | UniProtAcc | B4DQW6 |
Top |
Malignant transformation analysis |
| Identification of the aberrant gene expression in precancerous and cancerous lesions by comparing the gene expression of stem-like cells in diseased tissues with normal stem cells |
| Entrez ID | Symbol | Replicates | Species | Organ | Tissue | Adj P-value | Log2FC | Malignancy |
| 4232 | MEST | LZE2T | Human | Esophagus | ESCC | 4.25e-05 | 7.75e-01 | 0.082 |
| 4232 | MEST | LZE4T | Human | Esophagus | ESCC | 4.73e-09 | 3.99e-01 | 0.0811 |
| 4232 | MEST | LZE7T | Human | Esophagus | ESCC | 8.87e-18 | 8.04e-01 | 0.0667 |
| 4232 | MEST | LZE20T | Human | Esophagus | ESCC | 1.14e-03 | 2.09e-01 | 0.0662 |
| 4232 | MEST | LZE22D1 | Human | Esophagus | HGIN | 2.01e-02 | 1.78e-01 | 0.0595 |
| 4232 | MEST | LZE22T | Human | Esophagus | ESCC | 3.16e-14 | 1.27e+00 | 0.068 |
| 4232 | MEST | LZE24T | Human | Esophagus | ESCC | 3.46e-23 | 6.57e-01 | 0.0596 |
| 4232 | MEST | LZE6T | Human | Esophagus | ESCC | 6.03e-06 | 4.62e-01 | 0.0845 |
| 4232 | MEST | P1T-E | Human | Esophagus | ESCC | 2.03e-03 | 4.53e-01 | 0.0875 |
| 4232 | MEST | P2T-E | Human | Esophagus | ESCC | 9.84e-40 | 7.64e-01 | 0.1177 |
| 4232 | MEST | P4T-E | Human | Esophagus | ESCC | 9.15e-53 | 1.53e+00 | 0.1323 |
| 4232 | MEST | P5T-E | Human | Esophagus | ESCC | 2.76e-21 | 6.19e-01 | 0.1327 |
| 4232 | MEST | P8T-E | Human | Esophagus | ESCC | 3.41e-55 | 1.07e+00 | 0.0889 |
| 4232 | MEST | P9T-E | Human | Esophagus | ESCC | 5.40e-09 | 2.67e-01 | 0.1131 |
| 4232 | MEST | P10T-E | Human | Esophagus | ESCC | 1.07e-73 | 1.29e+00 | 0.116 |
| 4232 | MEST | P11T-E | Human | Esophagus | ESCC | 2.76e-06 | 4.11e-01 | 0.1426 |
| 4232 | MEST | P12T-E | Human | Esophagus | ESCC | 6.43e-60 | 1.26e+00 | 0.1122 |
| 4232 | MEST | P15T-E | Human | Esophagus | ESCC | 4.18e-68 | 1.68e+00 | 0.1149 |
| 4232 | MEST | P16T-E | Human | Esophagus | ESCC | 7.75e-73 | 1.92e+00 | 0.1153 |
| 4232 | MEST | P17T-E | Human | Esophagus | ESCC | 2.65e-02 | 2.27e-01 | 0.1278 |
| Page: 1 2 3 4 5 6 |
| Tissue | Expression Dynamics | Abbreviation |
| Esophagus | 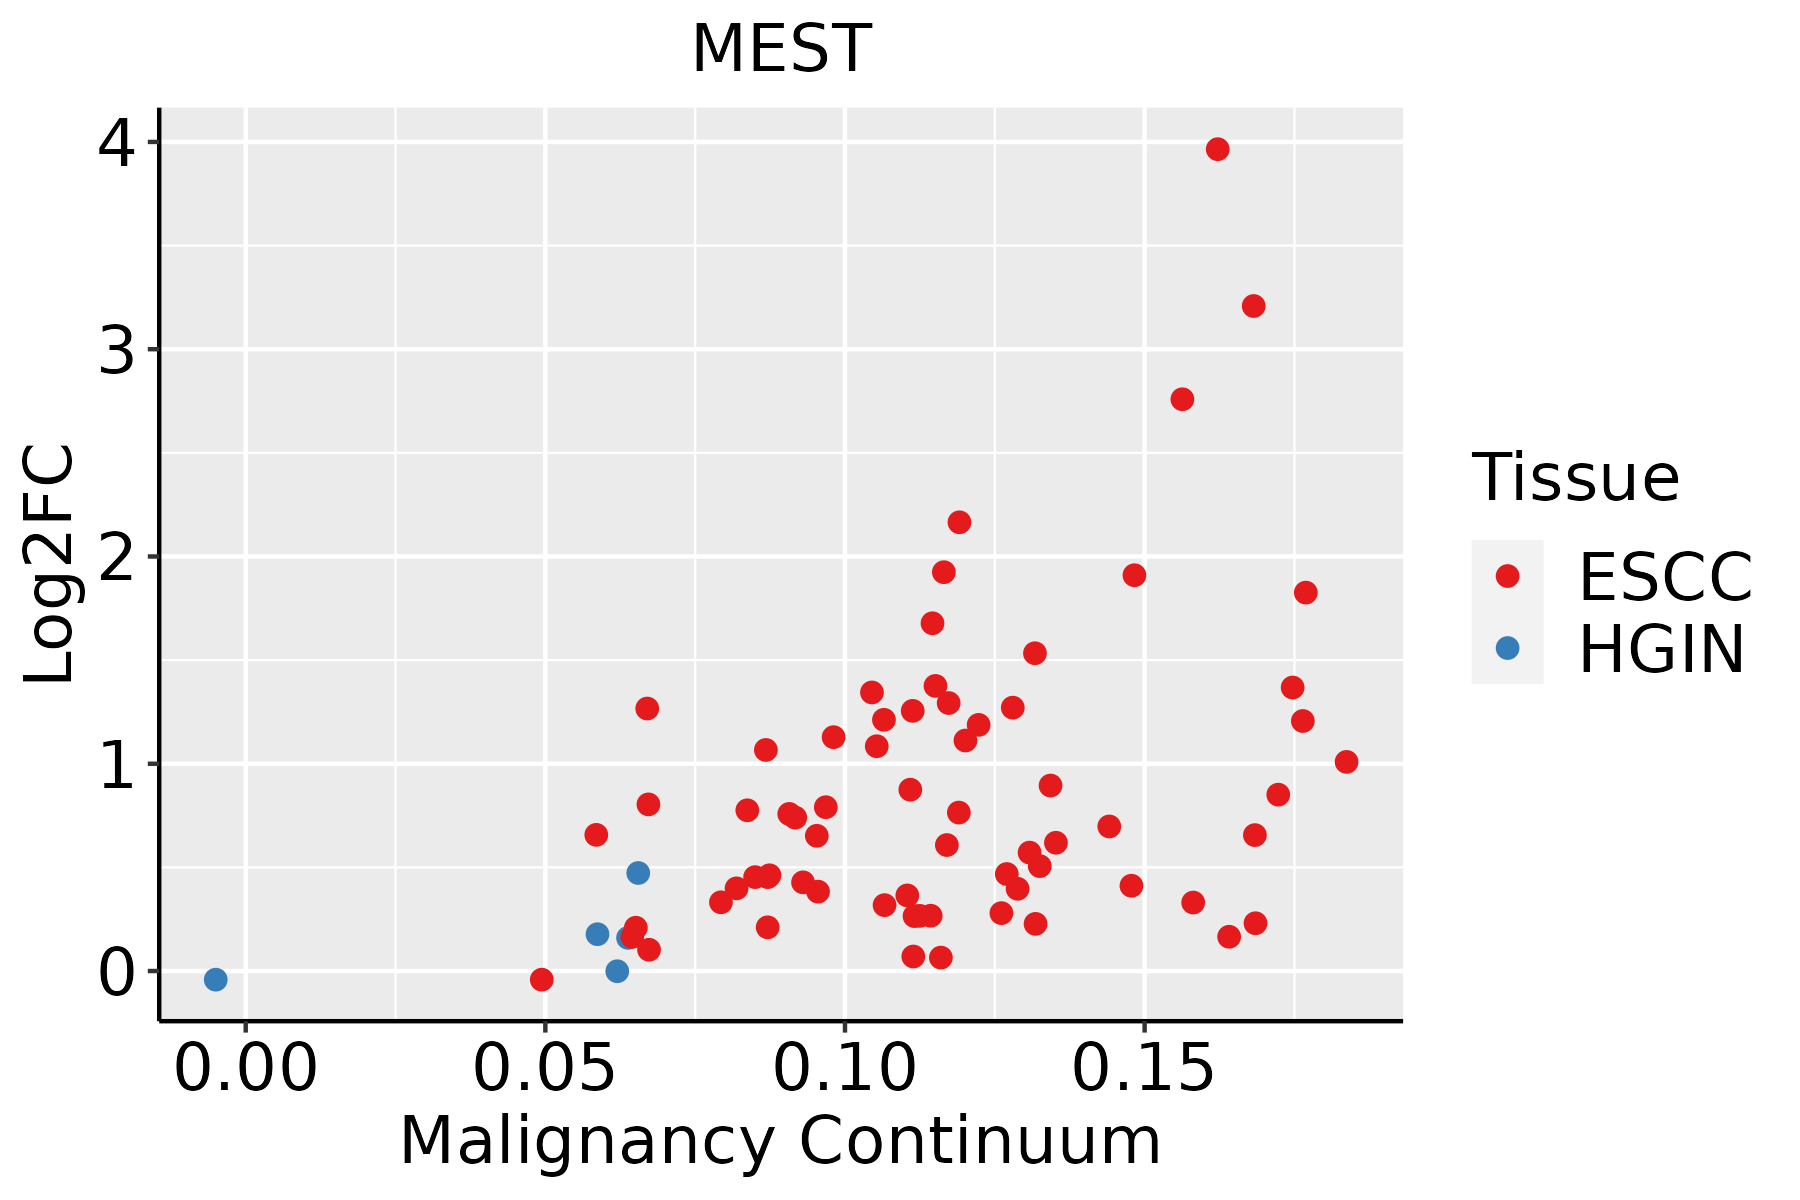 | ESCC: Esophageal squamous cell carcinoma |
| HGIN: High-grade intraepithelial neoplasias | ||
| LGIN: Low-grade intraepithelial neoplasias | ||
| Liver | 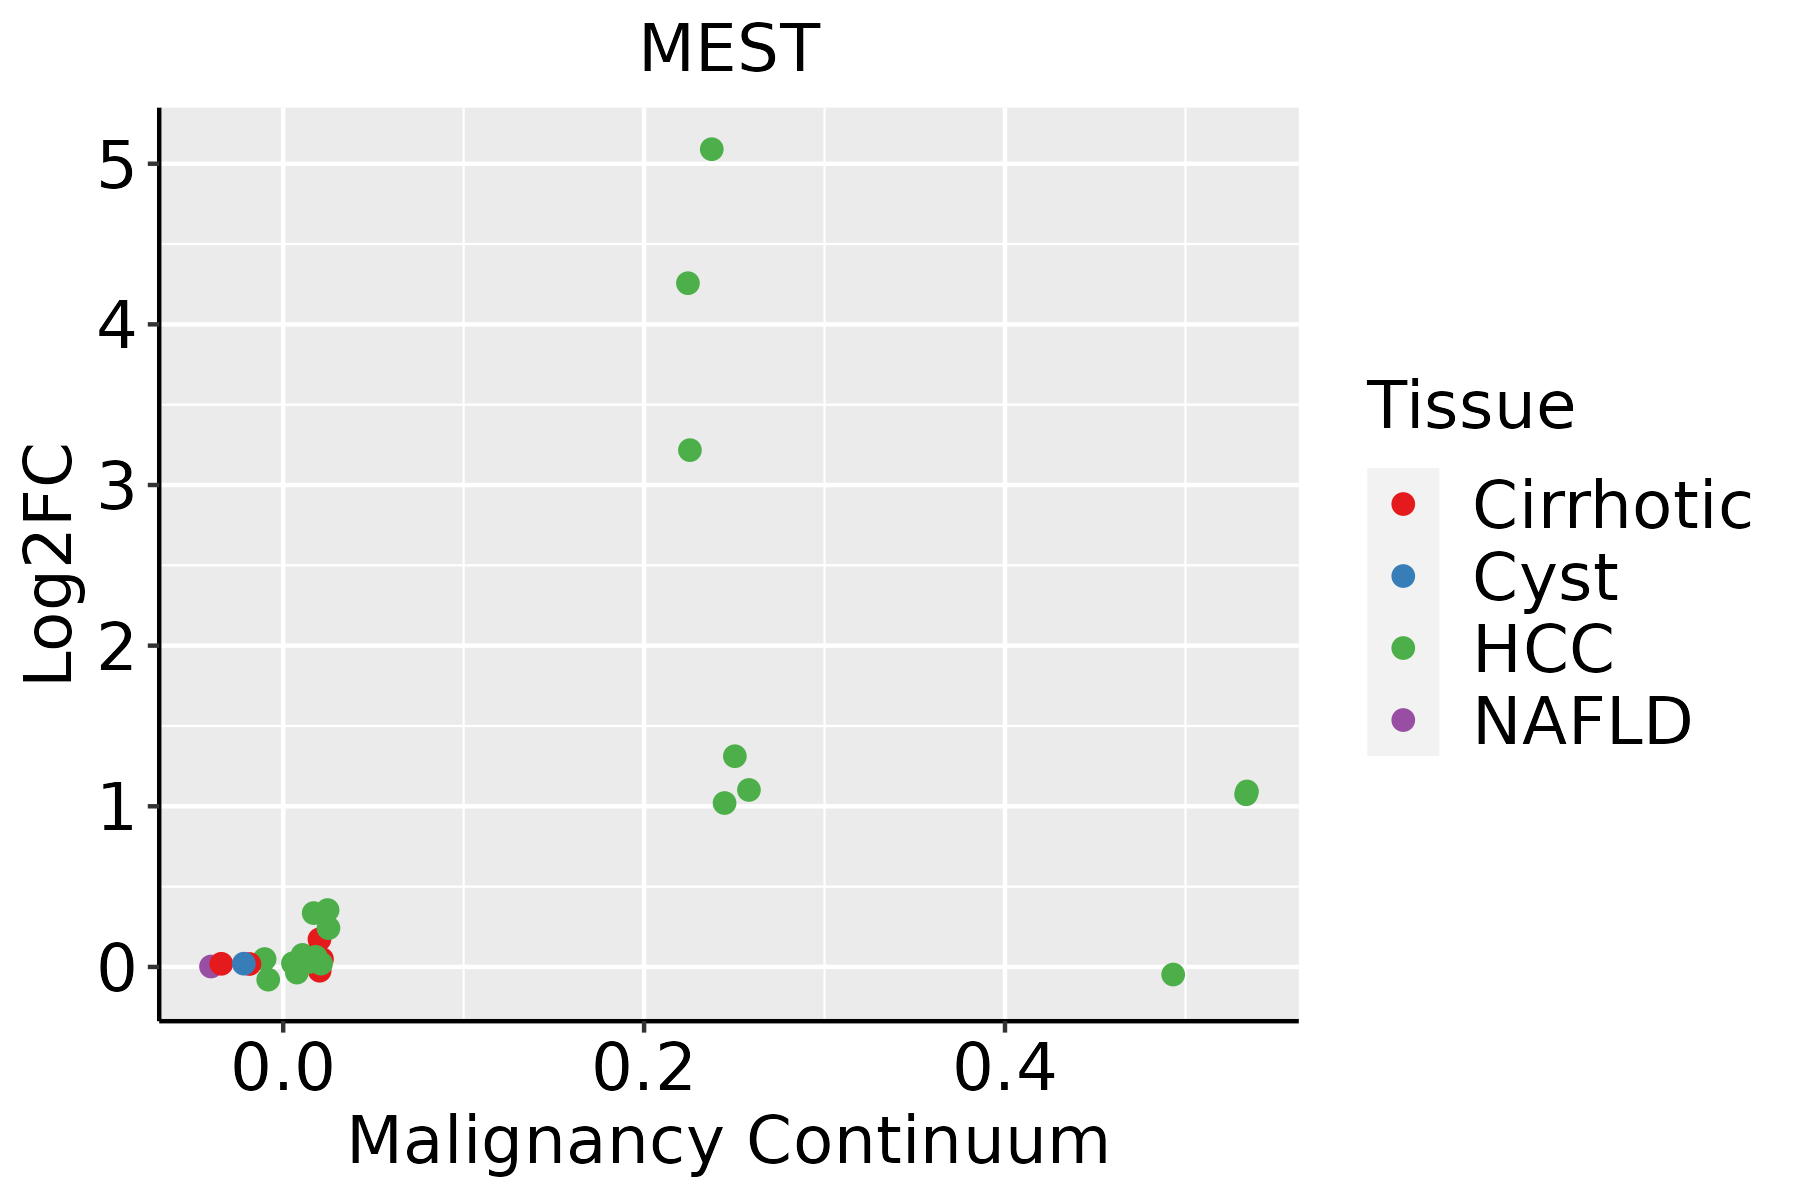 | HCC: Hepatocellular carcinoma |
| NAFLD: Non-alcoholic fatty liver disease | ||
| Oral Cavity |  | EOLP: Erosive Oral lichen planus |
| LP: leukoplakia | ||
| NEOLP: Non-erosive oral lichen planus | ||
| OSCC: Oral squamous cell carcinoma | ||
| Prostate | 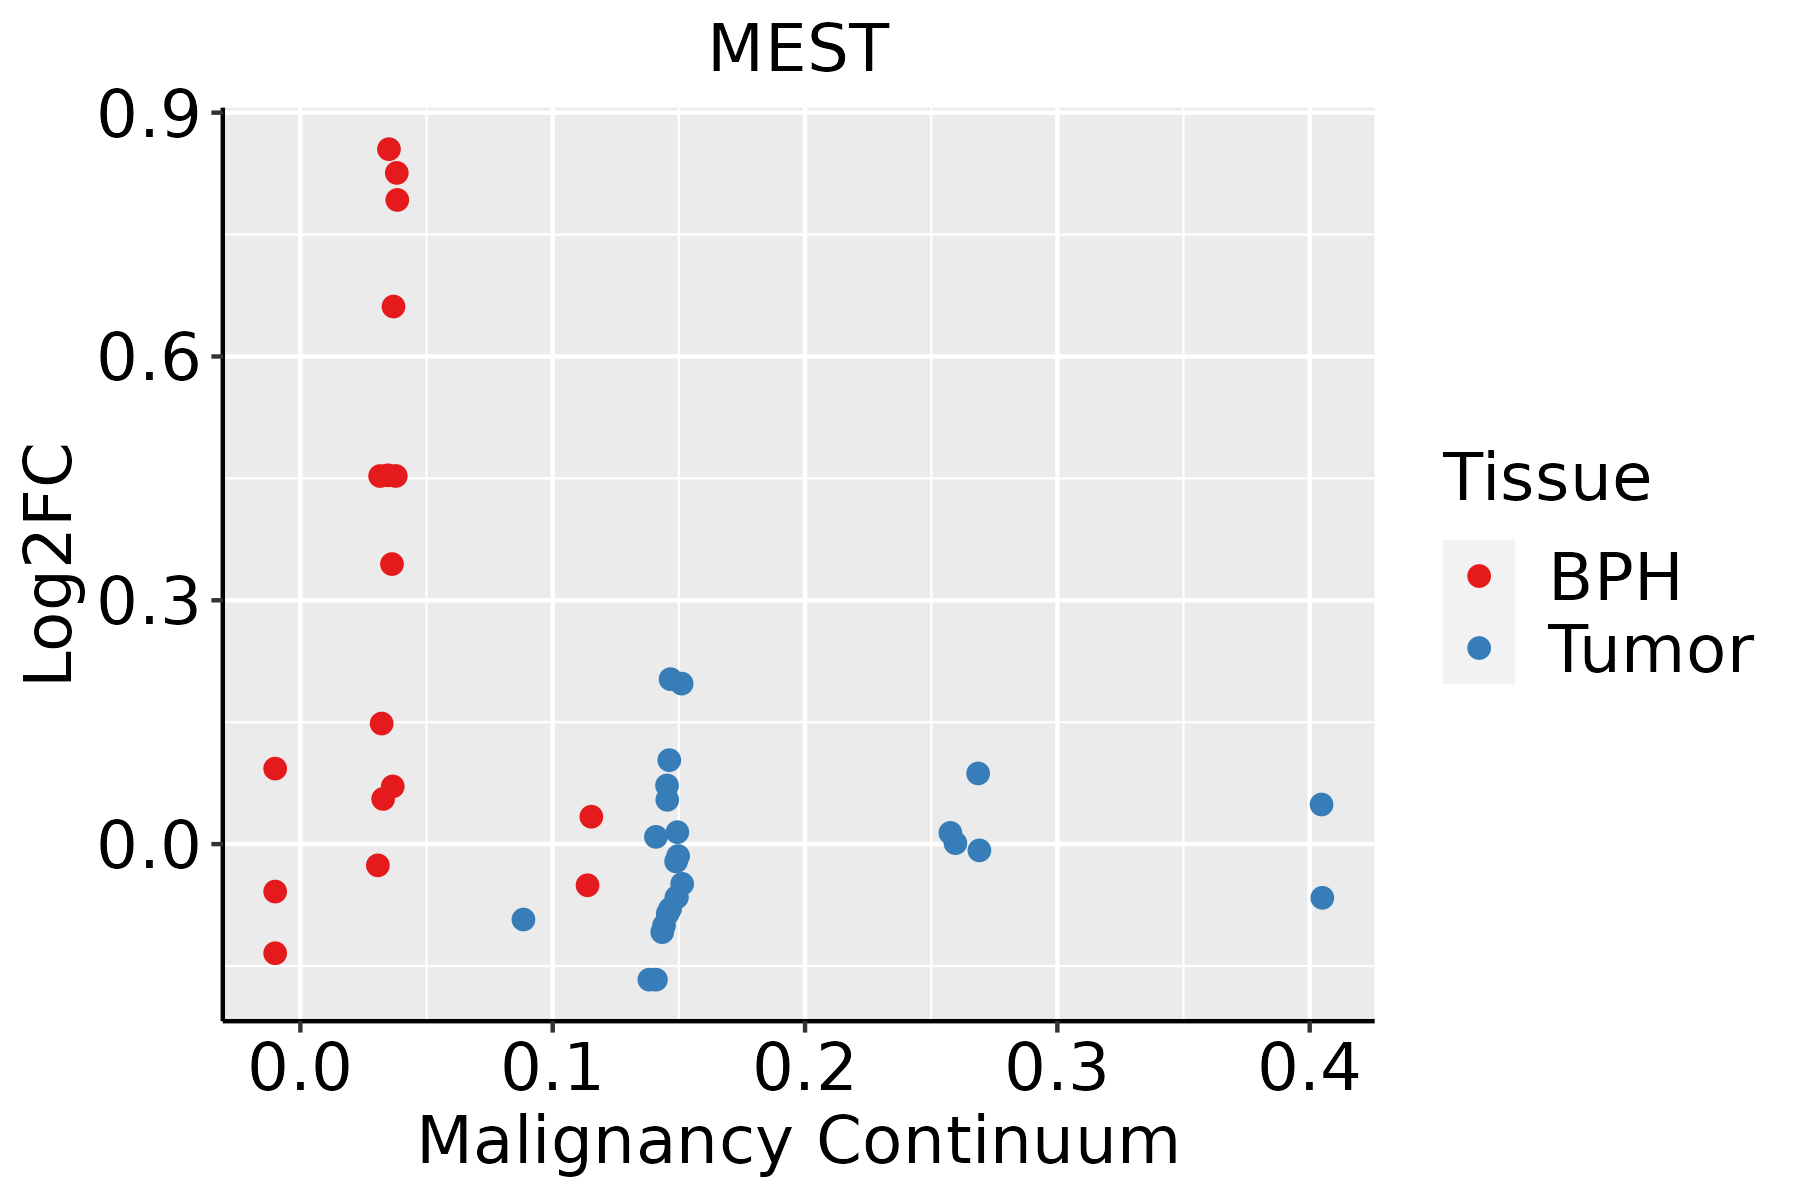 | BPH: Benign Prostatic Hyperplasia |
| Thyroid | 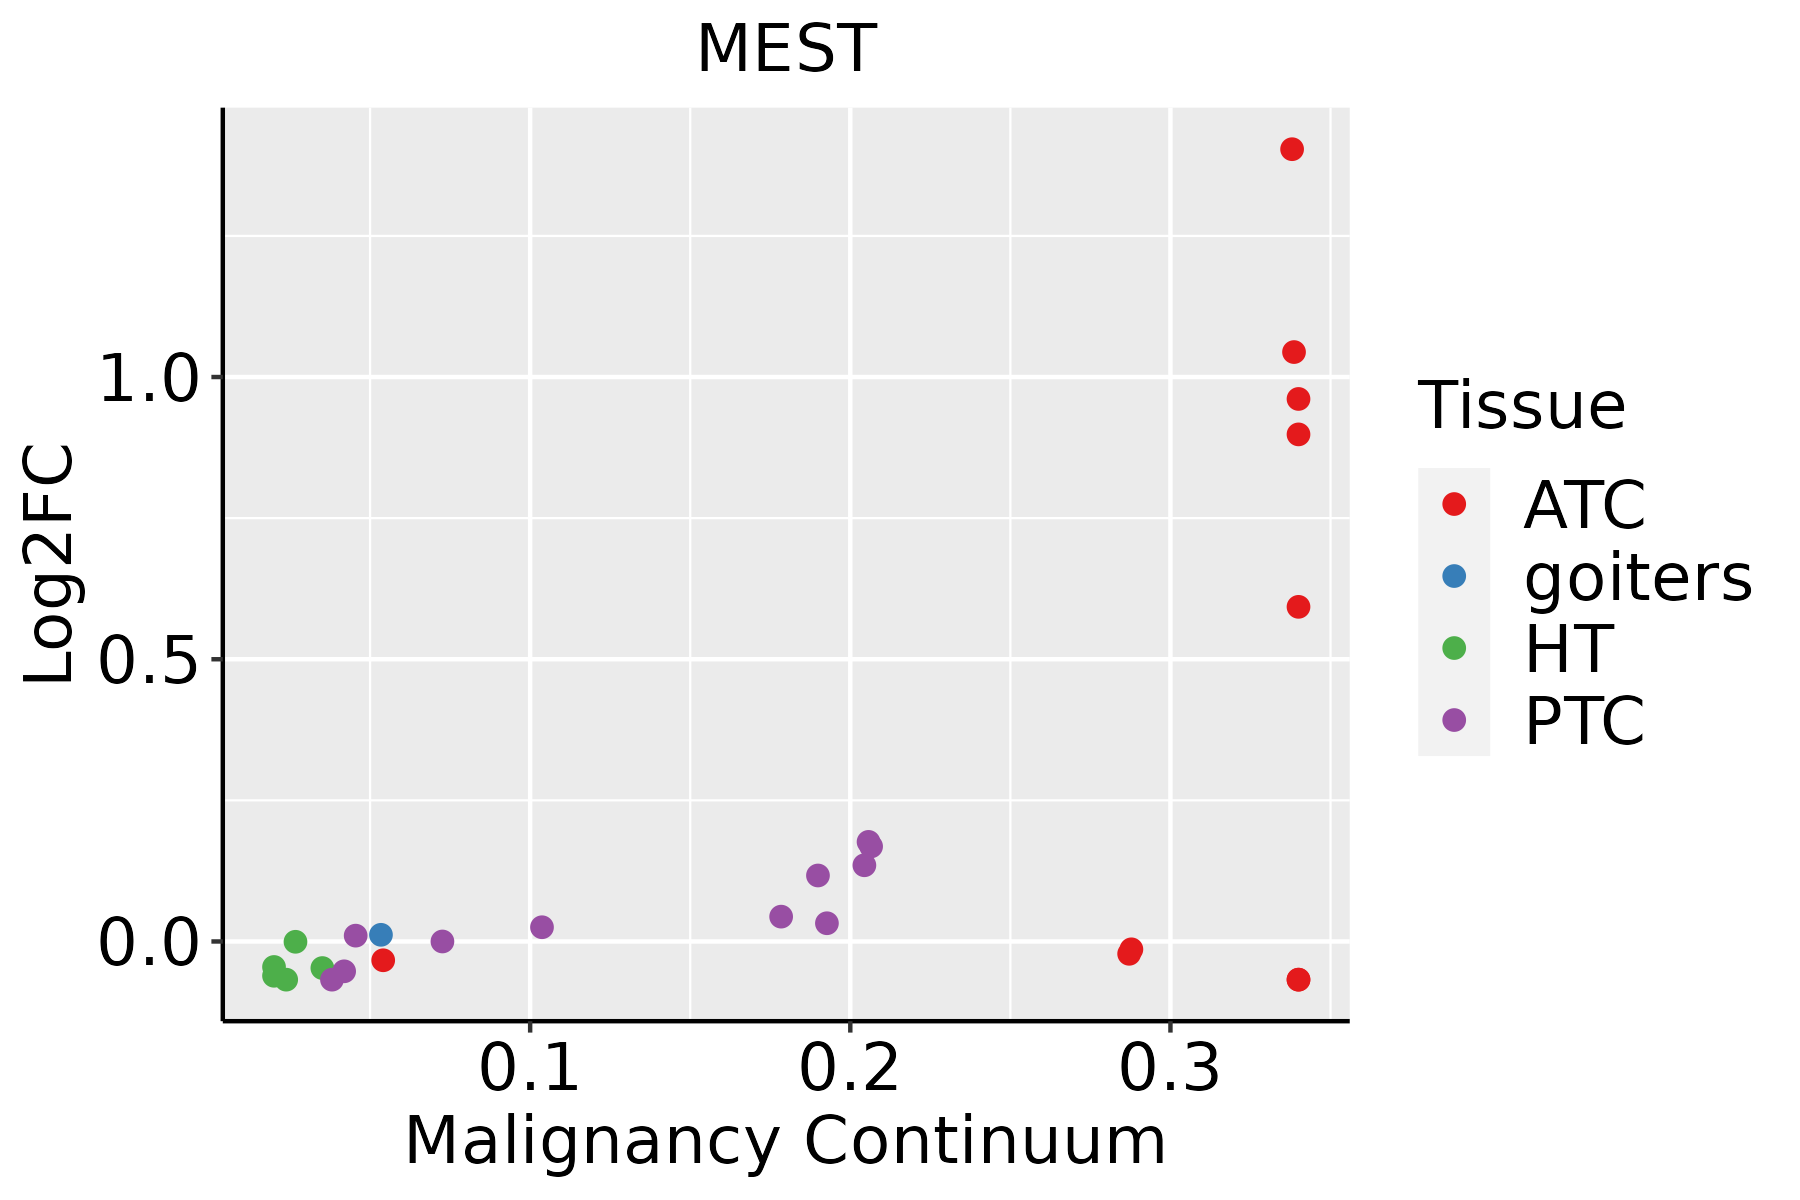 | ATC: Anaplastic thyroid cancer |
| HT: Hashimoto's thyroiditis | ||
| PTC: Papillary thyroid cancer |
| ∗log2FC in expression of this searched gene in stem-like cells from each diseased tissue sample relative to stem-like cells in normal samples in each tissue plotted against the malignancy continuum. Samples are colored based on if they are from different disease stage. |
Top |
Malignant transformation related pathway analysis |
| Find out the enriched GO biological processes and KEGG pathways involved in transition from healthy to precancer to cancer |
| Tissue | Disease Stage | Enriched GO biological Processes |
| Colorectum | AD |  |
| Colorectum | SER |  |
| Colorectum | MSS |  |
| Colorectum | MSI-H |  |
| Colorectum | FAP |  |
| ∗Top 15 enriched GO BP terms are showed in the bar plot of each disease state in each tissue. Each row represents a significant GO biological process which is colored according to the -log10(p.adjust). |
| Page: 1 2 3 4 5 6 7 8 9 |
| GO ID | Tissue | Disease Stage | Description | Gene Ratio | Bg Ratio | pvalue | p.adjust | Count |
| GO:005123520 | Esophagus | HGIN | maintenance of location | 73/2587 | 327/18723 | 1.73e-05 | 4.71e-04 | 73 |
| GO:0051235110 | Esophagus | ESCC | maintenance of location | 200/8552 | 327/18723 | 1.01e-08 | 2.02e-07 | 200 |
| GO:00199155 | Esophagus | ESCC | lipid storage | 58/8552 | 87/18723 | 6.15e-05 | 4.72e-04 | 58 |
| GO:00108836 | Esophagus | ESCC | regulation of lipid storage | 36/8552 | 57/18723 | 5.87e-03 | 2.17e-02 | 36 |
| GO:005123511 | Liver | Cirrhotic | maintenance of location | 117/4634 | 327/18723 | 4.78e-06 | 7.86e-05 | 117 |
| GO:001087611 | Liver | Cirrhotic | lipid localization | 147/4634 | 448/18723 | 6.24e-05 | 7.12e-04 | 147 |
| GO:00108831 | Liver | Cirrhotic | regulation of lipid storage | 26/4634 | 57/18723 | 4.79e-04 | 3.85e-03 | 26 |
| GO:00199151 | Liver | Cirrhotic | lipid storage | 35/4634 | 87/18723 | 1.03e-03 | 7.20e-03 | 35 |
| GO:005123521 | Liver | HCC | maintenance of location | 185/7958 | 327/18723 | 1.70e-07 | 3.12e-06 | 185 |
| GO:001087621 | Liver | HCC | lipid localization | 228/7958 | 448/18723 | 1.80e-04 | 1.41e-03 | 228 |
| GO:00199152 | Liver | HCC | lipid storage | 53/7958 | 87/18723 | 4.01e-04 | 2.71e-03 | 53 |
| GO:00108832 | Liver | HCC | regulation of lipid storage | 35/7958 | 57/18723 | 3.08e-03 | 1.43e-02 | 35 |
| GO:005123518 | Oral cavity | OSCC | maintenance of location | 182/7305 | 327/18723 | 6.16e-10 | 1.58e-08 | 182 |
| GO:00199154 | Oral cavity | OSCC | lipid storage | 48/7305 | 87/18723 | 1.60e-03 | 7.62e-03 | 48 |
| GO:00108835 | Oral cavity | OSCC | regulation of lipid storage | 32/7305 | 57/18723 | 6.45e-03 | 2.40e-02 | 32 |
| GO:005123519 | Oral cavity | LP | maintenance of location | 111/4623 | 327/18723 | 9.62e-05 | 1.20e-03 | 111 |
| GO:005123516 | Prostate | BPH | maintenance of location | 80/3107 | 327/18723 | 1.55e-04 | 1.36e-03 | 80 |
| GO:005123517 | Prostate | Tumor | maintenance of location | 78/3246 | 327/18723 | 1.56e-03 | 9.55e-03 | 78 |
| GO:0051235112 | Thyroid | PTC | maintenance of location | 148/5968 | 327/18723 | 2.30e-07 | 4.07e-06 | 148 |
| GO:005123532 | Thyroid | ATC | maintenance of location | 152/6293 | 327/18723 | 7.84e-07 | 1.04e-05 | 152 |
| Page: 1 |
| Pathway ID | Tissue | Disease Stage | Description | Gene Ratio | Bg Ratio | pvalue | p.adjust | qvalue | Count |
| Page: 1 |
Top |
Cell-cell communication analysis |
| Identification of potential cell-cell interactions between two cell types and their ligand-receptor pairs for different disease states |
| Ligand | Receptor | LRpair | Pathway | Tissue | Disease Stage |
| Page: 1 |
Top |
Single-cell gene regulatory network inference analysis |
| Find out the significant the regulons (TFs) and the target genes of each regulon across cell types for different disease states |
| TF | Cell Type | Tissue | Disease Stage | Target Gene | RSS | Regulon Activity |
| ∗The dot plots of a searched regulon are shown for all cell subpopulations in each disease state of each tissue based on the regulon specific score inferred using pySCENIC and by calculating the average expression. |
| Page: 1 |
Top |
Somatic mutation of malignant transformation related genes |
| Annotation of somatic variants for genes involved in malignant transformation |
| Hugo Symbol | Variant Class | Variant Classification | dbSNP RS | HGVSc | HGVSp | HGVSp Short | SWISSPROT | BIOTYPE | SIFT | PolyPhen | Tumor Sample Barcode | Tissue | Histology | Sex | Age | Stage | Therapy Types | Drugs | Outcome |
| MEST | SNV | Missense_Mutation | c.604C>G | p.Pro202Ala | p.P202A | Q5EB52 | protein_coding | tolerated(0.06) | possibly_damaging(0.887) | TCGA-AN-A0XW-01 | Breast | breast invasive carcinoma | Female | <65 | III/IV | Unknown | Unknown | SD | |
| MEST | SNV | Missense_Mutation | novel | c.44T>G | p.Val15Gly | p.V15G | Q5EB52 | protein_coding | deleterious(0) | possibly_damaging(0.446) | TCGA-D8-A1JL-01 | Breast | breast invasive carcinoma | Female | >=65 | I/II | Unknown | Unknown | SD |
| MEST | insertion | Frame_Shift_Ins | novel | c.142_143insAAAAAAT | p.Phe49LysfsTer57 | p.F49Kfs*57 | Q5EB52 | protein_coding | TCGA-A7-A26I-01 | Breast | breast invasive carcinoma | Female | >=65 | I/II | Chemotherapy | cytoxan | SD | ||
| MEST | insertion | Frame_Shift_Ins | novel | c.537_538insAA | p.Ile180LysfsTer29 | p.I180Kfs*29 | Q5EB52 | protein_coding | TCGA-AR-A0TY-01 | Breast | breast invasive carcinoma | Female | <65 | I/II | Unspecific | Paclitaxel | PD | ||
| MEST | insertion | Frame_Shift_Ins | novel | c.539_540insAAAGAAACAAACAGCATTACAAAGGATAGTGA | p.Phe181LysfsTer38 | p.F181Kfs*38 | Q5EB52 | protein_coding | TCGA-AR-A0TY-01 | Breast | breast invasive carcinoma | Female | <65 | I/II | Unspecific | Paclitaxel | PD | ||
| MEST | SNV | Missense_Mutation | c.790N>T | p.Arg264Cys | p.R264C | Q5EB52 | protein_coding | deleterious(0.02) | benign(0.057) | TCGA-C5-A3HE-01 | Cervix | cervical & endocervical cancer | Female | <65 | I/II | Unknown | Unknown | PD | |
| MEST | SNV | Missense_Mutation | c.440A>T | p.Asp147Val | p.D147V | Q5EB52 | protein_coding | deleterious(0) | probably_damaging(0.99) | TCGA-AA-3492-01 | Colorectum | colon adenocarcinoma | Female | >=65 | I/II | Unknown | Unknown | SD | |
| MEST | SNV | Missense_Mutation | rs756420254 | c.904N>T | p.Arg302Trp | p.R302W | Q5EB52 | protein_coding | tolerated(0.05) | benign(0.015) | TCGA-AA-3684-01 | Colorectum | colon adenocarcinoma | Female | >=65 | III/IV | Unknown | Unknown | SD |
| MEST | SNV | Missense_Mutation | novel | c.284G>T | p.Arg95Met | p.R95M | Q5EB52 | protein_coding | deleterious(0) | probably_damaging(0.964) | TCGA-AA-3950-01 | Colorectum | colon adenocarcinoma | Female | >=65 | I/II | Unknown | Unknown | SD |
| MEST | SNV | Missense_Mutation | rs781957359 | c.64N>A | p.Val22Met | p.V22M | Q5EB52 | protein_coding | tolerated(0.19) | benign(0.003) | TCGA-DM-A1HB-01 | Colorectum | colon adenocarcinoma | Male | >=65 | III/IV | Unknown | Unknown | SD |
| Page: 1 2 3 4 |
Top |
Related drugs of malignant transformation related genes |
| Identification of chemicals and drugs interact with genes involved in malignant transfromation |
| (DGIdb 4.0) |
| Entrez ID | Symbol | Category | Interaction Types | Drug Claim Name | Drug Name | PMIDs |
| Page: 1 |

Copyright 2023-Present -The University of Texas Health Science Center at Houston |