
|
|||||
|
 | |
| |
| |
| |
| |
| |
|
Gene: MEPCE |
Gene summary for MEPCE |
| Gene information | Species | Human | Gene symbol | MEPCE | Gene ID | 56257 |
| Gene name | methylphosphate capping enzyme | |
| Gene Alias | BCDIN3 | |
| Cytomap | 7q22.1 | |
| Gene Type | protein-coding | GO ID | GO:0000082 | UniProtAcc | Q7L2J0 |
Top |
Malignant transformation analysis |
| Identification of the aberrant gene expression in precancerous and cancerous lesions by comparing the gene expression of stem-like cells in diseased tissues with normal stem cells |
| Entrez ID | Symbol | Replicates | Species | Organ | Tissue | Adj P-value | Log2FC | Malignancy |
| 56257 | MEPCE | LZE4T | Human | Esophagus | ESCC | 7.05e-03 | -2.72e-02 | 0.0811 |
| 56257 | MEPCE | LZE7T | Human | Esophagus | ESCC | 7.17e-04 | 1.53e-01 | 0.0667 |
| 56257 | MEPCE | LZE20T | Human | Esophagus | ESCC | 5.33e-09 | 1.23e-01 | 0.0662 |
| 56257 | MEPCE | LZE24T | Human | Esophagus | ESCC | 7.77e-10 | 3.14e-01 | 0.0596 |
| 56257 | MEPCE | P1T-E | Human | Esophagus | ESCC | 4.12e-12 | 6.41e-01 | 0.0875 |
| 56257 | MEPCE | P2T-E | Human | Esophagus | ESCC | 2.21e-31 | 4.89e-01 | 0.1177 |
| 56257 | MEPCE | P4T-E | Human | Esophagus | ESCC | 5.17e-12 | 5.50e-02 | 0.1323 |
| 56257 | MEPCE | P5T-E | Human | Esophagus | ESCC | 4.89e-10 | -4.11e-02 | 0.1327 |
| 56257 | MEPCE | P8T-E | Human | Esophagus | ESCC | 1.14e-15 | 7.37e-02 | 0.0889 |
| 56257 | MEPCE | P9T-E | Human | Esophagus | ESCC | 3.06e-14 | 1.72e-01 | 0.1131 |
| 56257 | MEPCE | P10T-E | Human | Esophagus | ESCC | 6.18e-16 | 1.94e-01 | 0.116 |
| 56257 | MEPCE | P11T-E | Human | Esophagus | ESCC | 1.25e-05 | 3.18e-01 | 0.1426 |
| 56257 | MEPCE | P12T-E | Human | Esophagus | ESCC | 1.55e-16 | 2.02e-01 | 0.1122 |
| 56257 | MEPCE | P15T-E | Human | Esophagus | ESCC | 2.27e-16 | 2.08e-01 | 0.1149 |
| 56257 | MEPCE | P16T-E | Human | Esophagus | ESCC | 2.97e-14 | 1.64e-01 | 0.1153 |
| 56257 | MEPCE | P17T-E | Human | Esophagus | ESCC | 1.20e-06 | 3.21e-01 | 0.1278 |
| 56257 | MEPCE | P20T-E | Human | Esophagus | ESCC | 2.60e-12 | 1.82e-01 | 0.1124 |
| 56257 | MEPCE | P21T-E | Human | Esophagus | ESCC | 2.22e-17 | 7.79e-02 | 0.1617 |
| 56257 | MEPCE | P22T-E | Human | Esophagus | ESCC | 5.63e-12 | -3.29e-02 | 0.1236 |
| 56257 | MEPCE | P23T-E | Human | Esophagus | ESCC | 4.02e-13 | 4.01e-01 | 0.108 |
| Page: 1 2 3 4 5 |
| Tissue | Expression Dynamics | Abbreviation |
| Esophagus | 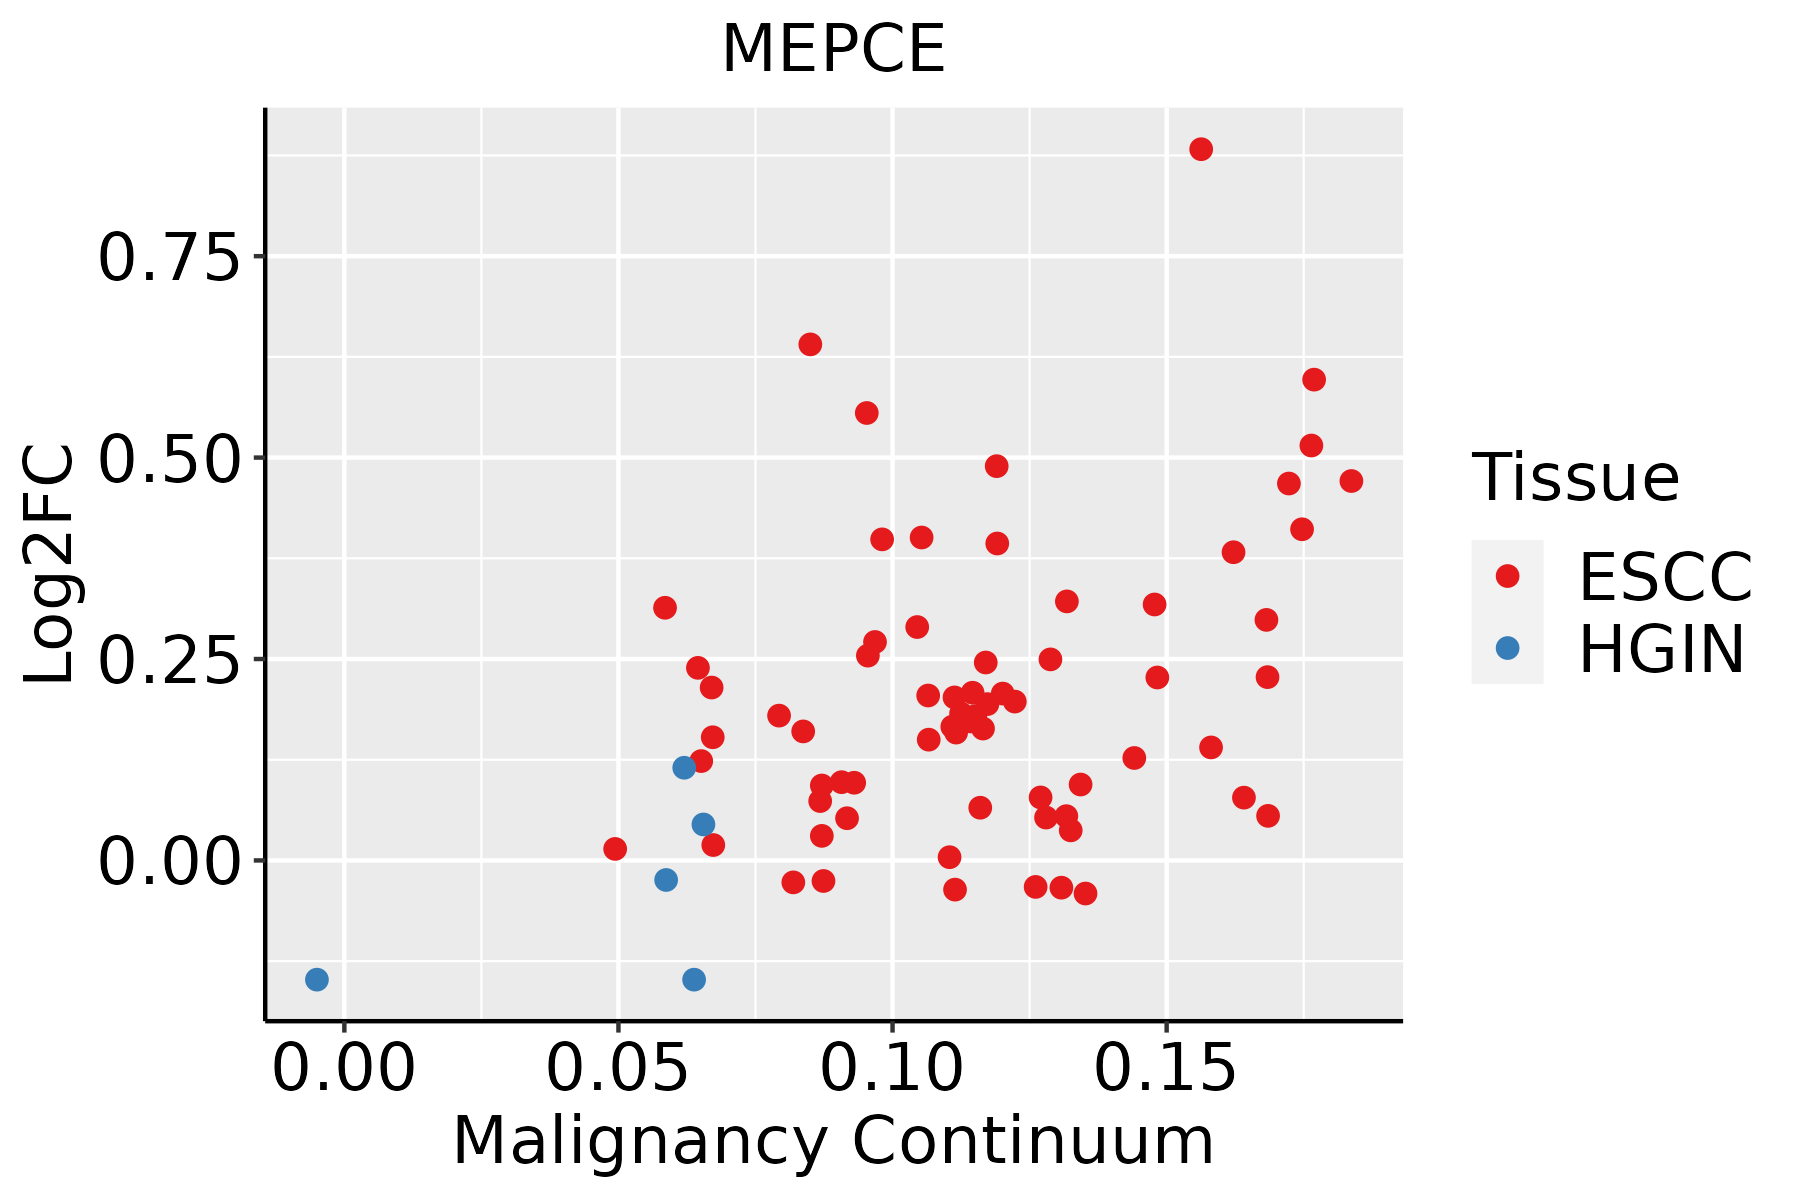 | ESCC: Esophageal squamous cell carcinoma |
| HGIN: High-grade intraepithelial neoplasias | ||
| LGIN: Low-grade intraepithelial neoplasias | ||
| Liver |  | HCC: Hepatocellular carcinoma |
| NAFLD: Non-alcoholic fatty liver disease | ||
| Oral Cavity | 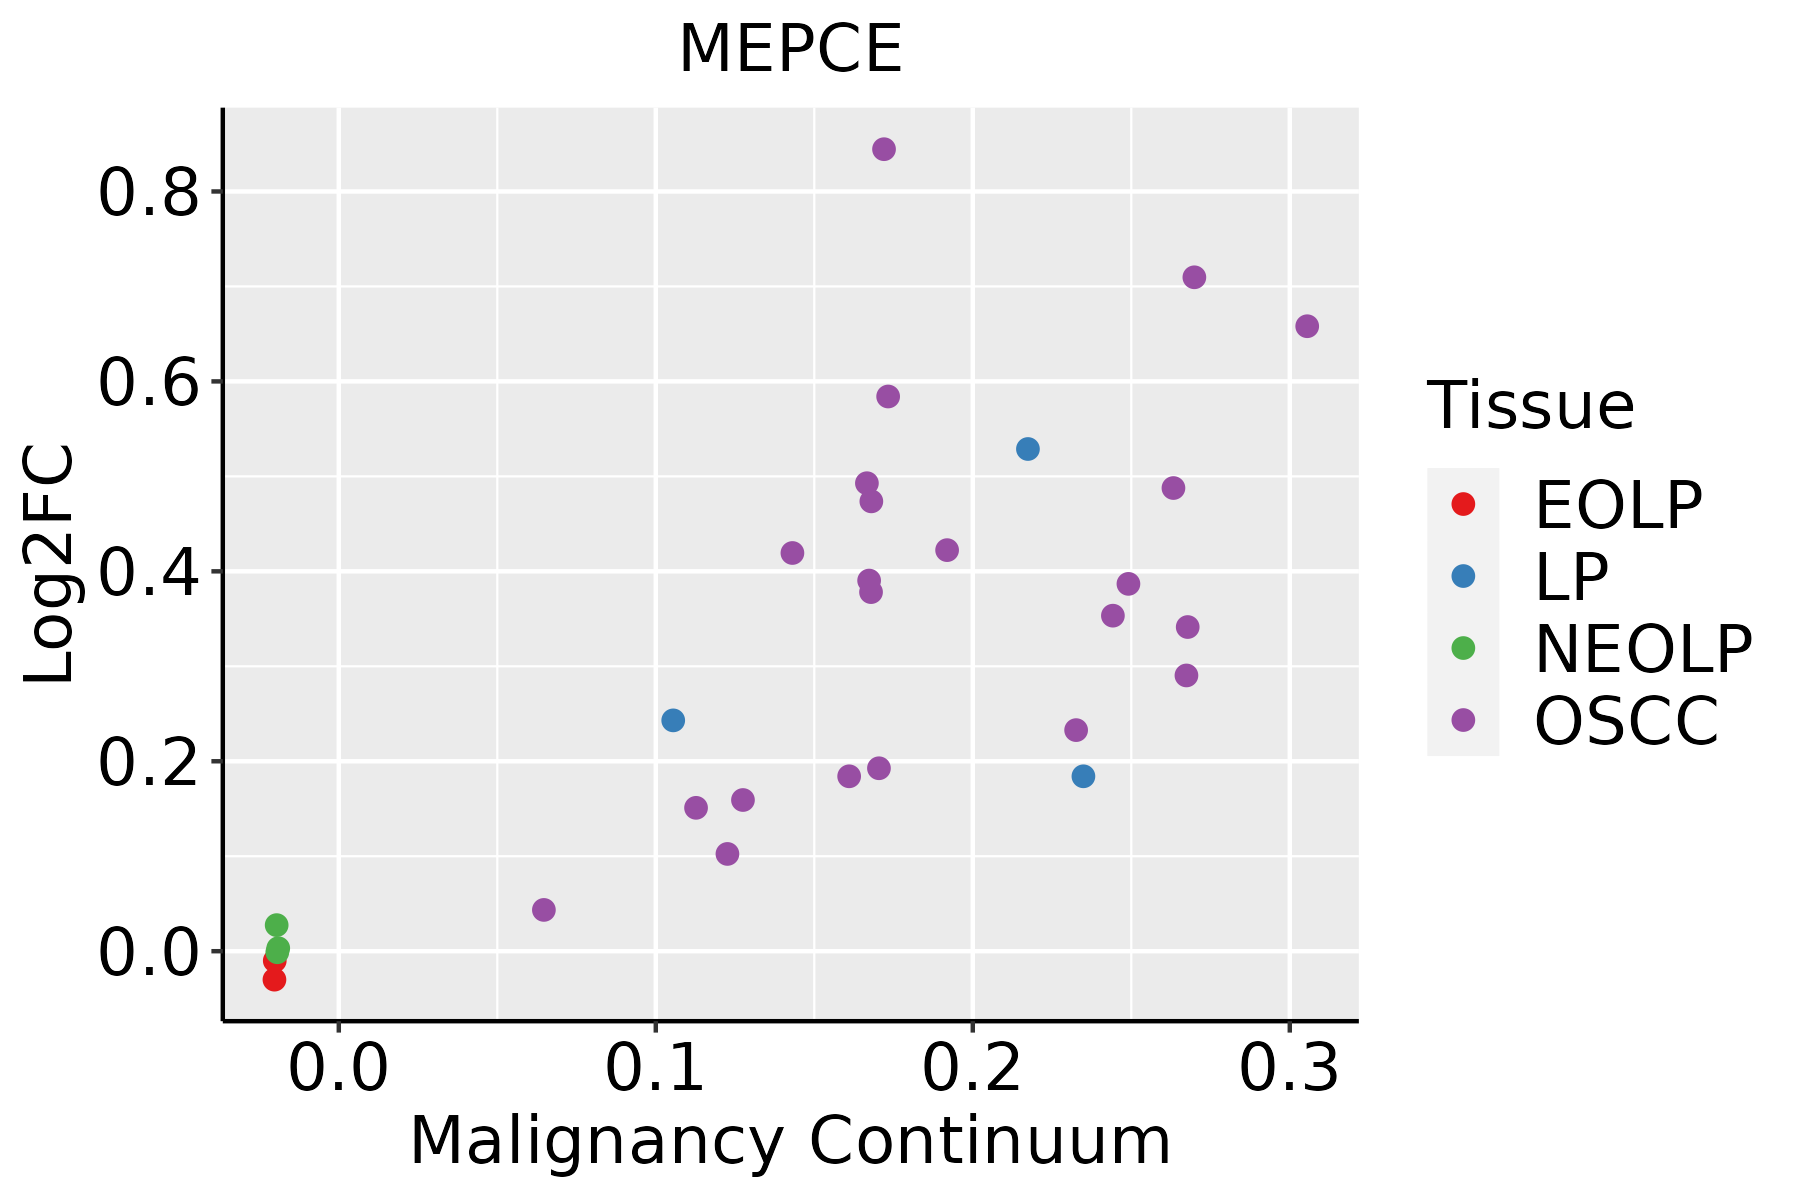 | EOLP: Erosive Oral lichen planus |
| LP: leukoplakia | ||
| NEOLP: Non-erosive oral lichen planus | ||
| OSCC: Oral squamous cell carcinoma |
| ∗log2FC in expression of this searched gene in stem-like cells from each diseased tissue sample relative to stem-like cells in normal samples in each tissue plotted against the malignancy continuum. Samples are colored based on if they are from different disease stage. |
Top |
Malignant transformation related pathway analysis |
| Find out the enriched GO biological processes and KEGG pathways involved in transition from healthy to precancer to cancer |
| Tissue | Disease Stage | Enriched GO biological Processes |
| Colorectum | AD |  |
| Colorectum | SER |  |
| Colorectum | MSS |  |
| Colorectum | MSI-H |  |
| Colorectum | FAP |  |
| ∗Top 15 enriched GO BP terms are showed in the bar plot of each disease state in each tissue. Each row represents a significant GO biological process which is colored according to the -log10(p.adjust). |
| Page: 1 2 3 4 5 6 7 8 9 |
| GO ID | Tissue | Disease Stage | Description | Gene Ratio | Bg Ratio | pvalue | p.adjust | Count |
| GO:003466012 | Esophagus | ESCC | ncRNA metabolic process | 346/8552 | 485/18723 | 4.35e-31 | 2.51e-28 | 346 |
| GO:003450418 | Esophagus | ESCC | protein localization to nucleus | 211/8552 | 290/18723 | 4.06e-21 | 6.60e-19 | 211 |
| GO:0051098111 | Esophagus | ESCC | regulation of binding | 251/8552 | 363/18723 | 6.73e-20 | 8.46e-18 | 251 |
| GO:1903829111 | Esophagus | ESCC | positive regulation of cellular protein localization | 199/8552 | 276/18723 | 2.99e-19 | 3.45e-17 | 199 |
| GO:004477216 | Esophagus | ESCC | mitotic cell cycle phase transition | 281/8552 | 424/18723 | 4.63e-18 | 4.45e-16 | 281 |
| GO:000734615 | Esophagus | ESCC | regulation of mitotic cell cycle | 293/8552 | 457/18723 | 8.00e-16 | 5.64e-14 | 293 |
| GO:190018018 | Esophagus | ESCC | regulation of protein localization to nucleus | 102/8552 | 136/18723 | 2.84e-12 | 1.13e-10 | 102 |
| GO:190018217 | Esophagus | ESCC | positive regulation of protein localization to nucleus | 70/8552 | 87/18723 | 2.63e-11 | 8.99e-10 | 70 |
| GO:190198713 | Esophagus | ESCC | regulation of cell cycle phase transition | 242/8552 | 390/18723 | 3.86e-11 | 1.26e-09 | 242 |
| GO:190199013 | Esophagus | ESCC | regulation of mitotic cell cycle phase transition | 191/8552 | 299/18723 | 1.35e-10 | 3.94e-09 | 191 |
| GO:00434143 | Esophagus | ESCC | macromolecule methylation | 199/8552 | 316/18723 | 3.44e-10 | 9.57e-09 | 199 |
| GO:004578710 | Esophagus | ESCC | positive regulation of cell cycle | 196/8552 | 313/18723 | 9.27e-10 | 2.24e-08 | 196 |
| GO:00322592 | Esophagus | ESCC | methylation | 222/8552 | 364/18723 | 2.26e-09 | 5.09e-08 | 222 |
| GO:00094512 | Esophagus | ESCC | RNA modification | 114/8552 | 167/18723 | 2.76e-09 | 6.04e-08 | 114 |
| GO:0051100111 | Esophagus | ESCC | negative regulation of binding | 109/8552 | 162/18723 | 2.10e-08 | 4.03e-07 | 109 |
| GO:00987812 | Esophagus | ESCC | ncRNA transcription | 45/8552 | 56/18723 | 1.05e-07 | 1.72e-06 | 45 |
| GO:004593116 | Esophagus | ESCC | positive regulation of mitotic cell cycle | 83/8552 | 121/18723 | 2.78e-07 | 4.08e-06 | 83 |
| GO:000008214 | Esophagus | ESCC | G1/S transition of mitotic cell cycle | 134/8552 | 214/18723 | 4.04e-07 | 5.55e-06 | 134 |
| GO:004484314 | Esophagus | ESCC | cell cycle G1/S phase transition | 148/8552 | 241/18723 | 5.68e-07 | 7.48e-06 | 148 |
| GO:19019896 | Esophagus | ESCC | positive regulation of cell cycle phase transition | 77/8552 | 115/18723 | 3.20e-06 | 3.58e-05 | 77 |
| Page: 1 2 3 4 5 6 7 |
| Pathway ID | Tissue | Disease Stage | Description | Gene Ratio | Bg Ratio | pvalue | p.adjust | qvalue | Count |
| Page: 1 |
Top |
Cell-cell communication analysis |
| Identification of potential cell-cell interactions between two cell types and their ligand-receptor pairs for different disease states |
| Ligand | Receptor | LRpair | Pathway | Tissue | Disease Stage |
| Page: 1 |
Top |
Single-cell gene regulatory network inference analysis |
| Find out the significant the regulons (TFs) and the target genes of each regulon across cell types for different disease states |
| TF | Cell Type | Tissue | Disease Stage | Target Gene | RSS | Regulon Activity |
| ∗The dot plots of a searched regulon are shown for all cell subpopulations in each disease state of each tissue based on the regulon specific score inferred using pySCENIC and by calculating the average expression. |
| Page: 1 |
Top |
Somatic mutation of malignant transformation related genes |
| Annotation of somatic variants for genes involved in malignant transformation |
| Hugo Symbol | Variant Class | Variant Classification | dbSNP RS | HGVSc | HGVSp | HGVSp Short | SWISSPROT | BIOTYPE | SIFT | PolyPhen | Tumor Sample Barcode | Tissue | Histology | Sex | Age | Stage | Therapy Types | Drugs | Outcome |
| MEPCE | SNV | Missense_Mutation | rs754062405 | c.536N>G | p.Ser179Cys | p.S179C | Q7L2J0 | protein_coding | tolerated(0.11) | benign(0.417) | TCGA-AC-A23H-01 | Breast | breast invasive carcinoma | Female | >=65 | I/II | Unknown | Unknown | PD |
| MEPCE | SNV | Missense_Mutation | c.1313N>C | p.Lys438Thr | p.K438T | Q7L2J0 | protein_coding | deleterious(0.03) | benign(0.11) | TCGA-AO-A128-01 | Breast | breast invasive carcinoma | Female | <65 | I/II | Chemotherapy | doxorubicin | SD | |
| MEPCE | SNV | Missense_Mutation | c.1933N>C | p.Glu645Gln | p.E645Q | Q7L2J0 | protein_coding | tolerated(0.1) | possibly_damaging(0.659) | TCGA-D8-A1JN-01 | Breast | breast invasive carcinoma | Female | >=65 | III/IV | Hormone Therapy | anastrozolum | SD | |
| MEPCE | SNV | Missense_Mutation | novel | c.1087N>T | p.Arg363Cys | p.R363C | Q7L2J0 | protein_coding | deleterious(0) | probably_damaging(0.985) | TCGA-GM-A3XL-01 | Breast | breast invasive carcinoma | Female | <65 | I/II | Chemotherapy | fluorouracil | CR |
| MEPCE | SNV | Missense_Mutation | novel | c.1525G>A | p.Glu509Lys | p.E509K | Q7L2J0 | protein_coding | tolerated(0.09) | benign(0.003) | TCGA-PE-A5DE-01 | Breast | breast invasive carcinoma | Female | <65 | I/II | Chemotherapy | taxotere | CR |
| MEPCE | insertion | Frame_Shift_Ins | novel | c.1909_1910insGTTTCGGGGCCGGG | p.Tyr637CysfsTer11 | p.Y637Cfs*11 | Q7L2J0 | protein_coding | TCGA-B6-A0IA-01 | Breast | breast invasive carcinoma | Female | <65 | I/II | Unknown | Unknown | SD | ||
| MEPCE | insertion | Frame_Shift_Ins | novel | c.1911_1912insGTCC | p.Tyr638ValfsTer26 | p.Y638Vfs*26 | Q7L2J0 | protein_coding | TCGA-B6-A0IA-01 | Breast | breast invasive carcinoma | Female | <65 | I/II | Unknown | Unknown | SD | ||
| MEPCE | deletion | Frame_Shift_Del | novel | c.2037delN | p.Leu680CysfsTer19 | p.L680Cfs*19 | Q7L2J0 | protein_coding | TCGA-D8-A27V-01 | Breast | breast invasive carcinoma | Female | <65 | I/II | Hormone Therapy | tamoxiphen | SD | ||
| MEPCE | SNV | Missense_Mutation | novel | c.1088G>A | p.Arg363His | p.R363H | Q7L2J0 | protein_coding | deleterious(0.05) | probably_damaging(0.98) | TCGA-2W-A8YY-01 | Cervix | cervical & endocervical cancer | Female | <65 | I/II | Chemotherapy | cisplatin | CR |
| MEPCE | SNV | Missense_Mutation | novel | c.1058C>G | p.Ser353Cys | p.S353C | Q7L2J0 | protein_coding | deleterious(0.01) | benign(0.156) | TCGA-DG-A2KK-01 | Cervix | cervical & endocervical cancer | Female | <65 | III/IV | Chemotherapy | cisplatin | SD |
| Page: 1 2 3 4 5 6 7 |
Top |
Related drugs of malignant transformation related genes |
| Identification of chemicals and drugs interact with genes involved in malignant transfromation |
| (DGIdb 4.0) |
| Entrez ID | Symbol | Category | Interaction Types | Drug Claim Name | Drug Name | PMIDs |
| Page: 1 |

Copyright 2023-Present -The University of Texas Health Science Center at Houston |