
|
|||||
|
 | |
| |
| |
| |
| |
| |
|
Gene: MEP1A |
Gene summary for MEP1A |
| Gene information | Species | Human | Gene symbol | MEP1A | Gene ID | 4224 |
| Gene name | meprin A subunit alpha | |
| Gene Alias | PPHA | |
| Cytomap | 6p12.3 | |
| Gene Type | protein-coding | GO ID | GO:0006508 | UniProtAcc | Q16819 |
Top |
Malignant transformation analysis |
| Identification of the aberrant gene expression in precancerous and cancerous lesions by comparing the gene expression of stem-like cells in diseased tissues with normal stem cells |
| Entrez ID | Symbol | Replicates | Species | Organ | Tissue | Adj P-value | Log2FC | Malignancy |
| 4224 | MEP1A | HTA11_2487_2000001011 | Human | Colorectum | SER | 1.33e-12 | 8.21e-01 | -0.1808 |
| 4224 | MEP1A | HTA11_78_2000001011 | Human | Colorectum | AD | 4.57e-10 | 6.56e-01 | -0.1088 |
| 4224 | MEP1A | HTA11_347_2000001011 | Human | Colorectum | AD | 2.29e-26 | 9.11e-01 | -0.1954 |
| 4224 | MEP1A | HTA11_411_2000001011 | Human | Colorectum | SER | 1.24e-08 | 1.17e+00 | -0.2602 |
| 4224 | MEP1A | HTA11_2112_2000001011 | Human | Colorectum | SER | 1.25e-07 | 1.13e+00 | -0.2196 |
| 4224 | MEP1A | HTA11_83_2000001011 | Human | Colorectum | SER | 6.12e-05 | 4.11e-01 | -0.1526 |
| 4224 | MEP1A | HTA11_696_2000001011 | Human | Colorectum | AD | 2.00e-05 | 3.75e-01 | -0.1464 |
| 4224 | MEP1A | HTA11_5212_2000001011 | Human | Colorectum | AD | 9.42e-11 | 1.13e+00 | -0.2061 |
| 4224 | MEP1A | HTA11_99999971662_82457 | Human | Colorectum | MSS | 6.42e-13 | 5.72e-01 | 0.3859 |
| 4224 | MEP1A | A002-C-010 | Human | Colorectum | FAP | 3.14e-02 | -1.38e-01 | 0.242 |
| 4224 | MEP1A | A002-C-116 | Human | Colorectum | FAP | 3.85e-03 | -1.53e-01 | -0.0452 |
| 4224 | MEP1A | HCC1_Meng | Human | Liver | HCC | 3.72e-19 | 9.86e-02 | 0.0246 |
| 4224 | MEP1A | S014 | Human | Liver | HCC | 1.00e-14 | 7.56e-01 | 0.2254 |
| 4224 | MEP1A | S015 | Human | Liver | HCC | 2.75e-17 | 1.30e+00 | 0.2375 |
| 4224 | MEP1A | S016 | Human | Liver | HCC | 9.35e-20 | 1.30e+00 | 0.2243 |
| 4224 | MEP1A | Pat01-B | Human | Stomach | GC | 2.25e-43 | 7.71e-01 | 0.5754 |
| 4224 | MEP1A | Pat02-B | Human | Stomach | GC | 8.40e-04 | 1.14e-01 | 0.0368 |
| 4224 | MEP1A | Pat03-B | Human | Stomach | GC | 9.48e-26 | 5.41e-01 | 0.3693 |
| 4224 | MEP1A | Pat17-B | Human | Stomach | GC | 9.13e-06 | 2.49e-01 | 0.3109 |
| 4224 | MEP1A | Pat19-B | Human | Stomach | GC | 3.48e-04 | 1.69e-01 | 0.0826 |
| Page: 1 |
| Tissue | Expression Dynamics | Abbreviation |
| Colorectum (GSE201348) |  | FAP: Familial adenomatous polyposis |
| CRC: Colorectal cancer | ||
| Colorectum (HTA11) | 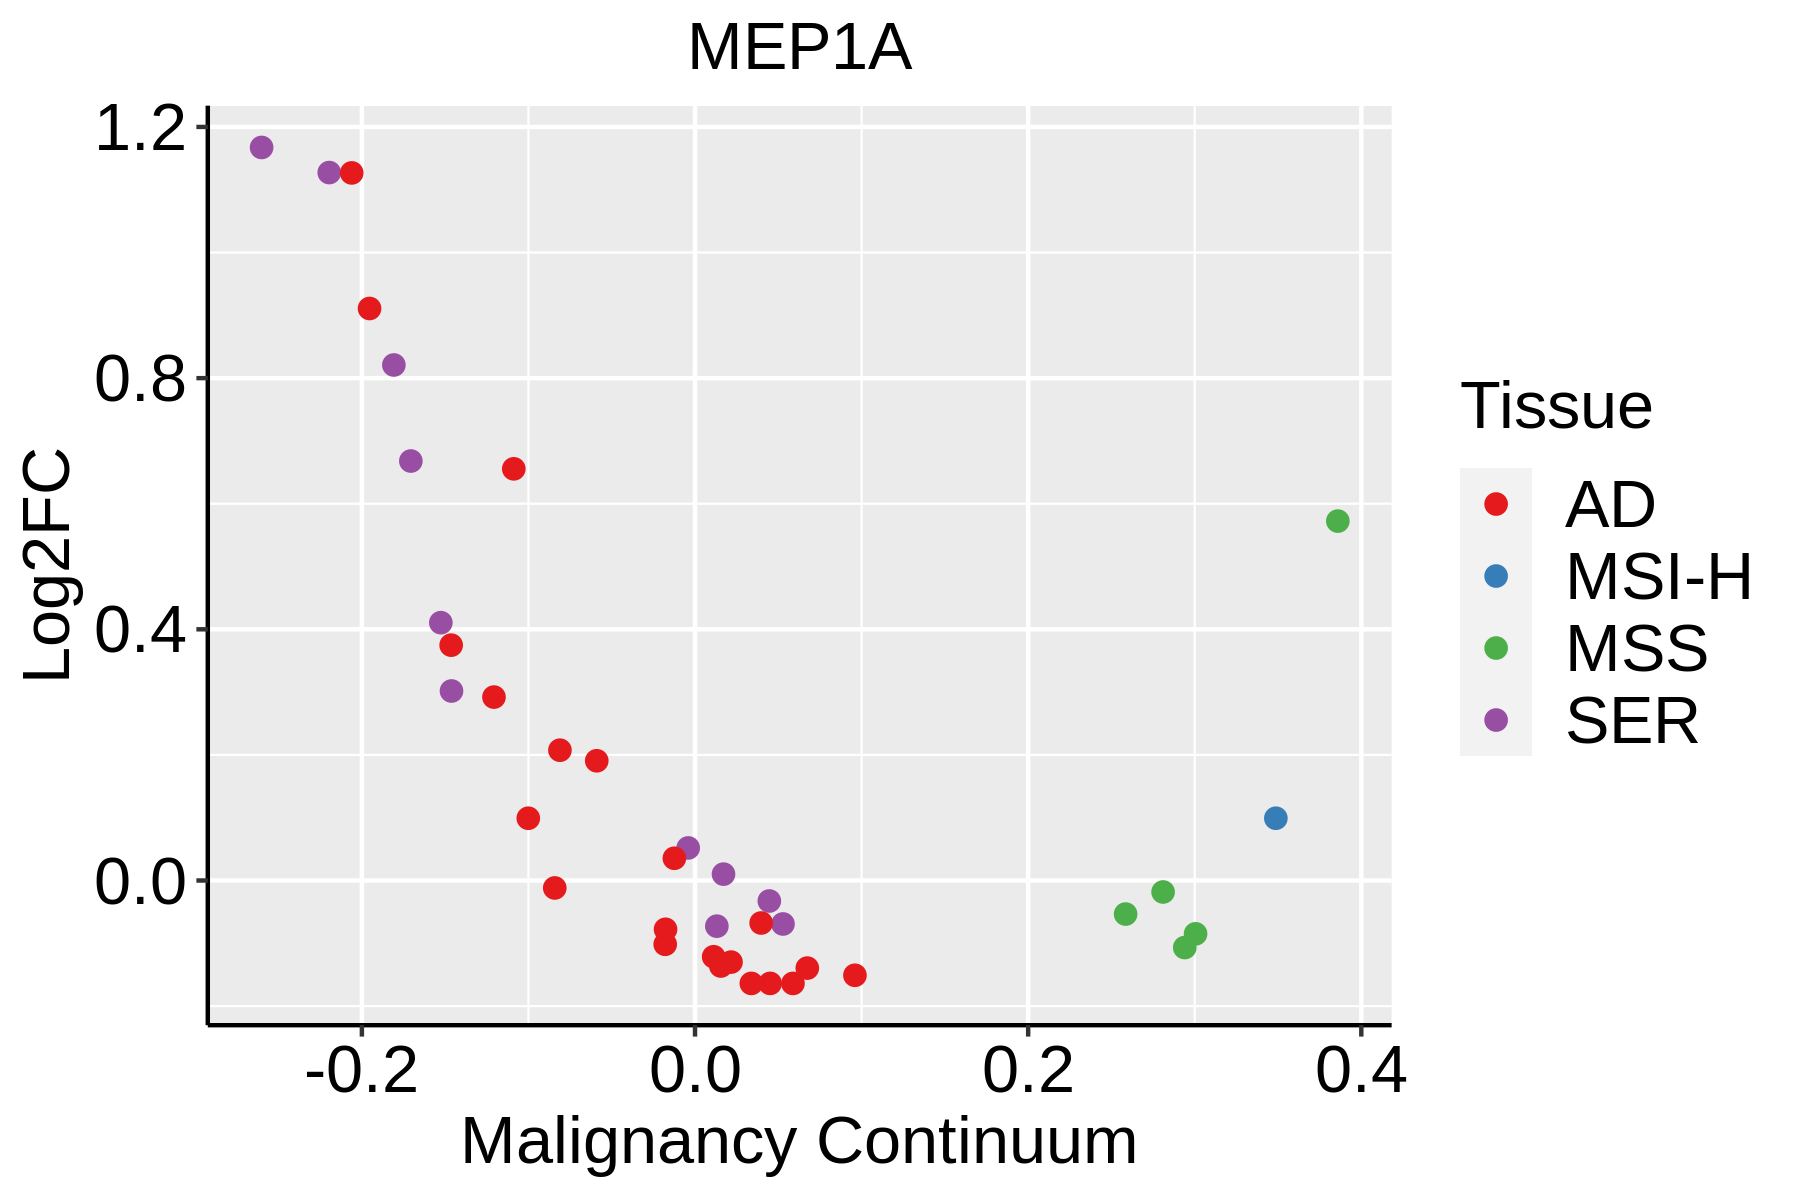 | AD: Adenomas |
| SER: Sessile serrated lesions | ||
| MSI-H: Microsatellite-high colorectal cancer | ||
| MSS: Microsatellite stable colorectal cancer | ||
| GC | 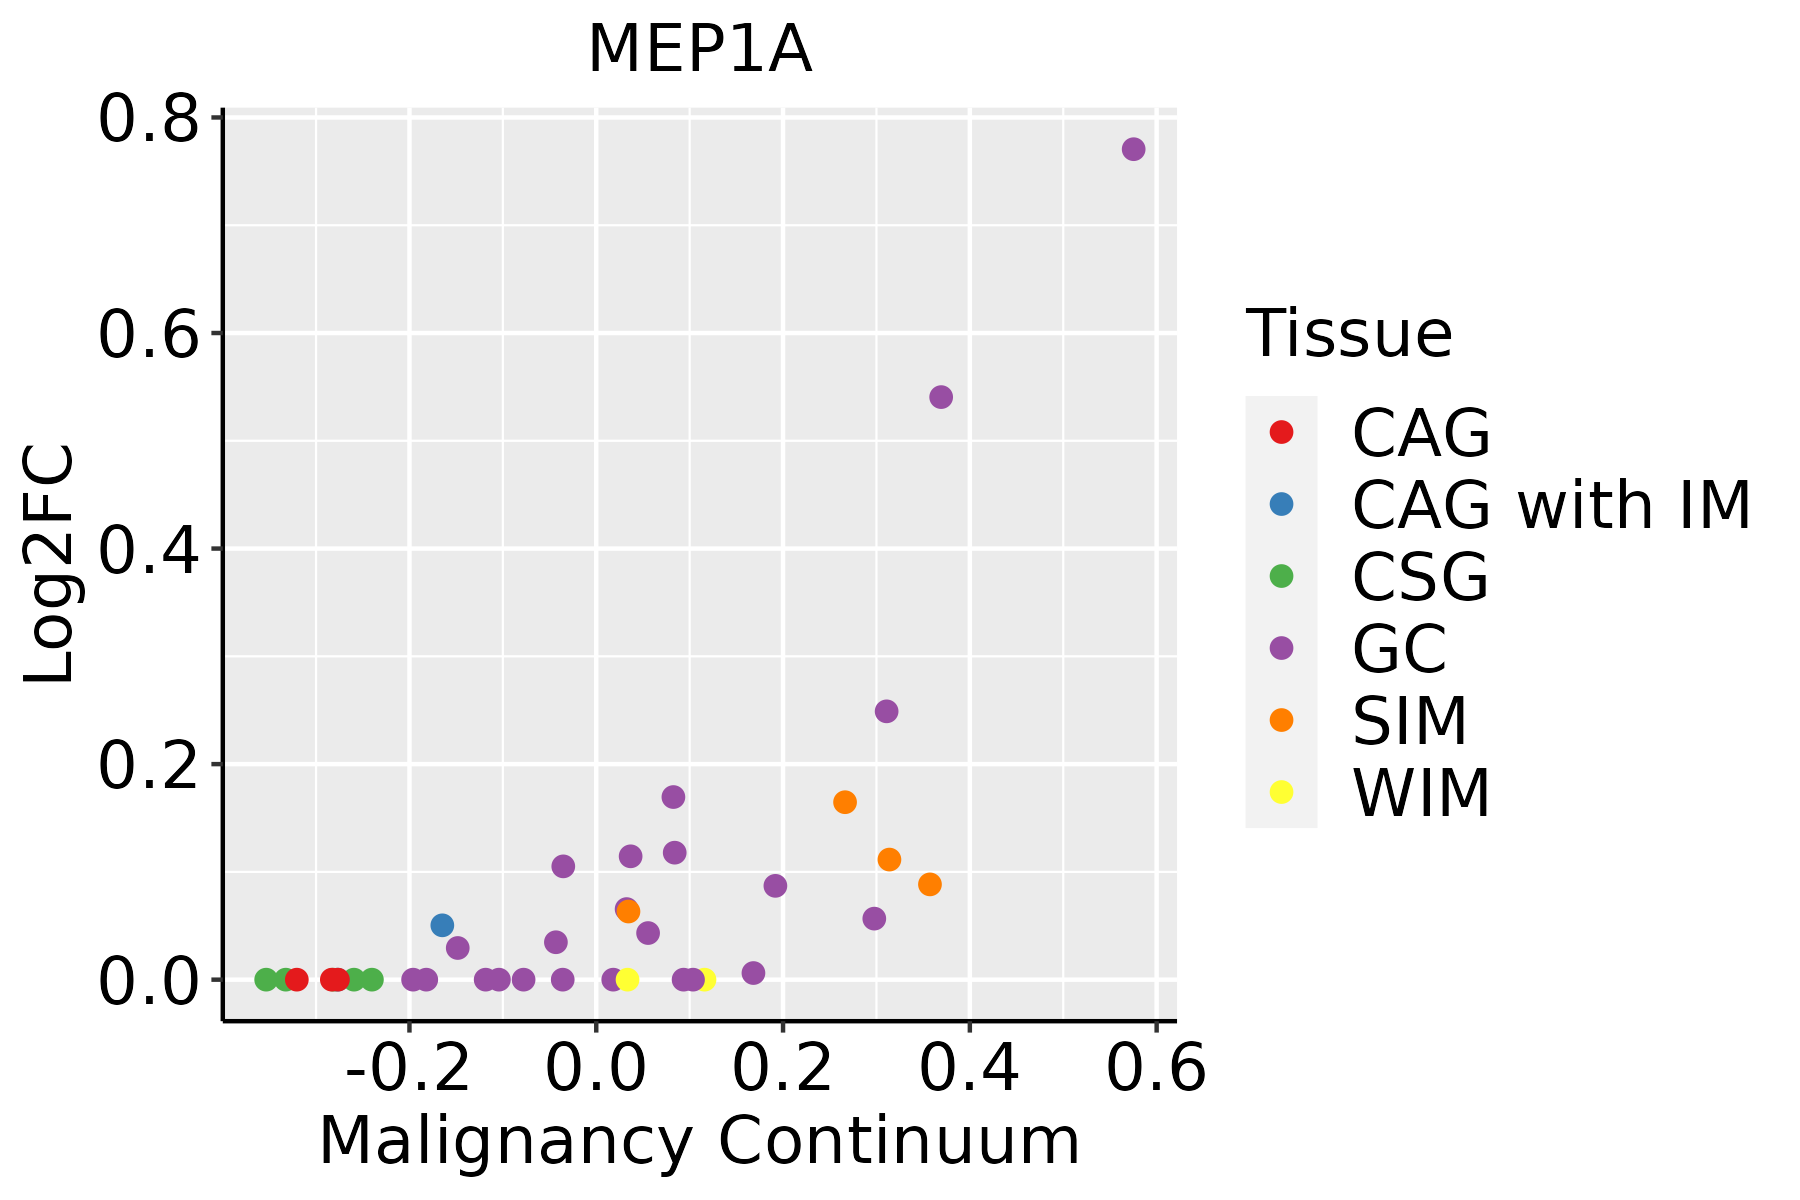 | CAG: Chronic atrophic gastritis |
| CAG with IM: Chronic atrophic gastritis with intestinal metaplasia | ||
| CSG: Chronic superficial gastritis | ||
| GC: Gastric cancer | ||
| SIM: Severe intestinal metaplasia | ||
| WIM: Wild intestinal metaplasia | ||
| Liver |  | HCC: Hepatocellular carcinoma |
| NAFLD: Non-alcoholic fatty liver disease |
| ∗log2FC in expression of this searched gene in stem-like cells from each diseased tissue sample relative to stem-like cells in normal samples in each tissue plotted against the malignancy continuum. Samples are colored based on if they are from different disease stage. |
Top |
Malignant transformation related pathway analysis |
| Find out the enriched GO biological processes and KEGG pathways involved in transition from healthy to precancer to cancer |
| Tissue | Disease Stage | Enriched GO biological Processes |
| Colorectum | AD |  |
| Colorectum | SER |  |
| Colorectum | MSS |  |
| Colorectum | MSI-H |  |
| Colorectum | FAP |  |
| ∗Top 15 enriched GO BP terms are showed in the bar plot of each disease state in each tissue. Each row represents a significant GO biological process which is colored according to the -log10(p.adjust). |
| Page: 1 2 3 4 5 6 7 8 9 |
| GO ID | Tissue | Disease Stage | Description | Gene Ratio | Bg Ratio | pvalue | p.adjust | Count |
| Page: 1 |
| Pathway ID | Tissue | Disease Stage | Description | Gene Ratio | Bg Ratio | pvalue | p.adjust | qvalue | Count |
| Page: 1 |
Top |
Cell-cell communication analysis |
| Identification of potential cell-cell interactions between two cell types and their ligand-receptor pairs for different disease states |
| Ligand | Receptor | LRpair | Pathway | Tissue | Disease Stage |
| Page: 1 |
Top |
Single-cell gene regulatory network inference analysis |
| Find out the significant the regulons (TFs) and the target genes of each regulon across cell types for different disease states |
| TF | Cell Type | Tissue | Disease Stage | Target Gene | RSS | Regulon Activity |
| ∗The dot plots of a searched regulon are shown for all cell subpopulations in each disease state of each tissue based on the regulon specific score inferred using pySCENIC and by calculating the average expression. |
| Page: 1 |
Top |
Somatic mutation of malignant transformation related genes |
| Annotation of somatic variants for genes involved in malignant transformation |
| Hugo Symbol | Variant Class | Variant Classification | dbSNP RS | HGVSc | HGVSp | HGVSp Short | SWISSPROT | BIOTYPE | SIFT | PolyPhen | Tumor Sample Barcode | Tissue | Histology | Sex | Age | Stage | Therapy Types | Drugs | Outcome |
| MEP1A | SNV | Missense_Mutation | c.131N>T | p.Ser44Leu | p.S44L | Q16819 | protein_coding | tolerated(0.12) | benign(0) | TCGA-A8-A09G-01 | Breast | breast invasive carcinoma | Female | >=65 | III/IV | Unknown | Unknown | SD | |
| MEP1A | SNV | Missense_Mutation | c.1394N>G | p.Tyr465Cys | p.Y465C | Q16819 | protein_coding | deleterious(0) | probably_damaging(0.999) | TCGA-A8-A09Z-01 | Breast | breast invasive carcinoma | Female | >=65 | I/II | Unknown | Unknown | SD | |
| MEP1A | SNV | Missense_Mutation | novel | c.1323C>A | p.Phe441Leu | p.F441L | Q16819 | protein_coding | deleterious(0) | possibly_damaging(0.566) | TCGA-AN-A046-01 | Breast | breast invasive carcinoma | Female | >=65 | I/II | Unknown | Unknown | SD |
| MEP1A | SNV | Missense_Mutation | novel | c.962C>T | p.Ser321Leu | p.S321L | Q16819 | protein_coding | tolerated(0.07) | benign(0.015) | TCGA-AR-A5QN-01 | Breast | breast invasive carcinoma | Female | >=65 | III/IV | Chemotherapy | taxotere | SD |
| MEP1A | SNV | Missense_Mutation | c.2196G>C | p.Leu732Phe | p.L732F | Q16819 | protein_coding | deleterious(0.01) | probably_damaging(0.927) | TCGA-BH-A0DZ-01 | Breast | breast invasive carcinoma | Female | <65 | I/II | Chemotherapy | docetaxel | SD | |
| MEP1A | SNV | Missense_Mutation | c.1369C>T | p.Pro457Ser | p.P457S | Q16819 | protein_coding | deleterious(0) | possibly_damaging(0.801) | TCGA-BH-A18H-01 | Breast | breast invasive carcinoma | Female | <65 | I/II | Chemotherapy | adriamycin | CR | |
| MEP1A | SNV | Missense_Mutation | c.495C>A | p.His165Gln | p.H165Q | Q16819 | protein_coding | deleterious(0) | probably_damaging(1) | TCGA-D8-A142-01 | Breast | breast invasive carcinoma | Female | >=65 | I/II | Chemotherapy | cyclophosphamid | SD | |
| MEP1A | SNV | Missense_Mutation | c.88N>C | p.Glu30Gln | p.E30Q | Q16819 | protein_coding | tolerated(0.47) | benign(0.001) | TCGA-D8-A1J8-01 | Breast | breast invasive carcinoma | Female | >=65 | I/II | Hormone Therapy | nolvadex | SD | |
| MEP1A | SNV | Missense_Mutation | c.730N>T | p.Asp244Tyr | p.D244Y | Q16819 | protein_coding | deleterious(0) | probably_damaging(1) | TCGA-E9-A1RF-01 | Breast | breast invasive carcinoma | Female | >=65 | III/IV | Hormone Therapy | tamoxiphen | SD | |
| MEP1A | SNV | Missense_Mutation | c.731N>G | p.Asp244Gly | p.D244G | Q16819 | protein_coding | deleterious(0) | probably_damaging(1) | TCGA-E9-A1RF-01 | Breast | breast invasive carcinoma | Female | >=65 | III/IV | Hormone Therapy | tamoxiphen | SD |
| Page: 1 2 3 4 5 6 7 8 9 10 |
Top |
Related drugs of malignant transformation related genes |
| Identification of chemicals and drugs interact with genes involved in malignant transfromation |
| (DGIdb 4.0) |
| Entrez ID | Symbol | Category | Interaction Types | Drug Claim Name | Drug Name | PMIDs |
| Page: 1 |

Copyright 2023-Present -The University of Texas Health Science Center at Houston |