
|
|||||
|
 | |
| |
| |
| |
| |
| |
|
Gene: MELK |
Gene summary for MELK |
| Gene information | Species | Human | Gene symbol | MELK | Gene ID | 9833 |
| Gene name | maternal embryonic leucine zipper kinase | |
| Gene Alias | HPK38 | |
| Cytomap | 9p13.2 | |
| Gene Type | protein-coding | GO ID | GO:0000086 | UniProtAcc | Q14680 |
Top |
Malignant transformation analysis |
| Identification of the aberrant gene expression in precancerous and cancerous lesions by comparing the gene expression of stem-like cells in diseased tissues with normal stem cells |
| Entrez ID | Symbol | Replicates | Species | Organ | Tissue | Adj P-value | Log2FC | Malignancy |
| 9833 | MELK | GSM6177623_NYU_UCEC3_Vis | Human | Endometrium | EEC | 1.27e-03 | 1.98e-01 | -0.1269 |
| 9833 | MELK | LZE21T | Human | Esophagus | ESCC | 6.52e-03 | 2.29e-01 | 0.0655 |
| 9833 | MELK | P2T-E | Human | Esophagus | ESCC | 4.44e-08 | 2.94e-01 | 0.1177 |
| 9833 | MELK | P4T-E | Human | Esophagus | ESCC | 3.78e-04 | 1.55e-01 | 0.1323 |
| 9833 | MELK | P5T-E | Human | Esophagus | ESCC | 4.12e-11 | 1.99e-01 | 0.1327 |
| 9833 | MELK | P10T-E | Human | Esophagus | ESCC | 3.50e-02 | 1.11e-01 | 0.116 |
| 9833 | MELK | P17T-E | Human | Esophagus | ESCC | 8.50e-05 | 2.21e-01 | 0.1278 |
| 9833 | MELK | P19T-E | Human | Esophagus | ESCC | 6.53e-04 | 4.04e-01 | 0.1662 |
| 9833 | MELK | P21T-E | Human | Esophagus | ESCC | 8.40e-04 | 1.40e-01 | 0.1617 |
| 9833 | MELK | P24T-E | Human | Esophagus | ESCC | 3.60e-13 | 3.51e-01 | 0.1287 |
| 9833 | MELK | P28T-E | Human | Esophagus | ESCC | 1.46e-28 | 5.92e-01 | 0.1149 |
| 9833 | MELK | P30T-E | Human | Esophagus | ESCC | 9.20e-05 | 5.68e-01 | 0.137 |
| 9833 | MELK | P31T-E | Human | Esophagus | ESCC | 4.31e-06 | 2.20e-01 | 0.1251 |
| 9833 | MELK | P32T-E | Human | Esophagus | ESCC | 2.03e-09 | 2.64e-01 | 0.1666 |
| 9833 | MELK | P37T-E | Human | Esophagus | ESCC | 8.12e-03 | 1.28e-01 | 0.1371 |
| 9833 | MELK | P38T-E | Human | Esophagus | ESCC | 4.44e-08 | 5.44e-01 | 0.127 |
| 9833 | MELK | P49T-E | Human | Esophagus | ESCC | 6.53e-04 | 4.62e-01 | 0.1768 |
| 9833 | MELK | P52T-E | Human | Esophagus | ESCC | 3.60e-13 | 2.78e-01 | 0.1555 |
| 9833 | MELK | P74T-E | Human | Esophagus | ESCC | 1.02e-05 | 2.93e-01 | 0.1479 |
| 9833 | MELK | P75T-E | Human | Esophagus | ESCC | 1.88e-11 | 4.05e-01 | 0.1125 |
| Page: 1 2 3 |
| Tissue | Expression Dynamics | Abbreviation |
| Endometrium | 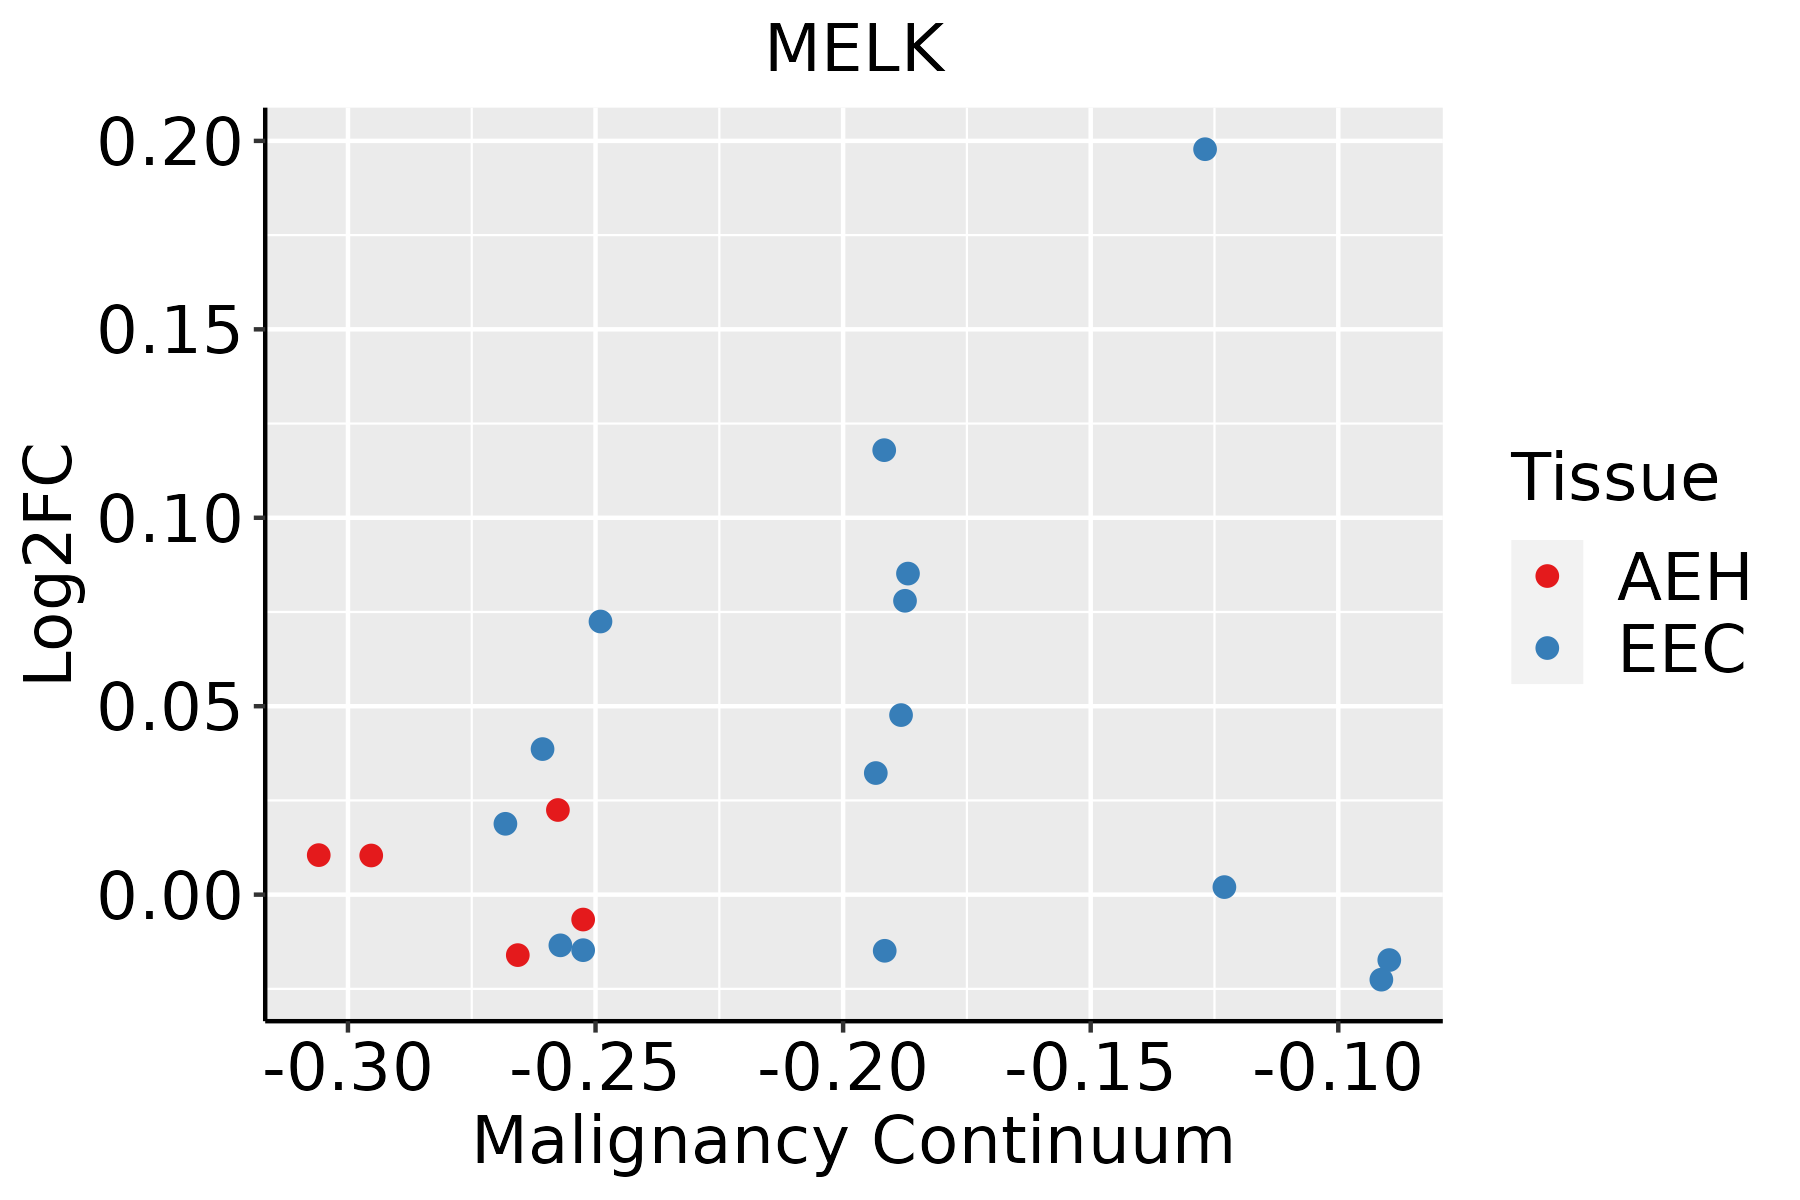 | AEH: Atypical endometrial hyperplasia |
| EEC: Endometrioid Cancer | ||
| Esophagus | 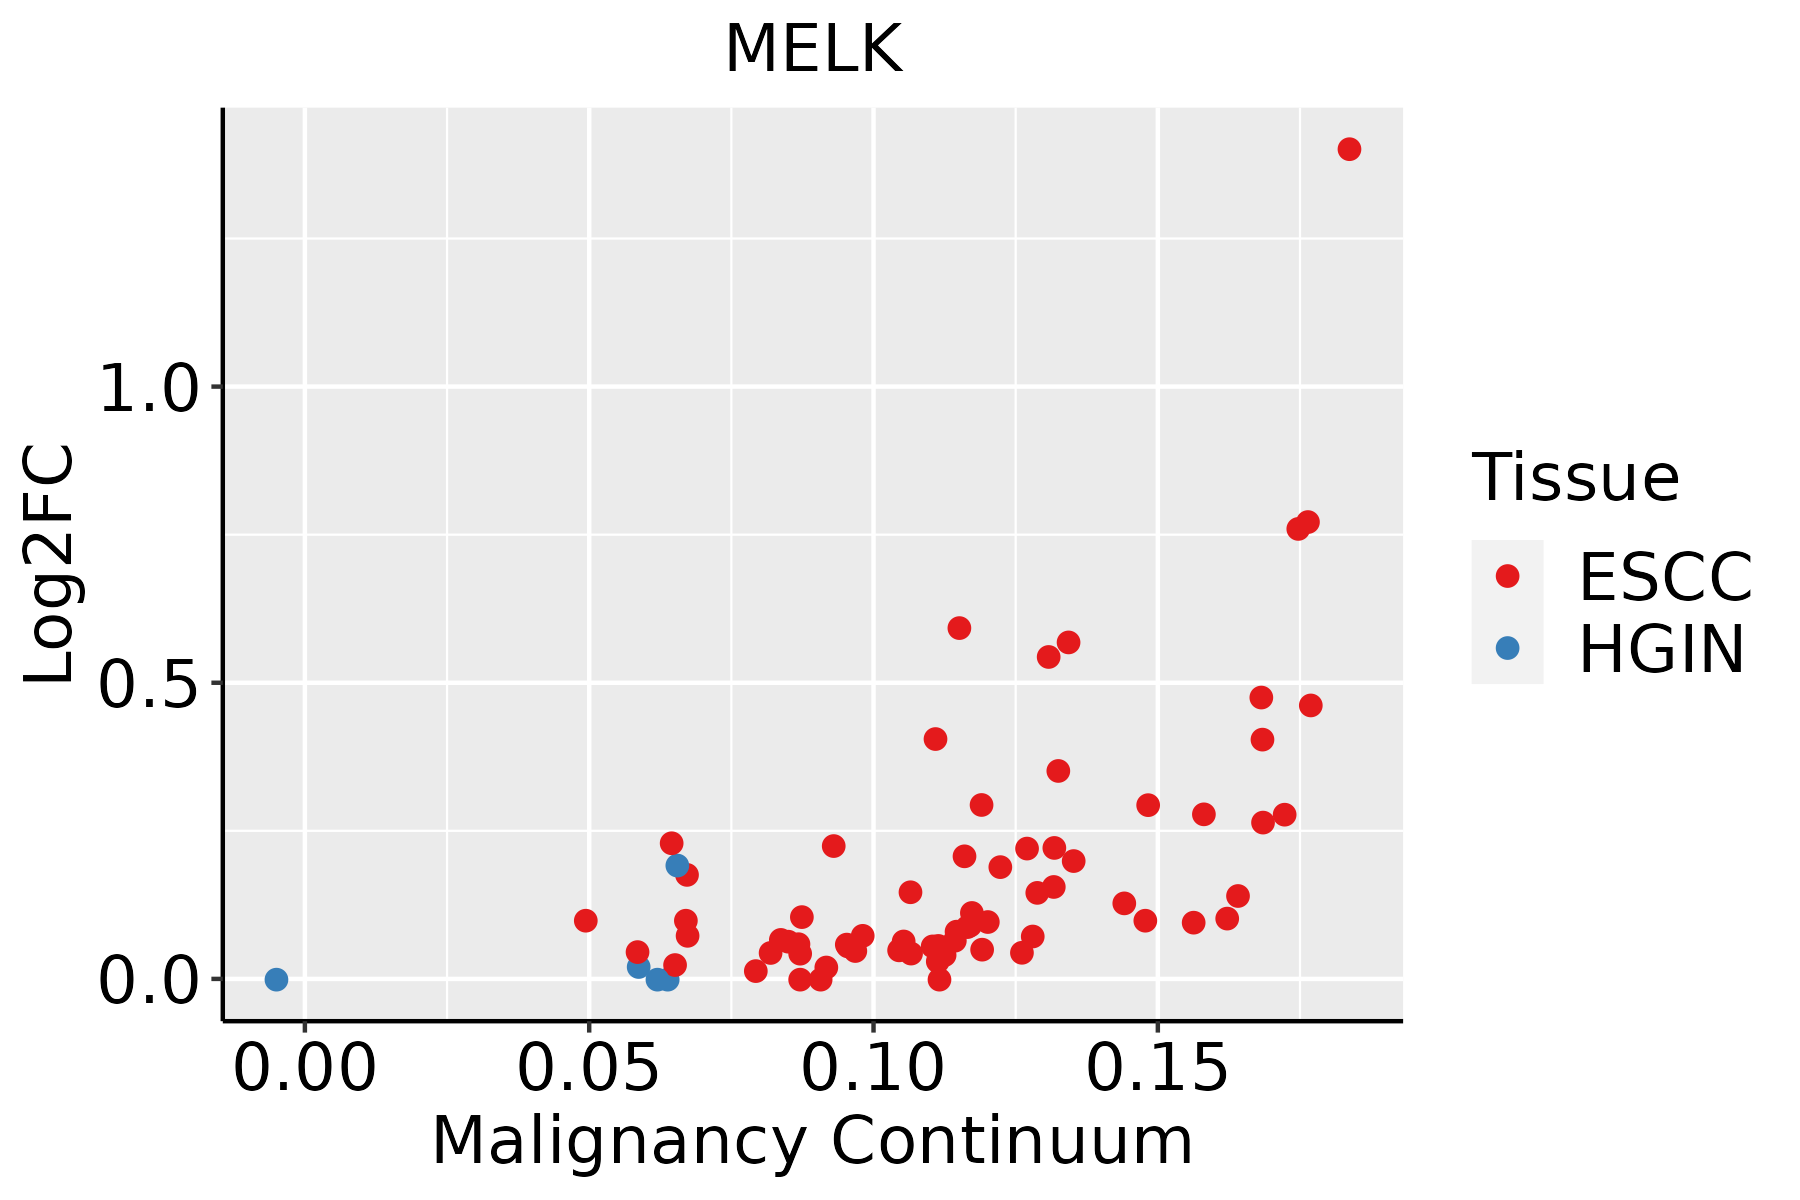 | ESCC: Esophageal squamous cell carcinoma |
| HGIN: High-grade intraepithelial neoplasias | ||
| LGIN: Low-grade intraepithelial neoplasias | ||
| Oral Cavity | 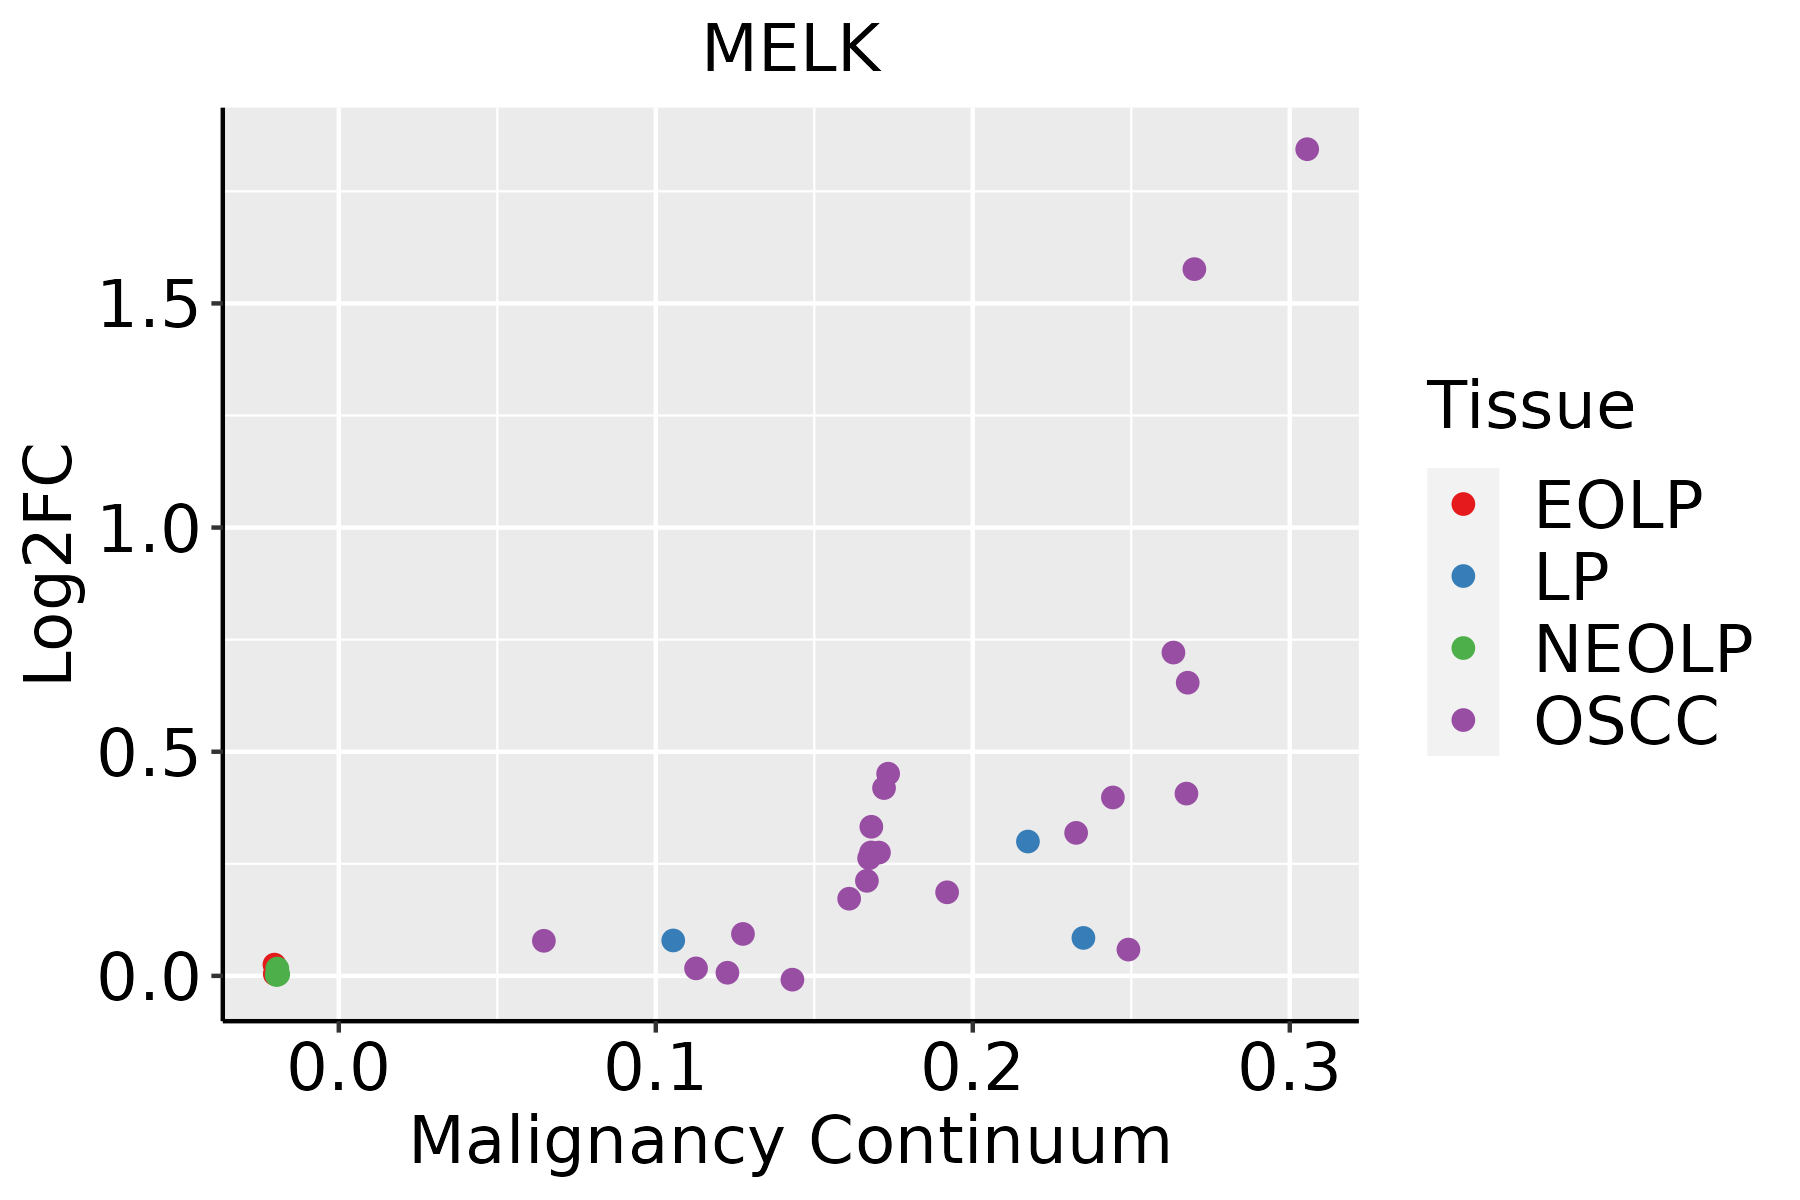 | EOLP: Erosive Oral lichen planus |
| LP: leukoplakia | ||
| NEOLP: Non-erosive oral lichen planus | ||
| OSCC: Oral squamous cell carcinoma | ||
| Skin | 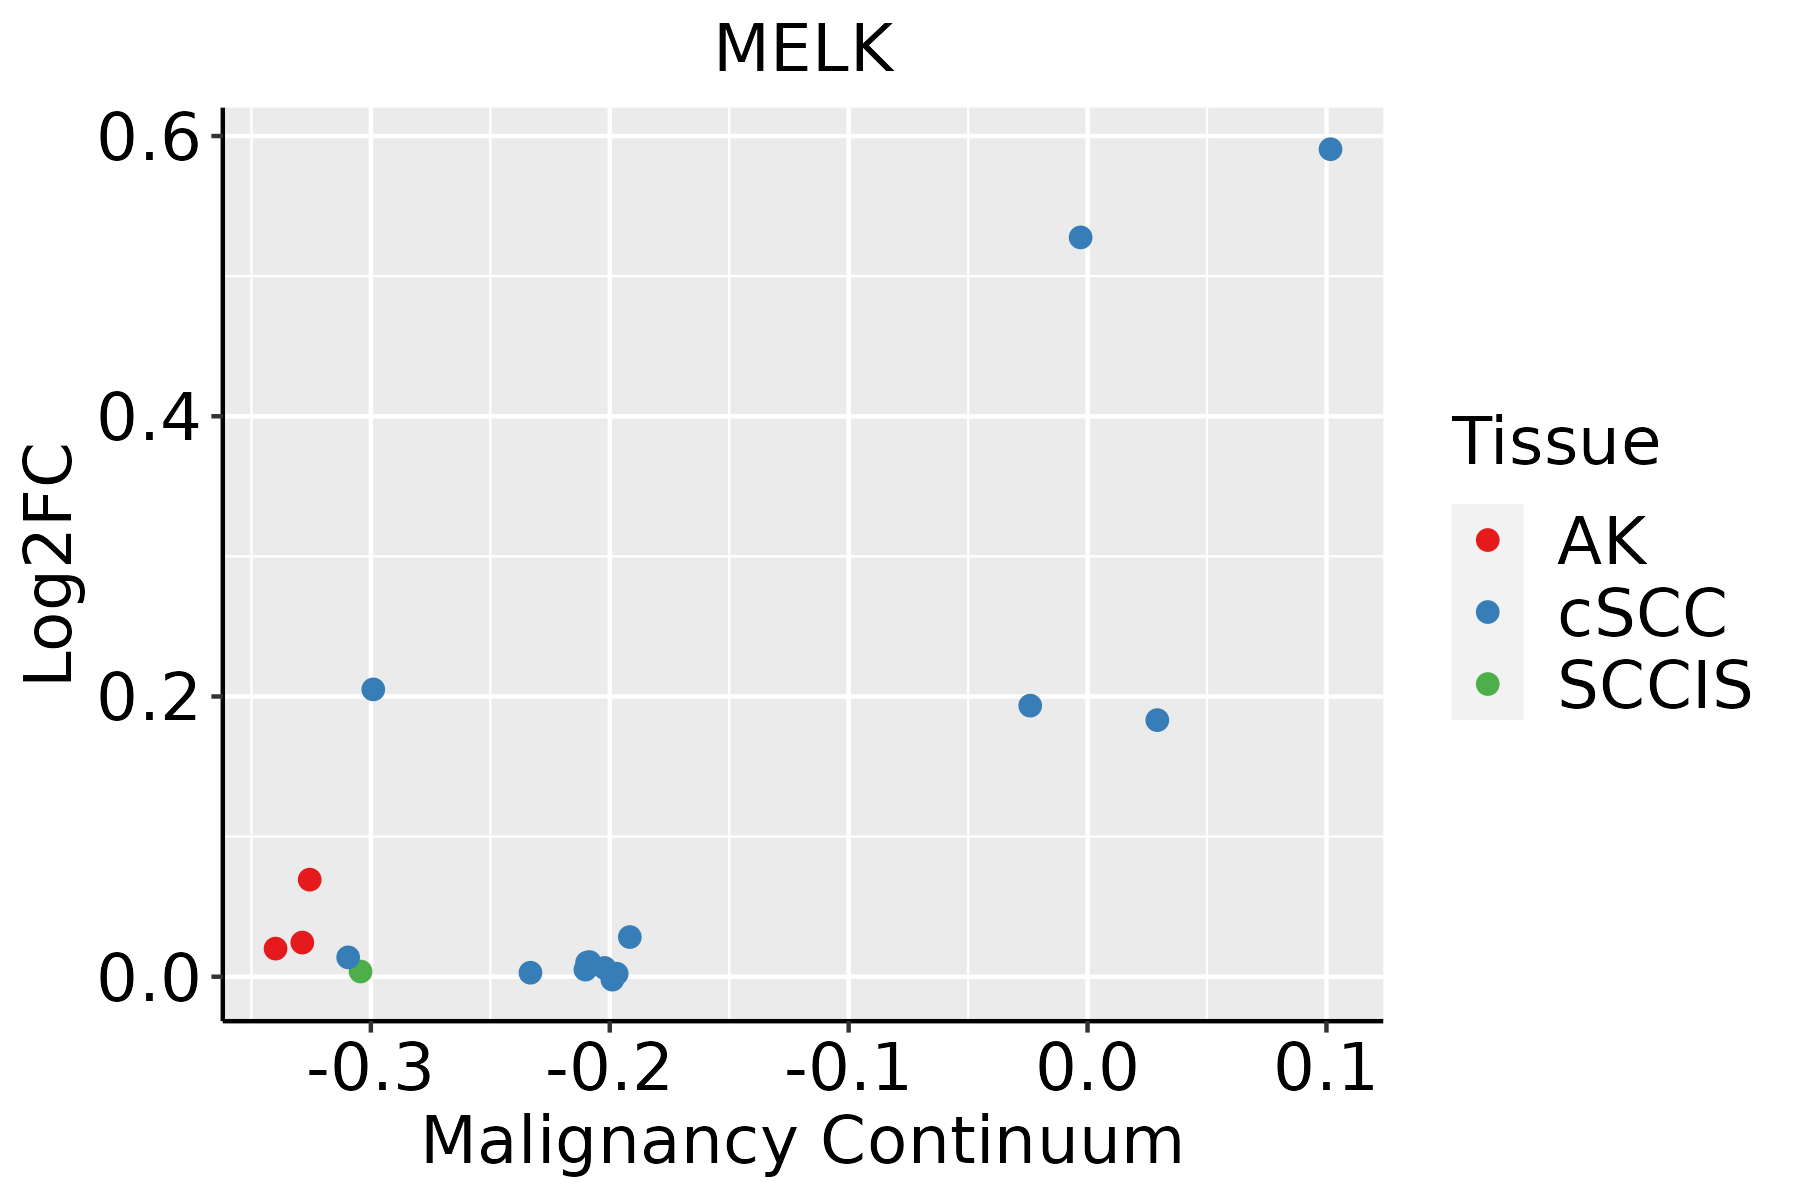 | AK: Actinic keratosis |
| cSCC: Cutaneous squamous cell carcinoma | ||
| SCCIS:squamous cell carcinoma in situ |
| ∗log2FC in expression of this searched gene in stem-like cells from each diseased tissue sample relative to stem-like cells in normal samples in each tissue plotted against the malignancy continuum. Samples are colored based on if they are from different disease stage. |
Top |
Malignant transformation related pathway analysis |
| Find out the enriched GO biological processes and KEGG pathways involved in transition from healthy to precancer to cancer |
| Tissue | Disease Stage | Enriched GO biological Processes |
| Colorectum | AD |  |
| Colorectum | SER |  |
| Colorectum | MSS |  |
| Colorectum | MSI-H |  |
| Colorectum | FAP |  |
| ∗Top 15 enriched GO BP terms are showed in the bar plot of each disease state in each tissue. Each row represents a significant GO biological process which is colored according to the -log10(p.adjust). |
| Page: 1 2 3 4 5 6 7 8 9 |
| GO ID | Tissue | Disease Stage | Description | Gene Ratio | Bg Ratio | pvalue | p.adjust | Count |
| GO:009719317 | Endometrium | EEC | intrinsic apoptotic signaling pathway | 80/2168 | 288/18723 | 3.35e-14 | 9.13e-12 | 80 |
| GO:000697917 | Endometrium | EEC | response to oxidative stress | 99/2168 | 446/18723 | 9.02e-11 | 1.13e-08 | 99 |
| GO:006219717 | Endometrium | EEC | cellular response to chemical stress | 77/2168 | 337/18723 | 2.87e-09 | 2.10e-07 | 77 |
| GO:003459917 | Endometrium | EEC | cellular response to oxidative stress | 63/2168 | 288/18723 | 4.05e-07 | 1.58e-05 | 63 |
| GO:000863114 | Endometrium | EEC | intrinsic apoptotic signaling pathway in response to oxidative stress | 15/2168 | 45/18723 | 9.95e-05 | 1.38e-03 | 15 |
| GO:003647316 | Endometrium | EEC | cell death in response to oxidative stress | 23/2168 | 95/18723 | 4.20e-04 | 4.40e-03 | 23 |
| GO:004477213 | Endometrium | EEC | mitotic cell cycle phase transition | 71/2168 | 424/18723 | 8.68e-04 | 7.97e-03 | 71 |
| GO:00613511 | Endometrium | EEC | neural precursor cell proliferation | 29/2168 | 145/18723 | 2.24e-03 | 1.67e-02 | 29 |
| GO:00467777 | Endometrium | EEC | protein autophosphorylation | 39/2168 | 227/18723 | 7.52e-03 | 4.21e-02 | 39 |
| GO:0097193111 | Esophagus | ESCC | intrinsic apoptotic signaling pathway | 222/8552 | 288/18723 | 5.87e-28 | 2.02e-25 | 222 |
| GO:0006979111 | Esophagus | ESCC | response to oxidative stress | 303/8552 | 446/18723 | 7.15e-22 | 1.30e-19 | 303 |
| GO:0062197111 | Esophagus | ESCC | cellular response to chemical stress | 234/8552 | 337/18723 | 5.37e-19 | 5.97e-17 | 234 |
| GO:004477216 | Esophagus | ESCC | mitotic cell cycle phase transition | 281/8552 | 424/18723 | 4.63e-18 | 4.45e-16 | 281 |
| GO:0034599111 | Esophagus | ESCC | cellular response to oxidative stress | 197/8552 | 288/18723 | 3.76e-15 | 2.15e-13 | 197 |
| GO:00448394 | Esophagus | ESCC | cell cycle G2/M phase transition | 103/8552 | 148/18723 | 3.09e-09 | 6.67e-08 | 103 |
| GO:00000864 | Esophagus | ESCC | G2/M transition of mitotic cell cycle | 96/8552 | 137/18723 | 6.00e-09 | 1.23e-07 | 96 |
| GO:0008631110 | Esophagus | ESCC | intrinsic apoptotic signaling pathway in response to oxidative stress | 38/8552 | 45/18723 | 8.42e-08 | 1.43e-06 | 38 |
| GO:004677710 | Esophagus | ESCC | protein autophosphorylation | 138/8552 | 227/18723 | 2.98e-06 | 3.38e-05 | 138 |
| GO:003647320 | Esophagus | ESCC | cell death in response to oxidative stress | 59/8552 | 95/18723 | 9.12e-04 | 4.65e-03 | 59 |
| GO:00182124 | Esophagus | ESCC | peptidyl-tyrosine modification | 202/8552 | 378/18723 | 1.34e-03 | 6.39e-03 | 202 |
| Page: 1 2 3 |
| Pathway ID | Tissue | Disease Stage | Description | Gene Ratio | Bg Ratio | pvalue | p.adjust | qvalue | Count |
| Page: 1 |
Top |
Cell-cell communication analysis |
| Identification of potential cell-cell interactions between two cell types and their ligand-receptor pairs for different disease states |
| Ligand | Receptor | LRpair | Pathway | Tissue | Disease Stage |
| Page: 1 |
Top |
Single-cell gene regulatory network inference analysis |
| Find out the significant the regulons (TFs) and the target genes of each regulon across cell types for different disease states |
| TF | Cell Type | Tissue | Disease Stage | Target Gene | RSS | Regulon Activity |
| ∗The dot plots of a searched regulon are shown for all cell subpopulations in each disease state of each tissue based on the regulon specific score inferred using pySCENIC and by calculating the average expression. |
| Page: 1 |
Top |
Somatic mutation of malignant transformation related genes |
| Annotation of somatic variants for genes involved in malignant transformation |
| Hugo Symbol | Variant Class | Variant Classification | dbSNP RS | HGVSc | HGVSp | HGVSp Short | SWISSPROT | BIOTYPE | SIFT | PolyPhen | Tumor Sample Barcode | Tissue | Histology | Sex | Age | Stage | Therapy Types | Drugs | Outcome |
| MELK | SNV | Missense_Mutation | c.931N>A | p.Asp311Asn | p.D311N | Q14680 | protein_coding | deleterious(0) | probably_damaging(0.998) | TCGA-BH-A0DH-01 | Breast | breast invasive carcinoma | Female | <65 | I/II | Chemotherapy | cyclophosphamide | SD | |
| MELK | SNV | Missense_Mutation | c.122N>A | p.Ile41Asn | p.I41N | Q14680 | protein_coding | deleterious(0) | probably_damaging(0.999) | TCGA-C8-A1HK-01 | Breast | breast invasive carcinoma | Female | <65 | I/II | Unknown | Unknown | SD | |
| MELK | SNV | Missense_Mutation | c.344N>G | p.Gln115Arg | p.Q115R | Q14680 | protein_coding | deleterious(0) | probably_damaging(0.998) | TCGA-E9-A1R5-01 | Breast | breast invasive carcinoma | Female | <65 | I/II | Hormone Therapy | tamoxiphen | SD | |
| MELK | SNV | Missense_Mutation | novel | c.1505N>A | p.Arg502Gln | p.R502Q | Q14680 | protein_coding | deleterious(0) | probably_damaging(0.981) | TCGA-2W-A8YY-01 | Cervix | cervical & endocervical cancer | Female | <65 | I/II | Chemotherapy | cisplatin | CR |
| MELK | SNV | Missense_Mutation | novel | c.1331C>T | p.Pro444Leu | p.P444L | Q14680 | protein_coding | tolerated(0.06) | benign(0.321) | TCGA-VS-A8EK-01 | Cervix | cervical & endocervical cancer | Female | >=65 | I/II | Chemotherapy | cisplatin | PD |
| MELK | SNV | Missense_Mutation | novel | c.236C>A | p.Ala79Asp | p.A79D | Q14680 | protein_coding | tolerated(0.4) | benign(0.001) | TCGA-AA-3530-01 | Colorectum | colon adenocarcinoma | Male | >=65 | I/II | Unknown | Unknown | SD |
| MELK | SNV | Missense_Mutation | rs757367254 | c.308G>A | p.Arg103His | p.R103H | Q14680 | protein_coding | tolerated(0.06) | possibly_damaging(0.503) | TCGA-AA-3950-01 | Colorectum | colon adenocarcinoma | Female | >=65 | I/II | Unknown | Unknown | SD |
| MELK | SNV | Missense_Mutation | novel | c.1898N>A | p.Gly633Asp | p.G633D | Q14680 | protein_coding | deleterious(0) | probably_damaging(1) | TCGA-AZ-4315-01 | Colorectum | colon adenocarcinoma | Male | <65 | I/II | Unknown | Unknown | SD |
| MELK | SNV | Missense_Mutation | c.1943N>C | p.Ser648Thr | p.S648T | Q14680 | protein_coding | tolerated(0.25) | benign(0.144) | TCGA-AZ-6606-01 | Colorectum | colon adenocarcinoma | Male | >=65 | III/IV | Chemotherapy | folfiri | PD | |
| MELK | SNV | Missense_Mutation | novel | c.1653A>T | p.Arg551Ser | p.R551S | Q14680 | protein_coding | tolerated(0.28) | benign(0.007) | TCGA-CA-6717-01 | Colorectum | colon adenocarcinoma | Male | <65 | I/II | Chemotherapy | oxaliplatin | CR |
| Page: 1 2 3 4 5 6 7 |
Top |
Related drugs of malignant transformation related genes |
| Identification of chemicals and drugs interact with genes involved in malignant transfromation |
| (DGIdb 4.0) |
| Entrez ID | Symbol | Category | Interaction Types | Drug Claim Name | Drug Name | PMIDs |
| 9833 | MELK | KINASE, DRUGGABLE GENOME, ENZYME, SERINE THREONINE KINASE | TAE-684 | TAE-684 | ||
| 9833 | MELK | KINASE, DRUGGABLE GENOME, ENZYME, SERINE THREONINE KINASE | SNS-314 | SNS-314 | ||
| 9833 | MELK | KINASE, DRUGGABLE GENOME, ENZYME, SERINE THREONINE KINASE | GW843682X | GW843682X | ||
| 9833 | MELK | KINASE, DRUGGABLE GENOME, ENZYME, SERINE THREONINE KINASE | TOZASERTIB | TOZASERTIB | ||
| 9833 | MELK | KINASE, DRUGGABLE GENOME, ENZYME, SERINE THREONINE KINASE | PF-562271 | PF-00562271 | ||
| 9833 | MELK | KINASE, DRUGGABLE GENOME, ENZYME, SERINE THREONINE KINASE | OTSSP167 | |||
| 9833 | MELK | KINASE, DRUGGABLE GENOME, ENZYME, SERINE THREONINE KINASE | AG-1879 | CHEMBL406845 | ||
| 9833 | MELK | KINASE, DRUGGABLE GENOME, ENZYME, SERINE THREONINE KINASE | LINIFANIB | LINIFANIB | ||
| 9833 | MELK | KINASE, DRUGGABLE GENOME, ENZYME, SERINE THREONINE KINASE | RG-1530 | RG-1530 | ||
| 9833 | MELK | KINASE, DRUGGABLE GENOME, ENZYME, SERINE THREONINE KINASE | inhibitor | 328083468 |
| Page: 1 2 3 |

Copyright 2023-Present -The University of Texas Health Science Center at Houston |