
|
|||||
|
 | |
| |
| |
| |
| |
| |
|
Gene: MEIS3 |
Gene summary for MEIS3 |
| Gene information | Species | Human | Gene symbol | MEIS3 | Gene ID | 56917 |
| Gene name | Meis homeobox 3 | |
| Gene Alias | MRG2 | |
| Cytomap | 19q13.32 | |
| Gene Type | protein-coding | GO ID | GO:0001654 | UniProtAcc | A0A024R0S2 |
Top |
Malignant transformation analysis |
| Identification of the aberrant gene expression in precancerous and cancerous lesions by comparing the gene expression of stem-like cells in diseased tissues with normal stem cells |
| Entrez ID | Symbol | Replicates | Species | Organ | Tissue | Adj P-value | Log2FC | Malignancy |
| 56917 | MEIS3 | C30 | Human | Oral cavity | OSCC | 8.97e-12 | 7.09e-01 | 0.3055 |
| 56917 | MEIS3 | C38 | Human | Oral cavity | OSCC | 4.26e-06 | 6.18e-01 | 0.172 |
| 56917 | MEIS3 | C09 | Human | Oral cavity | OSCC | 4.00e-05 | 3.68e-01 | 0.1431 |
| Page: 1 |
| Tissue | Expression Dynamics | Abbreviation |
| Oral Cavity | 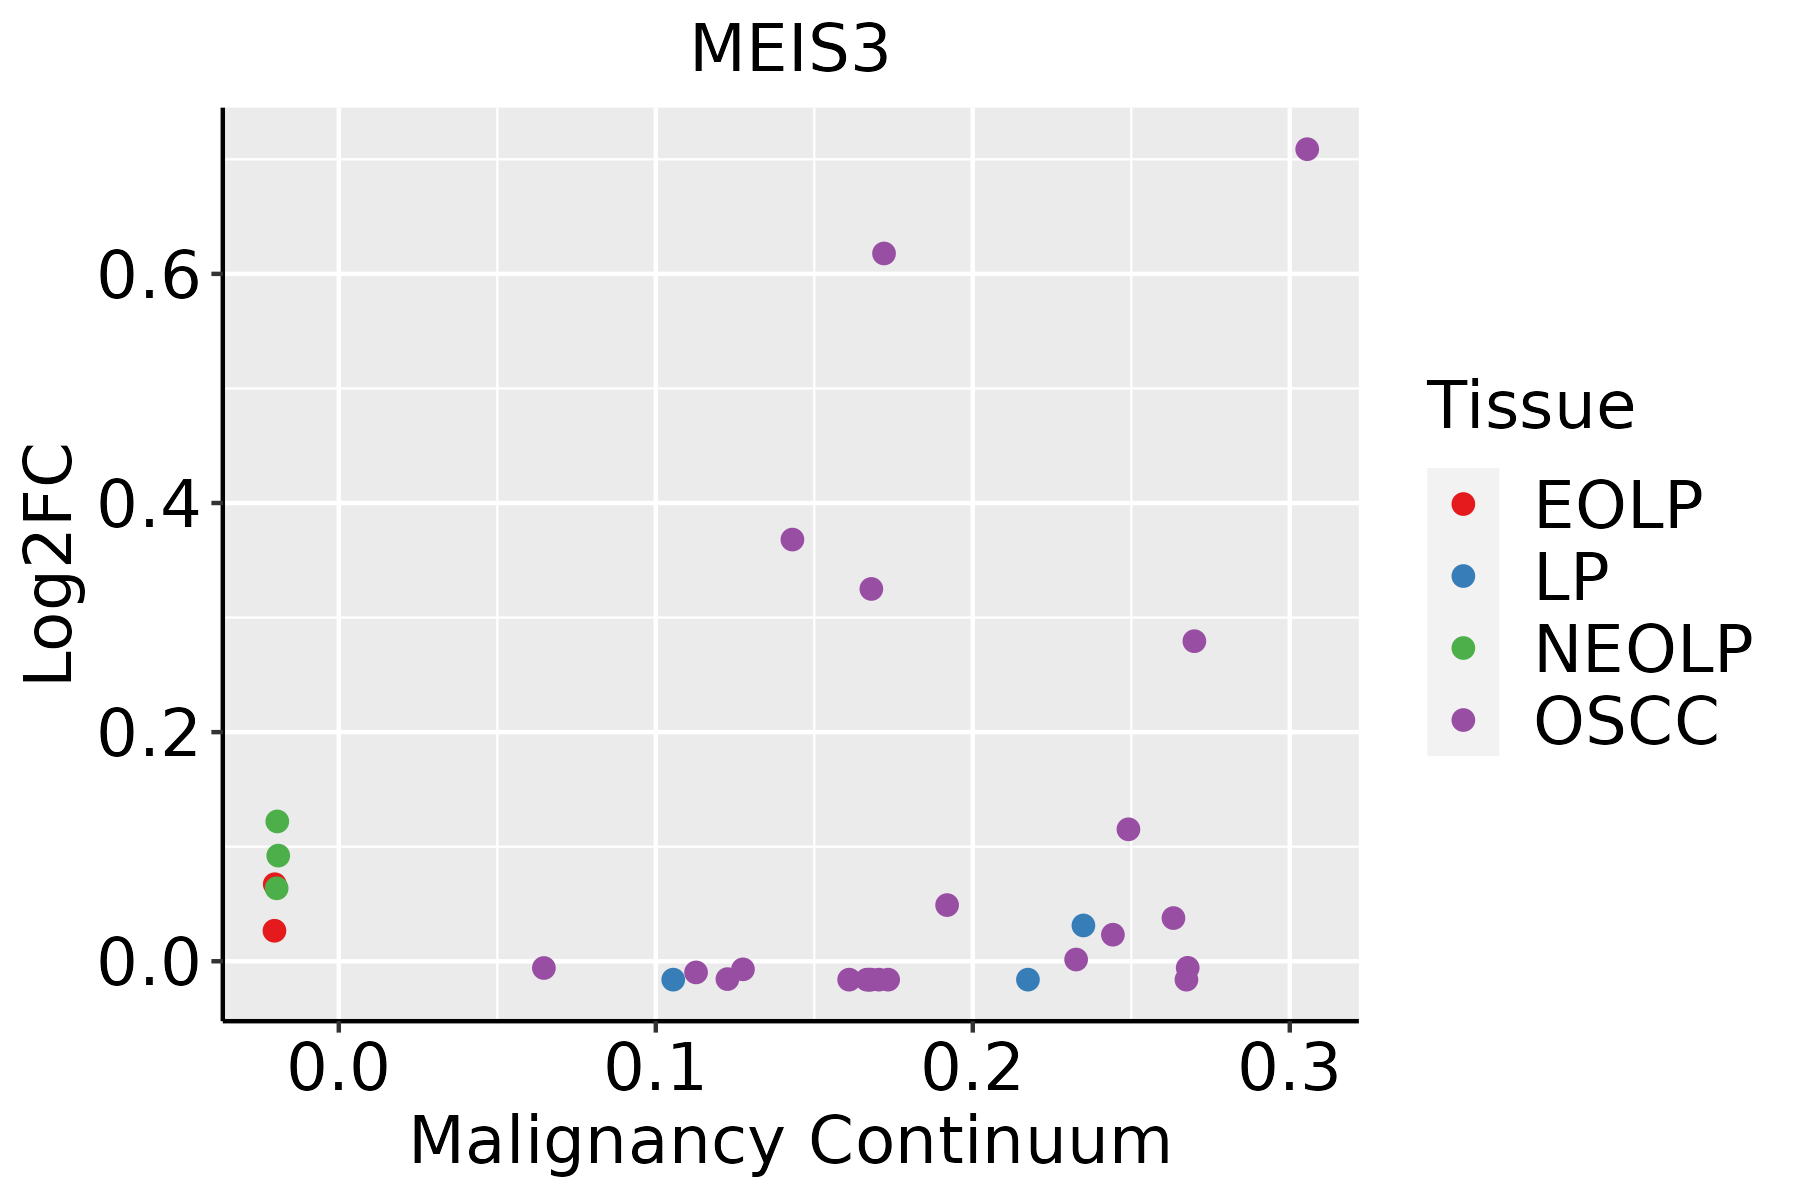 | EOLP: Erosive Oral lichen planus |
| LP: leukoplakia | ||
| NEOLP: Non-erosive oral lichen planus | ||
| OSCC: Oral squamous cell carcinoma |
| ∗log2FC in expression of this searched gene in stem-like cells from each diseased tissue sample relative to stem-like cells in normal samples in each tissue plotted against the malignancy continuum. Samples are colored based on if they are from different disease stage. |
Top |
Malignant transformation related pathway analysis |
| Find out the enriched GO biological processes and KEGG pathways involved in transition from healthy to precancer to cancer |
| Tissue | Disease Stage | Enriched GO biological Processes |
| Colorectum | AD |  |
| Colorectum | SER |  |
| Colorectum | MSS |  |
| Colorectum | MSI-H |  |
| Colorectum | FAP |  |
| ∗Top 15 enriched GO BP terms are showed in the bar plot of each disease state in each tissue. Each row represents a significant GO biological process which is colored according to the -log10(p.adjust). |
| Page: 1 2 3 4 5 6 7 8 9 |
| GO ID | Tissue | Disease Stage | Description | Gene Ratio | Bg Ratio | pvalue | p.adjust | Count |
| GO:200123320 | Oral cavity | OSCC | regulation of apoptotic signaling pathway | 242/7305 | 356/18723 | 6.66e-29 | 3.24e-26 | 242 |
| GO:200123420 | Oral cavity | OSCC | negative regulation of apoptotic signaling pathway | 148/7305 | 224/18723 | 1.71e-16 | 1.36e-14 | 148 |
| GO:00434916 | Oral cavity | OSCC | protein kinase B signaling | 103/7305 | 211/18723 | 2.29e-03 | 1.02e-02 | 103 |
| GO:00518976 | Oral cavity | OSCC | positive regulation of protein kinase B signaling | 61/7305 | 120/18723 | 5.52e-03 | 2.14e-02 | 61 |
| GO:00518967 | Oral cavity | OSCC | regulation of protein kinase B signaling | 88/7305 | 185/18723 | 1.07e-02 | 3.64e-02 | 88 |
| Page: 1 |
| Pathway ID | Tissue | Disease Stage | Description | Gene Ratio | Bg Ratio | pvalue | p.adjust | qvalue | Count |
| Page: 1 |
Top |
Cell-cell communication analysis |
| Identification of potential cell-cell interactions between two cell types and their ligand-receptor pairs for different disease states |
| Ligand | Receptor | LRpair | Pathway | Tissue | Disease Stage |
| Page: 1 |
Top |
Single-cell gene regulatory network inference analysis |
| Find out the significant the regulons (TFs) and the target genes of each regulon across cell types for different disease states |
| TF | Cell Type | Tissue | Disease Stage | Target Gene | RSS | Regulon Activity |
| MEIS3 | GLAN | Endometrium | ADJ | AC244033.2,CMC4,MFAP4, etc. | 6.57e-01 |  |
| MEIS3 | GLAN | Endometrium | AEH | AC244033.2,CMC4,MFAP4, etc. | 4.54e-01 |  |
| MEIS3 | GLAN | Endometrium | EEC | AC244033.2,CMC4,MFAP4, etc. | 2.69e-01 |  |
| MEIS3 | CAF | Liver | HCC | USF1,NIPAL2,SEMA5A, etc. | 7.36e-02 |  |
| MEIS3 | CAF | Liver | Healthy | USF1,NIPAL2,SEMA5A, etc. | 5.56e-01 |  |
| MEIS3 | CAF | Liver | NAFLD | USF1,NIPAL2,SEMA5A, etc. | 6.49e-01 |  |
| MEIS3 | INCAF | Oral cavity | OSCC | COL5A1,POSTN,SPARC, etc. | 4.67e-01 |  |
| MEIS3 | URO | Prostate | ADJ | LY6K,TMEM117,WFDC3, etc. | 1.94e-01 |  |
| MEIS3 | PERI | Prostate | Tumor | SHROOM1,SEMA3D,CDH10, etc. | 2.57e-01 |  |
| MEIS3 | MYOFIB | Stomach | GC | HOMER1,COL5A2,OLFM2, etc. | 3.41e-01 |  |
| ∗The dot plots of a searched regulon are shown for all cell subpopulations in each disease state of each tissue based on the regulon specific score inferred using pySCENIC and by calculating the average expression. |
| Page: 1 2 |
Top |
Somatic mutation of malignant transformation related genes |
| Annotation of somatic variants for genes involved in malignant transformation |
| Hugo Symbol | Variant Class | Variant Classification | dbSNP RS | HGVSc | HGVSp | HGVSp Short | SWISSPROT | BIOTYPE | SIFT | PolyPhen | Tumor Sample Barcode | Tissue | Histology | Sex | Age | Stage | Therapy Types | Drugs | Outcome |
| MEIS3 | SNV | Missense_Mutation | novel | c.401N>C | p.Ile134Thr | p.I134T | Q99687 | protein_coding | deleterious(0) | benign(0.273) | TCGA-AN-A046-01 | Breast | breast invasive carcinoma | Female | >=65 | I/II | Unknown | Unknown | SD |
| MEIS3 | SNV | Missense_Mutation | rs754882587 | c.980C>T | p.Ser327Phe | p.S327F | Q99687 | protein_coding | tolerated_low_confidence(0.73) | benign(0.007) | TCGA-JW-A5VL-01 | Cervix | cervical & endocervical cancer | Female | <65 | I/II | Unknown | Unknown | SD |
| MEIS3 | SNV | Missense_Mutation | c.1084N>A | p.Ala362Thr | p.A362T | Q99687 | protein_coding | deleterious(0) | possibly_damaging(0.765) | TCGA-AA-3715-01 | Colorectum | colon adenocarcinoma | Male | >=65 | I/II | Unknown | Unknown | PD | |
| MEIS3 | SNV | Missense_Mutation | novel | c.1088G>A | p.Arg363Gln | p.R363Q | Q99687 | protein_coding | deleterious(0) | benign(0.288) | TCGA-AA-3949-01 | Colorectum | colon adenocarcinoma | Female | >=65 | III/IV | Unknown | Unknown | SD |
| MEIS3 | SNV | Missense_Mutation | rs752747235 | c.781N>T | p.Arg261Trp | p.R261W | Q99687 | protein_coding | deleterious(0) | probably_damaging(0.997) | TCGA-AA-A02W-01 | Colorectum | colon adenocarcinoma | Female | >=65 | I/II | Unknown | Unknown | PD |
| MEIS3 | SNV | Missense_Mutation | c.1201N>A | p.Ala401Thr | p.A401T | Q99687 | protein_coding | tolerated_low_confidence(0.55) | benign(0) | TCGA-AD-6964-01 | Colorectum | colon adenocarcinoma | Male | <65 | III/IV | Chemotherapy | folfox | PD | |
| MEIS3 | SNV | Missense_Mutation | c.881N>G | p.Leu294Arg | p.L294R | Q99687 | protein_coding | tolerated_low_confidence(0.21) | benign(0.112) | TCGA-AM-5821-01 | Colorectum | colon adenocarcinoma | Female | >=65 | I/II | Unknown | Unknown | SD | |
| MEIS3 | SNV | Missense_Mutation | c.76N>A | p.Glu26Lys | p.E26K | Q99687 | protein_coding | tolerated(0.06) | probably_damaging(0.991) | TCGA-CK-4951-01 | Colorectum | colon adenocarcinoma | Female | >=65 | I/II | Unknown | Unknown | PD | |
| MEIS3 | SNV | Missense_Mutation | c.338N>T | p.Ala113Val | p.A113V | Q99687 | protein_coding | tolerated(0.24) | possibly_damaging(0.737) | TCGA-CM-5864-01 | Colorectum | colon adenocarcinoma | Male | <65 | I/II | Unknown | Unknown | SD | |
| MEIS3 | SNV | Missense_Mutation | c.1114N>A | p.Asp372Asn | p.D372N | Q99687 | protein_coding | deleterious(0.01) | benign(0.017) | TCGA-F4-6570-01 | Colorectum | colon adenocarcinoma | Female | >=65 | I/II | Unknown | Unknown | SD |
| Page: 1 2 3 4 |
Top |
Related drugs of malignant transformation related genes |
| Identification of chemicals and drugs interact with genes involved in malignant transfromation |
| (DGIdb 4.0) |
| Entrez ID | Symbol | Category | Interaction Types | Drug Claim Name | Drug Name | PMIDs |
| Page: 1 |

Copyright 2023-Present -The University of Texas Health Science Center at Houston |