
|
|||||
|
 | |
| |
| |
| |
| |
| |
|
Gene: MEIS2 |
Gene summary for MEIS2 |
| Gene information | Species | Human | Gene symbol | MEIS2 | Gene ID | 4212 |
| Gene name | Meis homeobox 2 | |
| Gene Alias | CPCMR | |
| Cytomap | 15q14 | |
| Gene Type | protein-coding | GO ID | GO:0000122 | UniProtAcc | A0A024R9L4 |
Top |
Malignant transformation analysis |
| Identification of the aberrant gene expression in precancerous and cancerous lesions by comparing the gene expression of stem-like cells in diseased tissues with normal stem cells |
| Entrez ID | Symbol | Replicates | Species | Organ | Tissue | Adj P-value | Log2FC | Malignancy |
| 4212 | MEIS2 | AEH-subject1 | Human | Endometrium | AEH | 2.57e-21 | 6.19e-01 | -0.3059 |
| 4212 | MEIS2 | AEH-subject2 | Human | Endometrium | AEH | 1.97e-19 | 6.27e-01 | -0.2525 |
| 4212 | MEIS2 | AEH-subject3 | Human | Endometrium | AEH | 3.21e-24 | 6.66e-01 | -0.2576 |
| 4212 | MEIS2 | AEH-subject4 | Human | Endometrium | AEH | 8.92e-23 | 7.27e-01 | -0.2657 |
| 4212 | MEIS2 | AEH-subject5 | Human | Endometrium | AEH | 1.74e-06 | 3.34e-01 | -0.2953 |
| 4212 | MEIS2 | EEC-subject1 | Human | Endometrium | EEC | 3.47e-12 | 4.73e-01 | -0.2682 |
| 4212 | MEIS2 | EEC-subject2 | Human | Endometrium | EEC | 7.33e-32 | 8.51e-01 | -0.2607 |
| 4212 | MEIS2 | EEC-subject3 | Human | Endometrium | EEC | 6.62e-03 | -2.85e-02 | -0.2525 |
| 4212 | MEIS2 | EEC-subject4 | Human | Endometrium | EEC | 4.61e-15 | 5.14e-01 | -0.2571 |
| 4212 | MEIS2 | EEC-subject5 | Human | Endometrium | EEC | 1.54e-13 | 4.75e-01 | -0.249 |
| 4212 | MEIS2 | GSM5276935 | Human | Endometrium | EEC | 4.01e-02 | -9.90e-02 | -0.123 |
| 4212 | MEIS2 | GSM6177620_NYU_UCEC1_lib1_lib1 | Human | Endometrium | EEC | 3.49e-06 | 1.24e-01 | -0.1869 |
| 4212 | MEIS2 | GSM6177620_NYU_UCEC1_lib2_lib2 | Human | Endometrium | EEC | 1.26e-05 | 8.81e-02 | -0.1875 |
| 4212 | MEIS2 | GSM6177620_NYU_UCEC1_lib3_lib3 | Human | Endometrium | EEC | 1.10e-06 | 9.98e-02 | -0.1883 |
| 4212 | MEIS2 | GSM6177622_NYU_UCEC3_lib1_lib1 | Human | Endometrium | EEC | 7.85e-04 | -1.00e-01 | -0.1917 |
| 4212 | MEIS2 | GSM6177622_NYU_UCEC3_lib2_lib2 | Human | Endometrium | EEC | 1.69e-03 | -7.96e-02 | -0.1916 |
| 4212 | MEIS2 | LZE4T | Human | Esophagus | ESCC | 6.69e-06 | 1.58e-01 | 0.0811 |
| 4212 | MEIS2 | LZE5T | Human | Esophagus | ESCC | 2.73e-03 | 2.17e-01 | 0.0514 |
| 4212 | MEIS2 | LZE8T | Human | Esophagus | ESCC | 3.77e-03 | 2.09e-01 | 0.067 |
| 4212 | MEIS2 | LZE21T | Human | Esophagus | ESCC | 3.13e-05 | 3.31e-01 | 0.0655 |
| Page: 1 2 3 4 5 6 7 8 |
| Tissue | Expression Dynamics | Abbreviation |
| Endometrium | 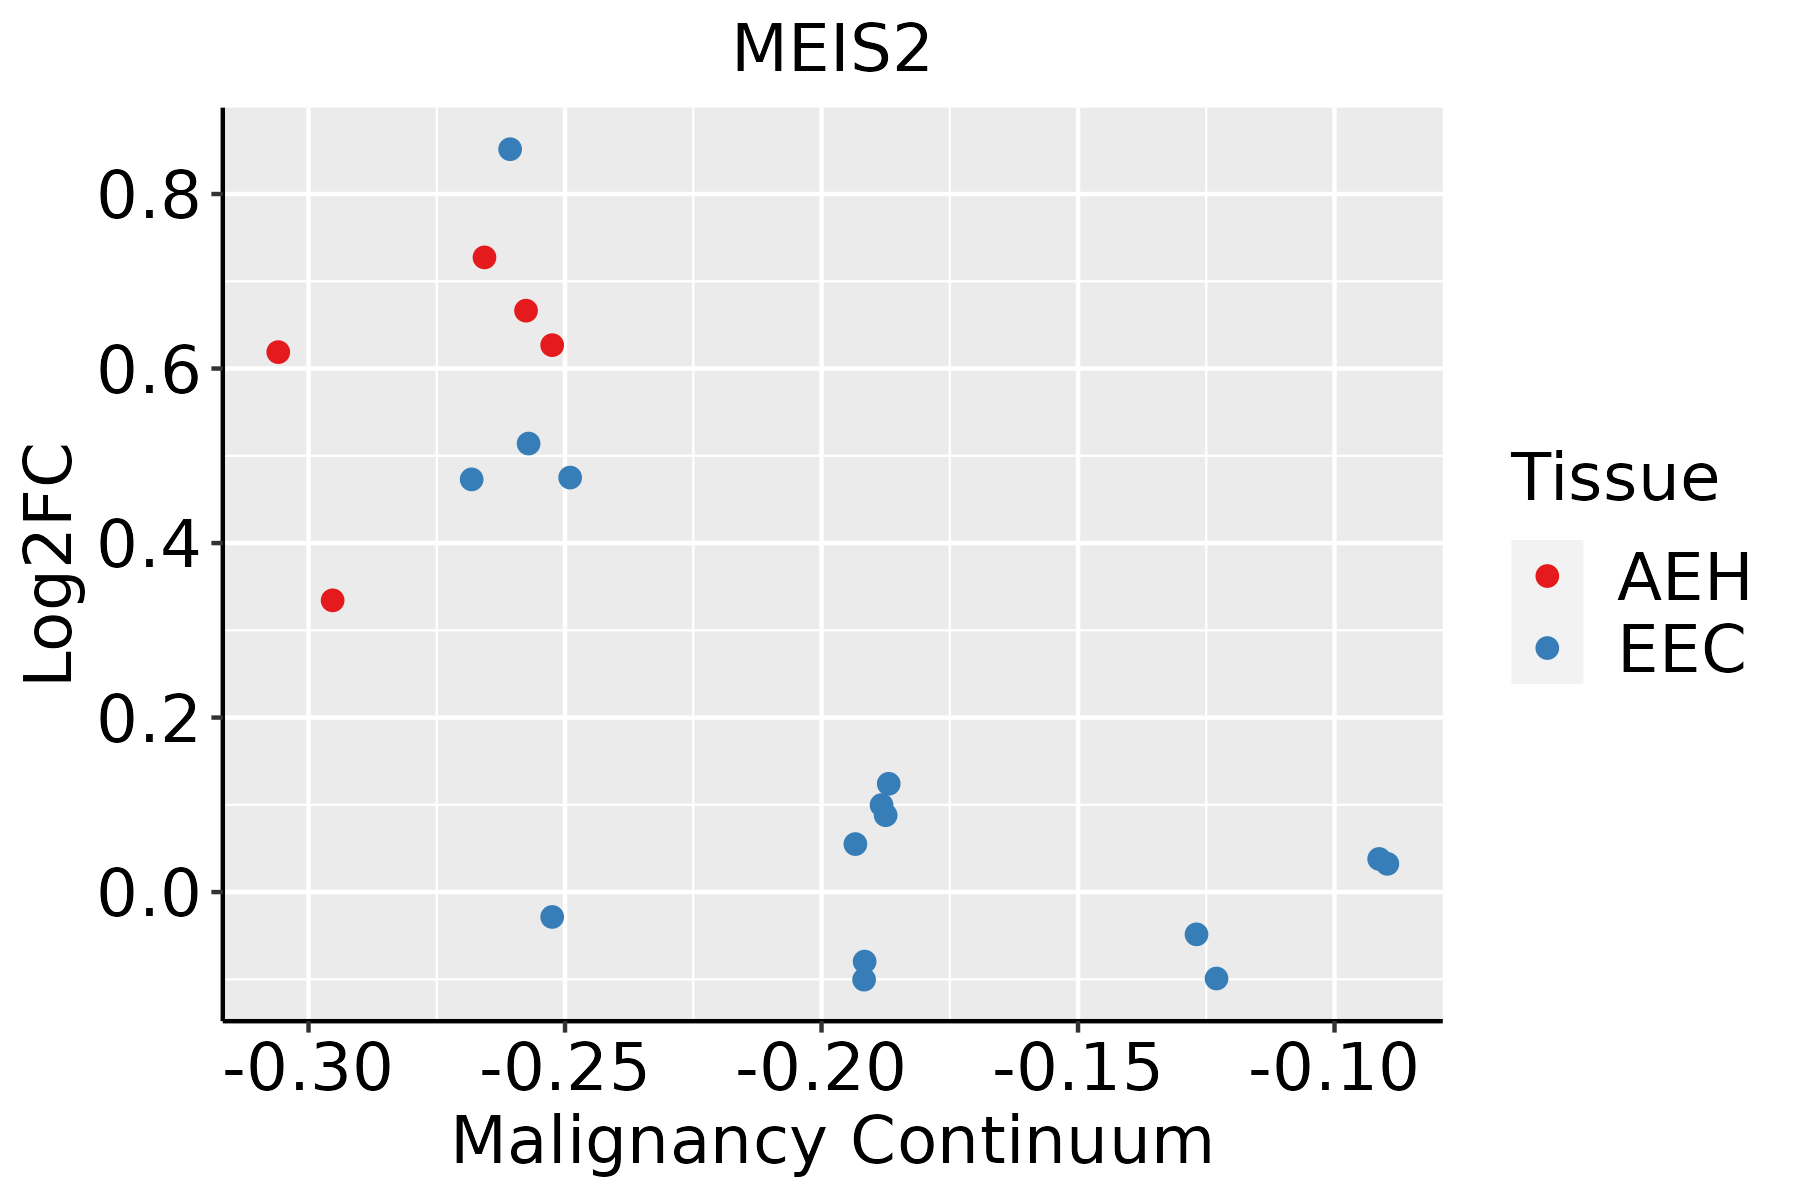 | AEH: Atypical endometrial hyperplasia |
| EEC: Endometrioid Cancer | ||
| Esophagus | 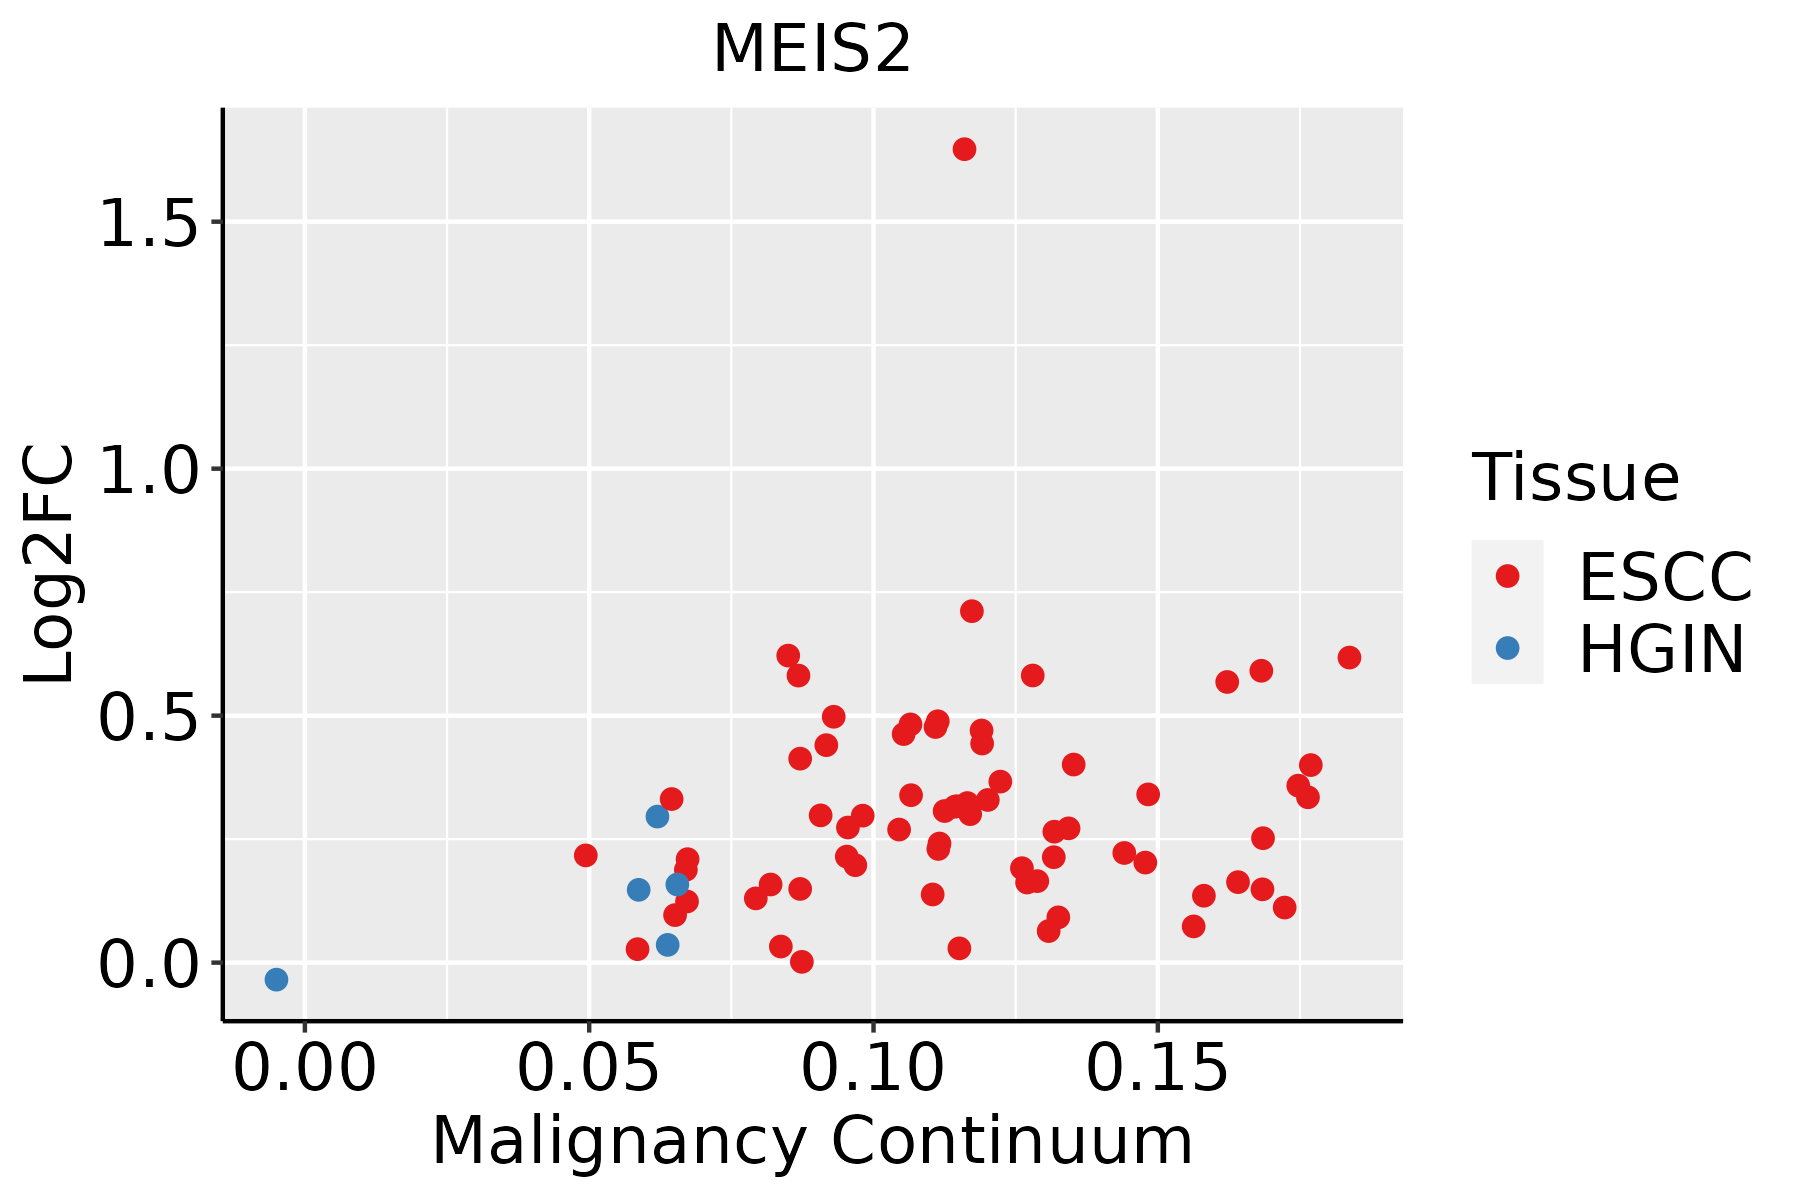 | ESCC: Esophageal squamous cell carcinoma |
| HGIN: High-grade intraepithelial neoplasias | ||
| LGIN: Low-grade intraepithelial neoplasias | ||
| GC |  | CAG: Chronic atrophic gastritis |
| CAG with IM: Chronic atrophic gastritis with intestinal metaplasia | ||
| CSG: Chronic superficial gastritis | ||
| GC: Gastric cancer | ||
| SIM: Severe intestinal metaplasia | ||
| WIM: Wild intestinal metaplasia | ||
| Lung | 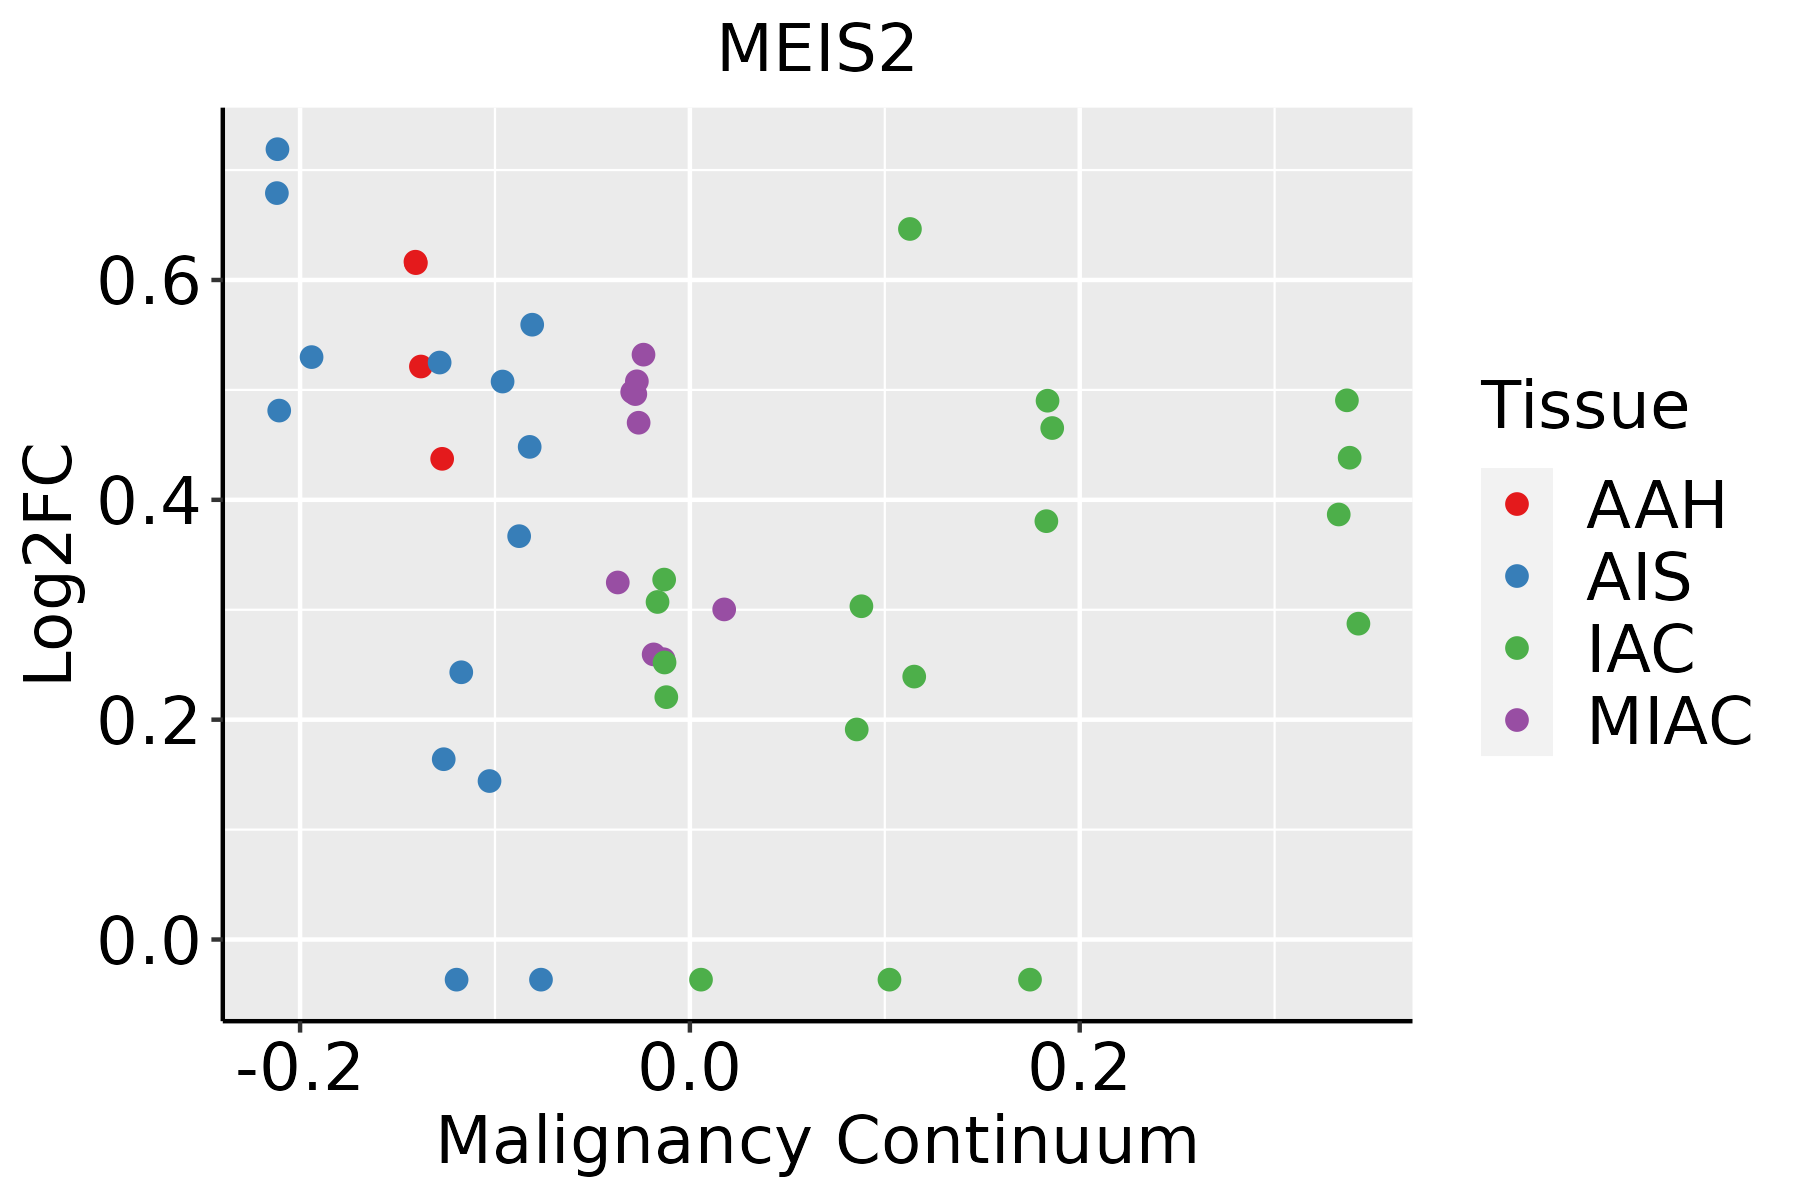 | AAH: Atypical adenomatous hyperplasia |
| AIS: Adenocarcinoma in situ | ||
| IAC: Invasive lung adenocarcinoma | ||
| MIA: Minimally invasive adenocarcinoma | ||
| Oral Cavity | 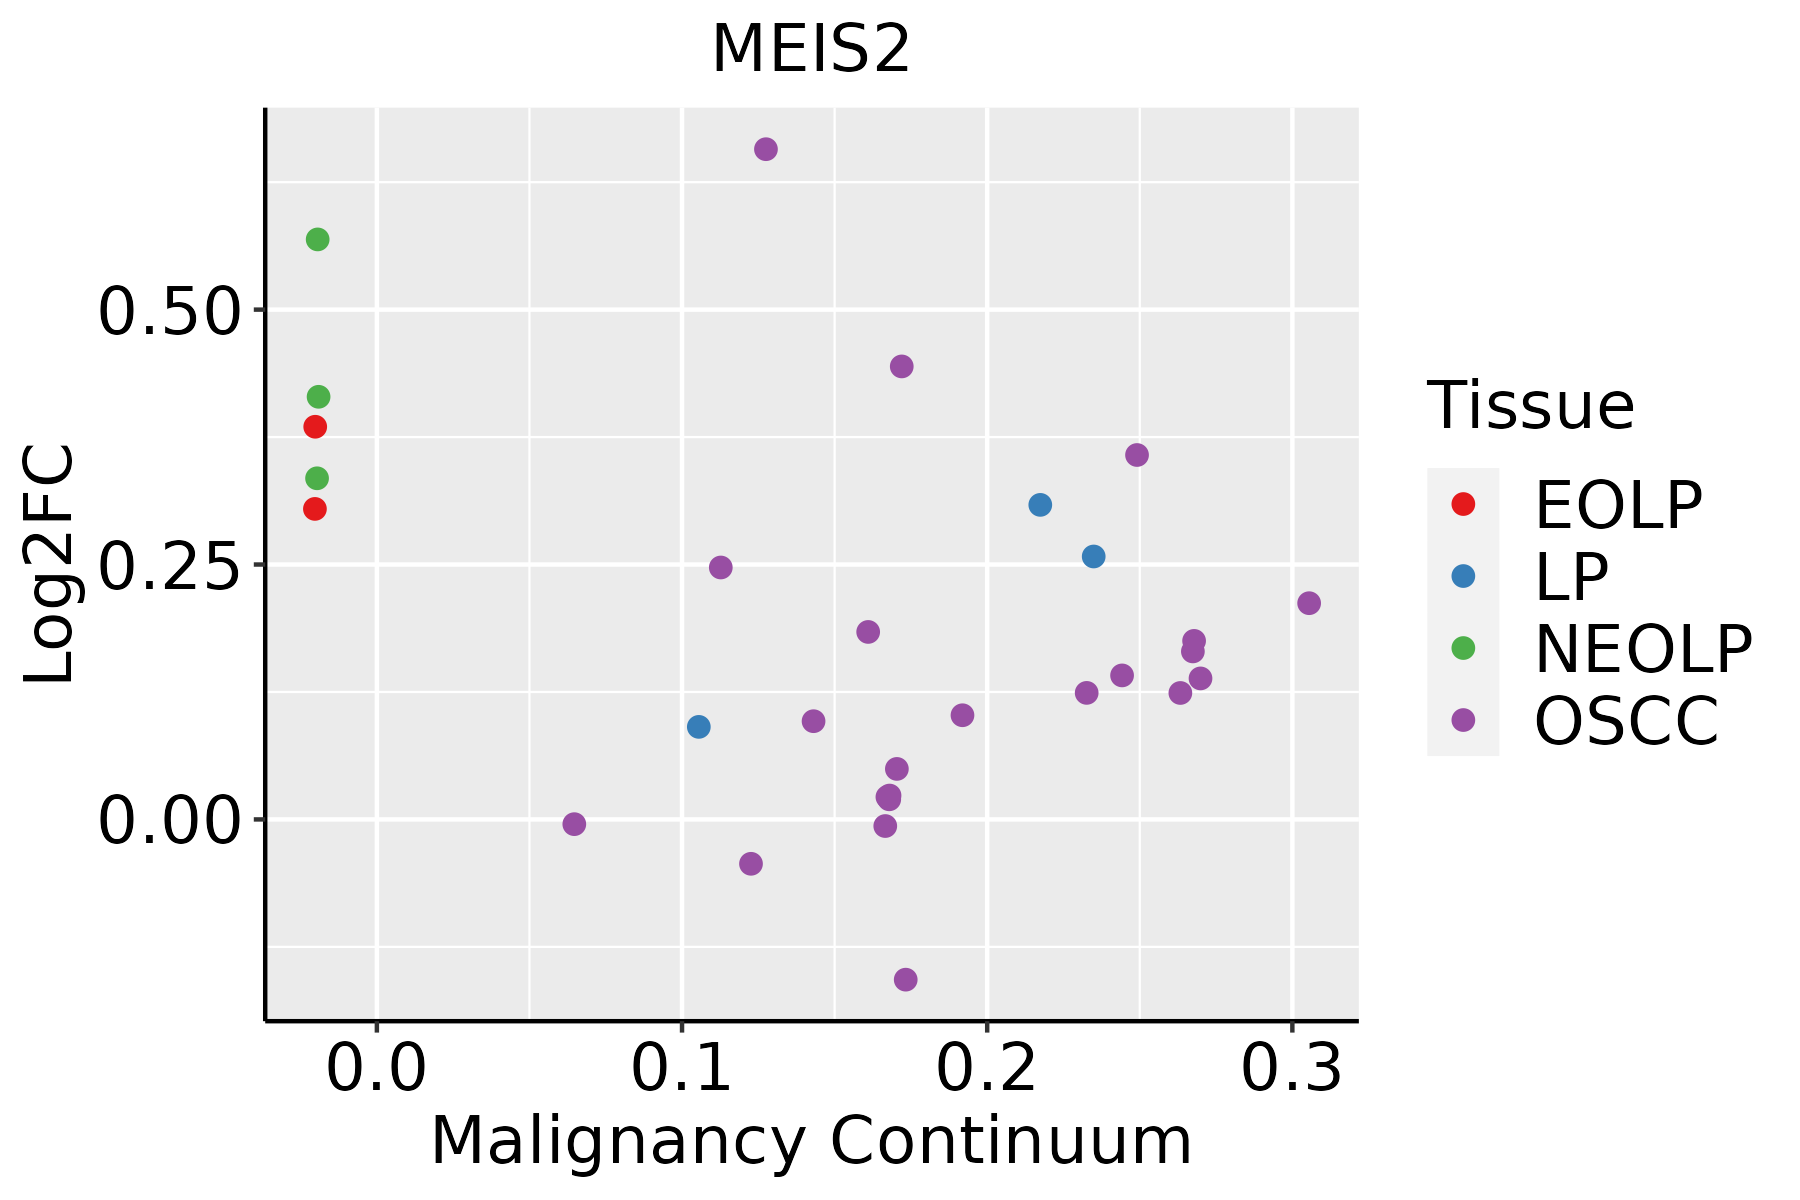 | EOLP: Erosive Oral lichen planus |
| LP: leukoplakia | ||
| NEOLP: Non-erosive oral lichen planus | ||
| OSCC: Oral squamous cell carcinoma | ||
| Prostate |  | BPH: Benign Prostatic Hyperplasia |
| Thyroid | 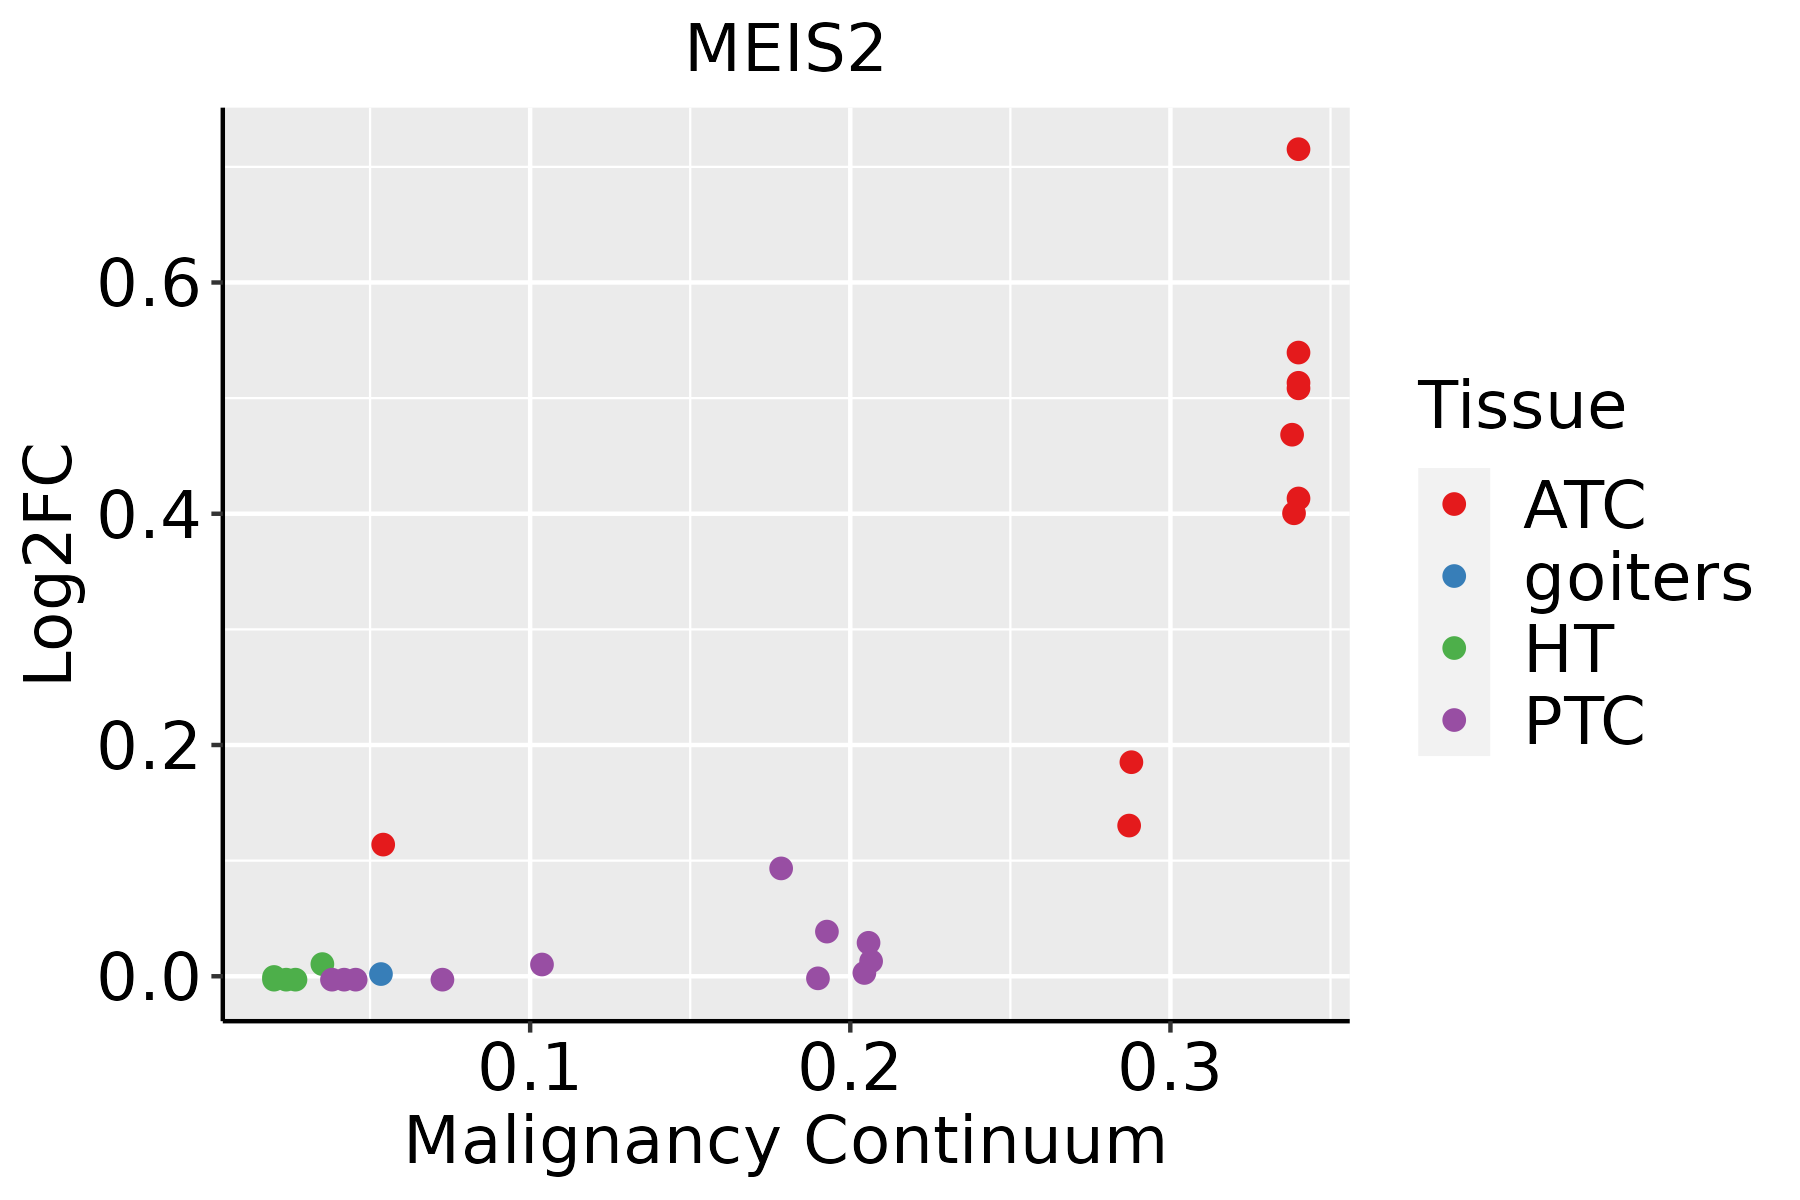 | ATC: Anaplastic thyroid cancer |
| HT: Hashimoto's thyroiditis | ||
| PTC: Papillary thyroid cancer |
| ∗log2FC in expression of this searched gene in stem-like cells from each diseased tissue sample relative to stem-like cells in normal samples in each tissue plotted against the malignancy continuum. Samples are colored based on if they are from different disease stage. |
Top |
Malignant transformation related pathway analysis |
| Find out the enriched GO biological processes and KEGG pathways involved in transition from healthy to precancer to cancer |
| Tissue | Disease Stage | Enriched GO biological Processes |
| Colorectum | AD |  |
| Colorectum | SER |  |
| Colorectum | MSS |  |
| Colorectum | MSI-H |  |
| Colorectum | FAP |  |
| ∗Top 15 enriched GO BP terms are showed in the bar plot of each disease state in each tissue. Each row represents a significant GO biological process which is colored according to the -log10(p.adjust). |
| Page: 1 2 3 4 5 6 7 8 9 |
| GO ID | Tissue | Disease Stage | Description | Gene Ratio | Bg Ratio | pvalue | p.adjust | Count |
| GO:00096128 | Endometrium | AEH | response to mechanical stimulus | 42/2100 | 216/18723 | 2.58e-04 | 3.04e-03 | 42 |
| GO:00457877 | Endometrium | AEH | positive regulation of cell cycle | 56/2100 | 313/18723 | 2.73e-04 | 3.14e-03 | 56 |
| GO:190370614 | Endometrium | AEH | regulation of hemopoiesis | 63/2100 | 367/18723 | 3.81e-04 | 4.10e-03 | 63 |
| GO:004563716 | Endometrium | AEH | regulation of myeloid cell differentiation | 40/2100 | 210/18723 | 5.49e-04 | 5.52e-03 | 40 |
| GO:003009916 | Endometrium | AEH | myeloid cell differentiation | 62/2100 | 381/18723 | 1.67e-03 | 1.36e-02 | 62 |
| GO:000931410 | Endometrium | AEH | response to radiation | 70/2100 | 456/18723 | 3.99e-03 | 2.68e-02 | 70 |
| GO:00459317 | Endometrium | AEH | positive regulation of mitotic cell cycle | 23/2100 | 121/18723 | 7.76e-03 | 4.33e-02 | 23 |
| GO:000961213 | Endometrium | EEC | response to mechanical stimulus | 45/2168 | 216/18723 | 6.17e-05 | 9.28e-04 | 45 |
| GO:190370615 | Endometrium | EEC | regulation of hemopoiesis | 67/2168 | 367/18723 | 1.01e-04 | 1.40e-03 | 67 |
| GO:004578713 | Endometrium | EEC | positive regulation of cell cycle | 59/2168 | 313/18723 | 1.04e-04 | 1.44e-03 | 59 |
| GO:004563717 | Endometrium | EEC | regulation of myeloid cell differentiation | 42/2168 | 210/18723 | 2.72e-04 | 3.09e-03 | 42 |
| GO:003009917 | Endometrium | EEC | myeloid cell differentiation | 64/2168 | 381/18723 | 1.40e-03 | 1.14e-02 | 64 |
| GO:004593113 | Endometrium | EEC | positive regulation of mitotic cell cycle | 25/2168 | 121/18723 | 2.76e-03 | 1.97e-02 | 25 |
| GO:000931413 | Endometrium | EEC | response to radiation | 71/2168 | 456/18723 | 5.69e-03 | 3.42e-02 | 71 |
| GO:00073467 | Endometrium | EEC | regulation of mitotic cell cycle | 70/2168 | 457/18723 | 8.76e-03 | 4.74e-02 | 70 |
| GO:000734615 | Esophagus | ESCC | regulation of mitotic cell cycle | 293/8552 | 457/18723 | 8.00e-16 | 5.64e-14 | 293 |
| GO:000931419 | Esophagus | ESCC | response to radiation | 277/8552 | 456/18723 | 4.42e-11 | 1.43e-09 | 277 |
| GO:004578710 | Esophagus | ESCC | positive regulation of cell cycle | 196/8552 | 313/18723 | 9.27e-10 | 2.24e-08 | 196 |
| GO:0030099111 | Esophagus | ESCC | myeloid cell differentiation | 232/8552 | 381/18723 | 1.22e-09 | 2.90e-08 | 232 |
| GO:004593116 | Esophagus | ESCC | positive regulation of mitotic cell cycle | 83/8552 | 121/18723 | 2.78e-07 | 4.08e-06 | 83 |
| Page: 1 2 3 4 5 6 7 |
| Pathway ID | Tissue | Disease Stage | Description | Gene Ratio | Bg Ratio | pvalue | p.adjust | qvalue | Count |
| Page: 1 |
Top |
Cell-cell communication analysis |
| Identification of potential cell-cell interactions between two cell types and their ligand-receptor pairs for different disease states |
| Ligand | Receptor | LRpair | Pathway | Tissue | Disease Stage |
| Page: 1 |
Top |
Single-cell gene regulatory network inference analysis |
| Find out the significant the regulons (TFs) and the target genes of each regulon across cell types for different disease states |
| TF | Cell Type | Tissue | Disease Stage | Target Gene | RSS | Regulon Activity |
| MEIS2 | MAST | Cervix | ADJ | SPARCL1,AQP1,COL1A1, etc. | 4.19e-01 |  |
| MEIS2 | MAST | Cervix | CC | SPARCL1,AQP1,COL1A1, etc. | 8.27e-02 |  |
| MEIS2 | MAST | Cervix | HSIL_HPV | SPARCL1,AQP1,COL1A1, etc. | 2.89e-01 |  |
| MEIS2 | CAF | Cervix | ADJ | XIST,POLR2J3,MEG8, etc. | 1.55e-01 | |
| MEIS2 | MAST | Colorectum | AD | SLC24A3,KIT,BACE2, etc. | 2.62e-01 |  |
| MEIS2 | MAST | Colorectum | SER | SLC24A3,KIT,BACE2, etc. | 2.19e-01 |  |
| MEIS2 | MYOFIB | Colorectum | Healthy | MEIS1,IGF1R,LRBA, etc. | 6.46e-01 |  |
| MEIS2 | MVA | Colorectum | Healthy | MEIS1,IGF1R,LRBA, etc. | 7.53e-04 | |
| MEIS2 | PCV | Colorectum | Healthy | MEIS1,IGF1R,LRBA, etc. | 1.67e-03 | |
| MEIS2 | MAST | Endometrium | ADJ | MS4A2,RGS13,MLPH, etc. | 3.36e-01 |  |
| ∗The dot plots of a searched regulon are shown for all cell subpopulations in each disease state of each tissue based on the regulon specific score inferred using pySCENIC and by calculating the average expression. |
| Page: 1 2 |
Top |
Somatic mutation of malignant transformation related genes |
| Annotation of somatic variants for genes involved in malignant transformation |
| Hugo Symbol | Variant Class | Variant Classification | dbSNP RS | HGVSc | HGVSp | HGVSp Short | SWISSPROT | BIOTYPE | SIFT | PolyPhen | Tumor Sample Barcode | Tissue | Histology | Sex | Age | Stage | Therapy Types | Drugs | Outcome |
| MEIS2 | SNV | Missense_Mutation | c.91C>T | p.Arg31Trp | p.R31W | O14770 | protein_coding | deleterious(0) | probably_damaging(0.999) | TCGA-AN-A046-01 | Breast | breast invasive carcinoma | Female | >=65 | I/II | Unknown | Unknown | SD | |
| MEIS2 | SNV | Missense_Mutation | c.1246N>T | p.Pro416Ser | p.P416S | O14770 | protein_coding | tolerated_low_confidence(0.27) | benign(0.003) | TCGA-BH-A0AY-01 | Breast | breast invasive carcinoma | Female | <65 | I/II | Chemotherapy | SD | ||
| MEIS2 | SNV | Missense_Mutation | c.211N>A | p.Asp71Asn | p.D71N | O14770 | protein_coding | tolerated(0.06) | probably_damaging(0.999) | TCGA-C8-A27B-01 | Breast | breast invasive carcinoma | Female | <65 | I/II | Chemotherapy | 5-fluorouracil | CR | |
| MEIS2 | SNV | Missense_Mutation | c.245N>A | p.Gly82Glu | p.G82E | O14770 | protein_coding | deleterious(0.04) | possibly_damaging(0.901) | TCGA-D8-A1JA-01 | Breast | breast invasive carcinoma | Female | <65 | III/IV | Chemotherapy | adriamycin | PD | |
| MEIS2 | insertion | In_Frame_Ins | novel | c.644_645insATT | p.Pro215_Ser216insPhe | p.P215_S216insF | O14770 | protein_coding | TCGA-AO-A0JB-01 | Breast | breast invasive carcinoma | Female | <65 | III/IV | Chemotherapy | cyclophosphamide | SD | ||
| MEIS2 | deletion | Frame_Shift_Del | c.1216_1232delNNNNNNNNNNNNNNNNN | p.Ser406AspfsTer69 | p.S406Dfs*69 | O14770 | protein_coding | TCGA-EW-A1PB-01 | Breast | breast invasive carcinoma | Female | >=65 | III/IV | Unknown | Unknown | SD | |||
| MEIS2 | SNV | Missense_Mutation | rs571091781 | c.580N>A | p.Gly194Ser | p.G194S | O14770 | protein_coding | tolerated(0.12) | benign(0.164) | TCGA-2W-A8YY-01 | Cervix | cervical & endocervical cancer | Female | <65 | I/II | Chemotherapy | cisplatin | CR |
| MEIS2 | SNV | Missense_Mutation | novel | c.214N>A | p.Ala72Thr | p.A72T | O14770 | protein_coding | tolerated(0.09) | benign(0.148) | TCGA-2W-A8YY-01 | Cervix | cervical & endocervical cancer | Female | <65 | I/II | Chemotherapy | cisplatin | CR |
| MEIS2 | SNV | Missense_Mutation | rs770033702 | c.617N>T | p.Ser206Phe | p.S206F | O14770 | protein_coding | deleterious(0) | possibly_damaging(0.707) | TCGA-C5-A8YR-01 | Cervix | cervical & endocervical cancer | Female | <65 | I/II | Unknown | Unknown | PD |
| MEIS2 | SNV | Missense_Mutation | c.248N>C | p.His83Pro | p.H83P | O14770 | protein_coding | deleterious(0) | probably_damaging(0.998) | TCGA-FU-A3HZ-01 | Cervix | cervical & endocervical cancer | Female | <65 | I/II | Chemotherapy | cisplatin | CR |
| Page: 1 2 3 4 5 6 7 8 |
Top |
Related drugs of malignant transformation related genes |
| Identification of chemicals and drugs interact with genes involved in malignant transfromation |
| (DGIdb 4.0) |
| Entrez ID | Symbol | Category | Interaction Types | Drug Claim Name | Drug Name | PMIDs |
| Page: 1 |

Copyright 2023-Present -The University of Texas Health Science Center at Houston |