
|
|||||
|
 | |
| |
| |
| |
| |
| |
|
Gene: MEGF9 |
Gene summary for MEGF9 |
| Gene information | Species | Human | Gene symbol | MEGF9 | Gene ID | 1955 |
| Gene name | multiple EGF like domains 9 | |
| Gene Alias | EGFL5 | |
| Cytomap | 9q33.2 | |
| Gene Type | protein-coding | GO ID | GO:0000902 | UniProtAcc | Q9H1U4 |
Top |
Malignant transformation analysis |
| Identification of the aberrant gene expression in precancerous and cancerous lesions by comparing the gene expression of stem-like cells in diseased tissues with normal stem cells |
| Entrez ID | Symbol | Replicates | Species | Organ | Tissue | Adj P-value | Log2FC | Malignancy |
| 1955 | MEGF9 | LZE4T | Human | Esophagus | ESCC | 2.58e-05 | 2.66e-01 | 0.0811 |
| 1955 | MEGF9 | LZE7T | Human | Esophagus | ESCC | 8.94e-04 | 2.39e-01 | 0.0667 |
| 1955 | MEGF9 | LZE20T | Human | Esophagus | ESCC | 6.73e-05 | 9.66e-02 | 0.0662 |
| 1955 | MEGF9 | LZE24T | Human | Esophagus | ESCC | 8.03e-11 | 1.47e-01 | 0.0596 |
| 1955 | MEGF9 | P2T-E | Human | Esophagus | ESCC | 7.12e-23 | 4.18e-01 | 0.1177 |
| 1955 | MEGF9 | P4T-E | Human | Esophagus | ESCC | 3.36e-16 | 2.55e-01 | 0.1323 |
| 1955 | MEGF9 | P5T-E | Human | Esophagus | ESCC | 2.51e-03 | -2.17e-03 | 0.1327 |
| 1955 | MEGF9 | P8T-E | Human | Esophagus | ESCC | 1.65e-03 | 9.38e-02 | 0.0889 |
| 1955 | MEGF9 | P9T-E | Human | Esophagus | ESCC | 2.23e-12 | 2.89e-01 | 0.1131 |
| 1955 | MEGF9 | P10T-E | Human | Esophagus | ESCC | 1.21e-15 | 1.79e-01 | 0.116 |
| 1955 | MEGF9 | P11T-E | Human | Esophagus | ESCC | 1.88e-04 | 2.01e-01 | 0.1426 |
| 1955 | MEGF9 | P12T-E | Human | Esophagus | ESCC | 2.68e-16 | 2.70e-01 | 0.1122 |
| 1955 | MEGF9 | P15T-E | Human | Esophagus | ESCC | 2.99e-10 | 2.92e-01 | 0.1149 |
| 1955 | MEGF9 | P16T-E | Human | Esophagus | ESCC | 8.97e-10 | 1.57e-01 | 0.1153 |
| 1955 | MEGF9 | P20T-E | Human | Esophagus | ESCC | 1.01e-04 | 2.83e-03 | 0.1124 |
| 1955 | MEGF9 | P21T-E | Human | Esophagus | ESCC | 1.39e-04 | 8.46e-02 | 0.1617 |
| 1955 | MEGF9 | P22T-E | Human | Esophagus | ESCC | 3.90e-03 | -1.57e-02 | 0.1236 |
| 1955 | MEGF9 | P23T-E | Human | Esophagus | ESCC | 9.75e-03 | 1.68e-02 | 0.108 |
| 1955 | MEGF9 | P24T-E | Human | Esophagus | ESCC | 8.32e-06 | 2.70e-02 | 0.1287 |
| 1955 | MEGF9 | P26T-E | Human | Esophagus | ESCC | 2.68e-15 | 1.65e-01 | 0.1276 |
| Page: 1 2 3 4 5 |
| Tissue | Expression Dynamics | Abbreviation |
| Esophagus | 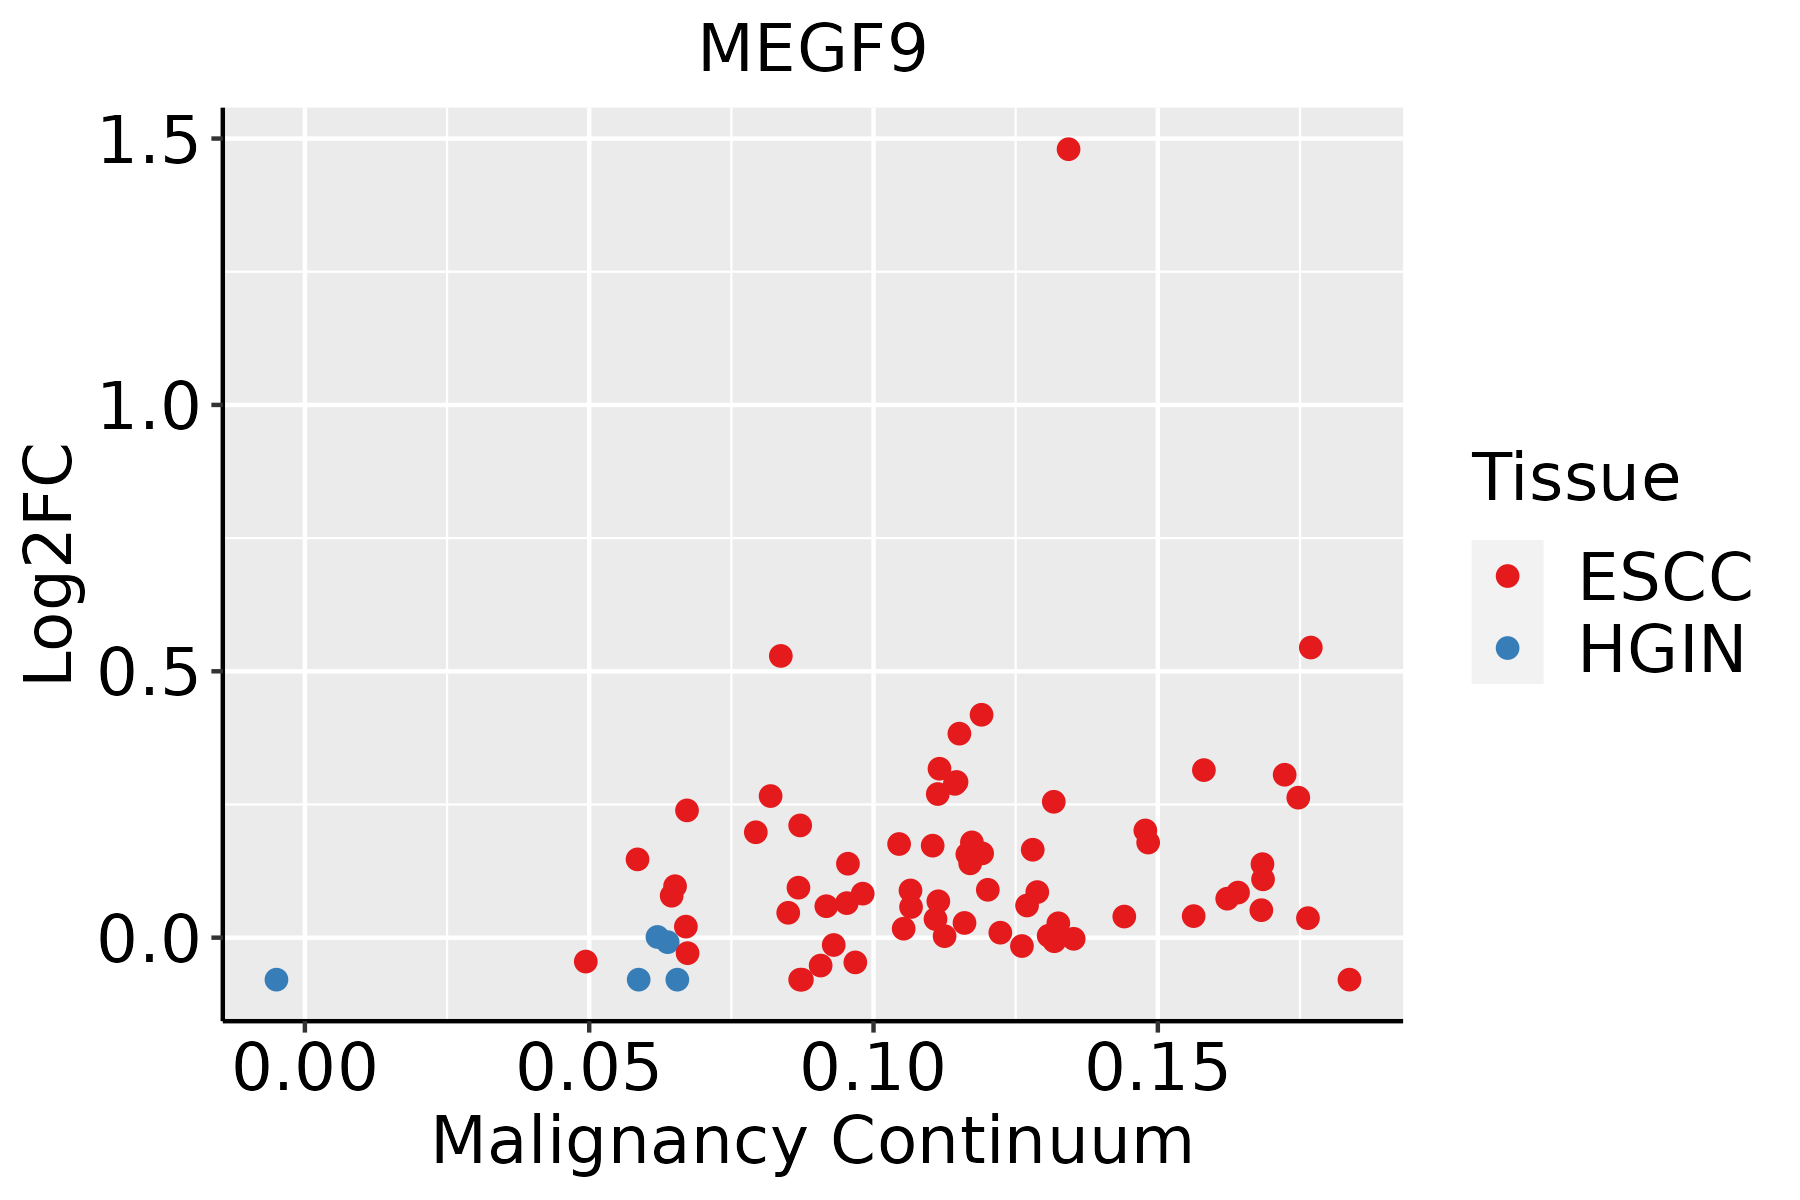 | ESCC: Esophageal squamous cell carcinoma |
| HGIN: High-grade intraepithelial neoplasias | ||
| LGIN: Low-grade intraepithelial neoplasias | ||
| Liver | 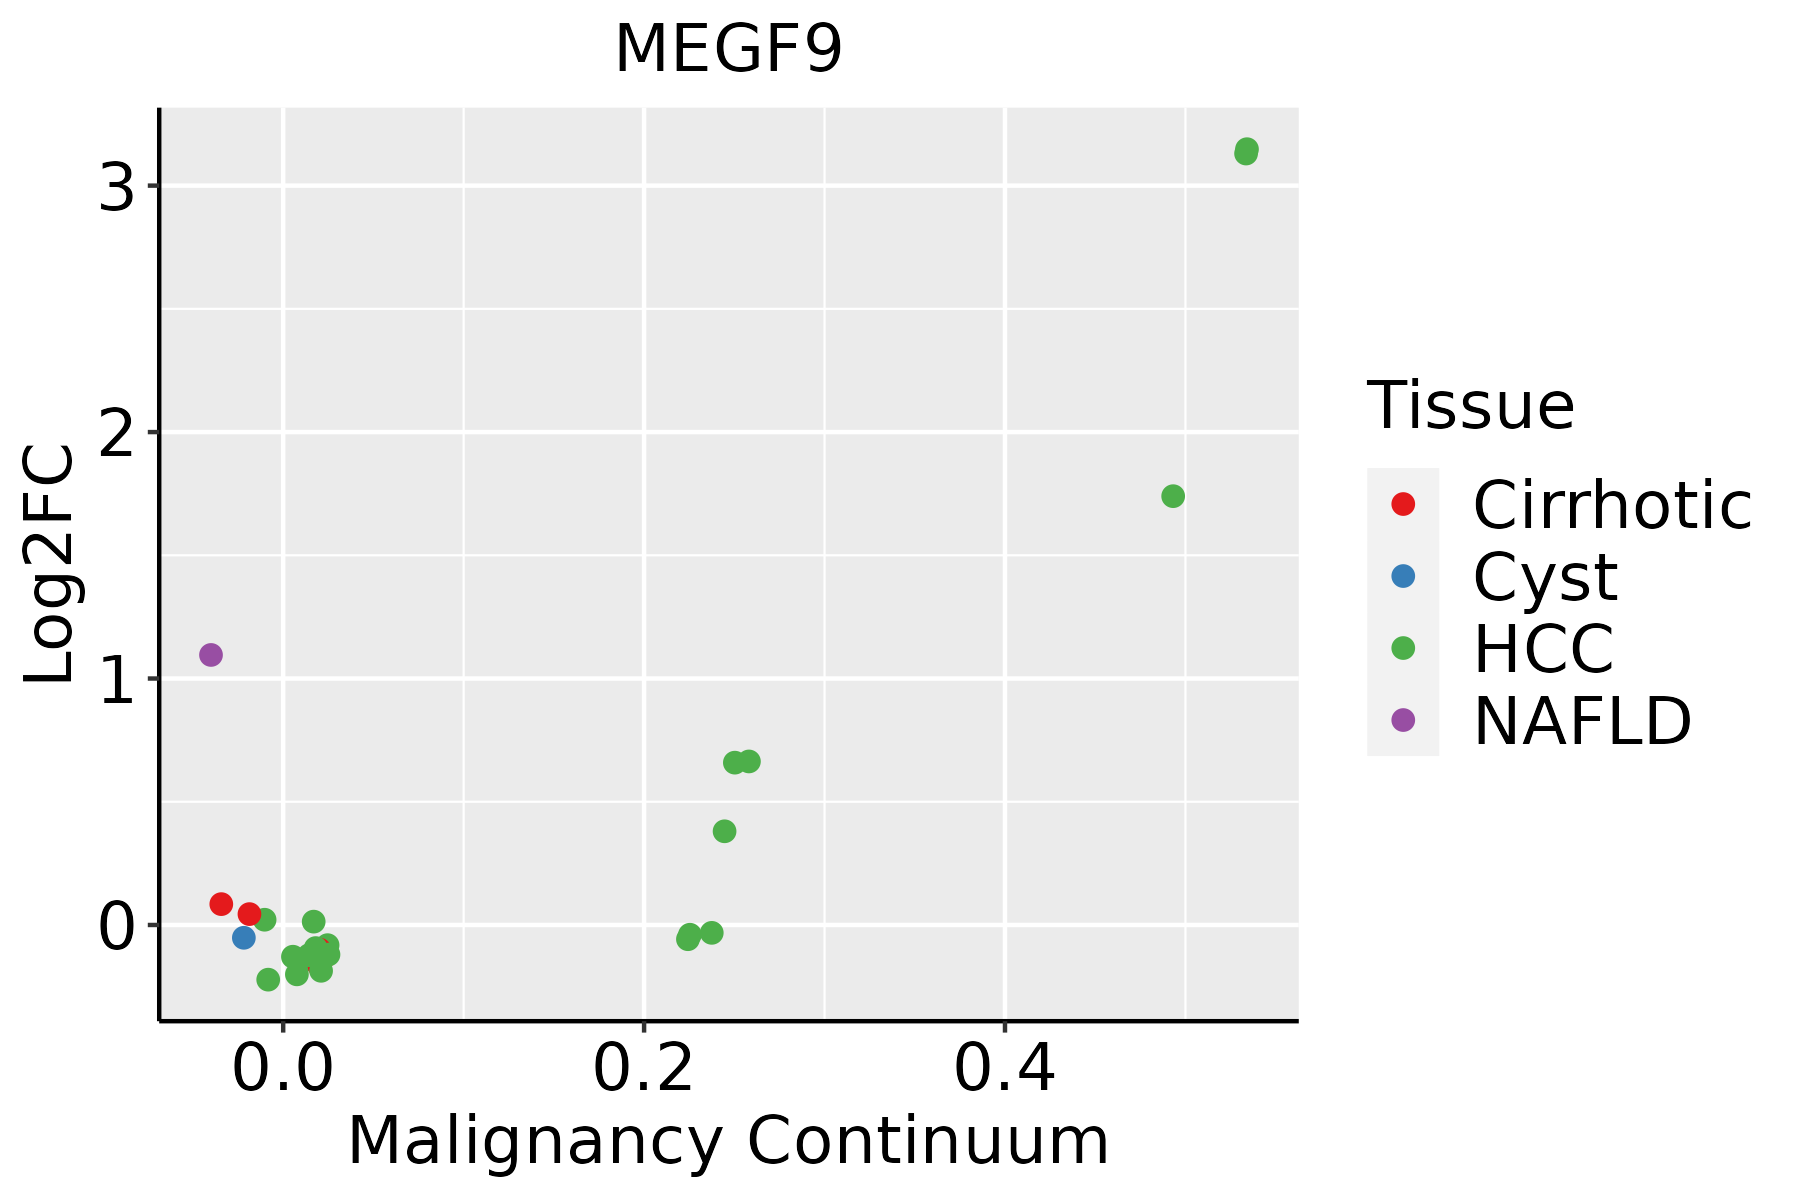 | HCC: Hepatocellular carcinoma |
| NAFLD: Non-alcoholic fatty liver disease | ||
| Lung | 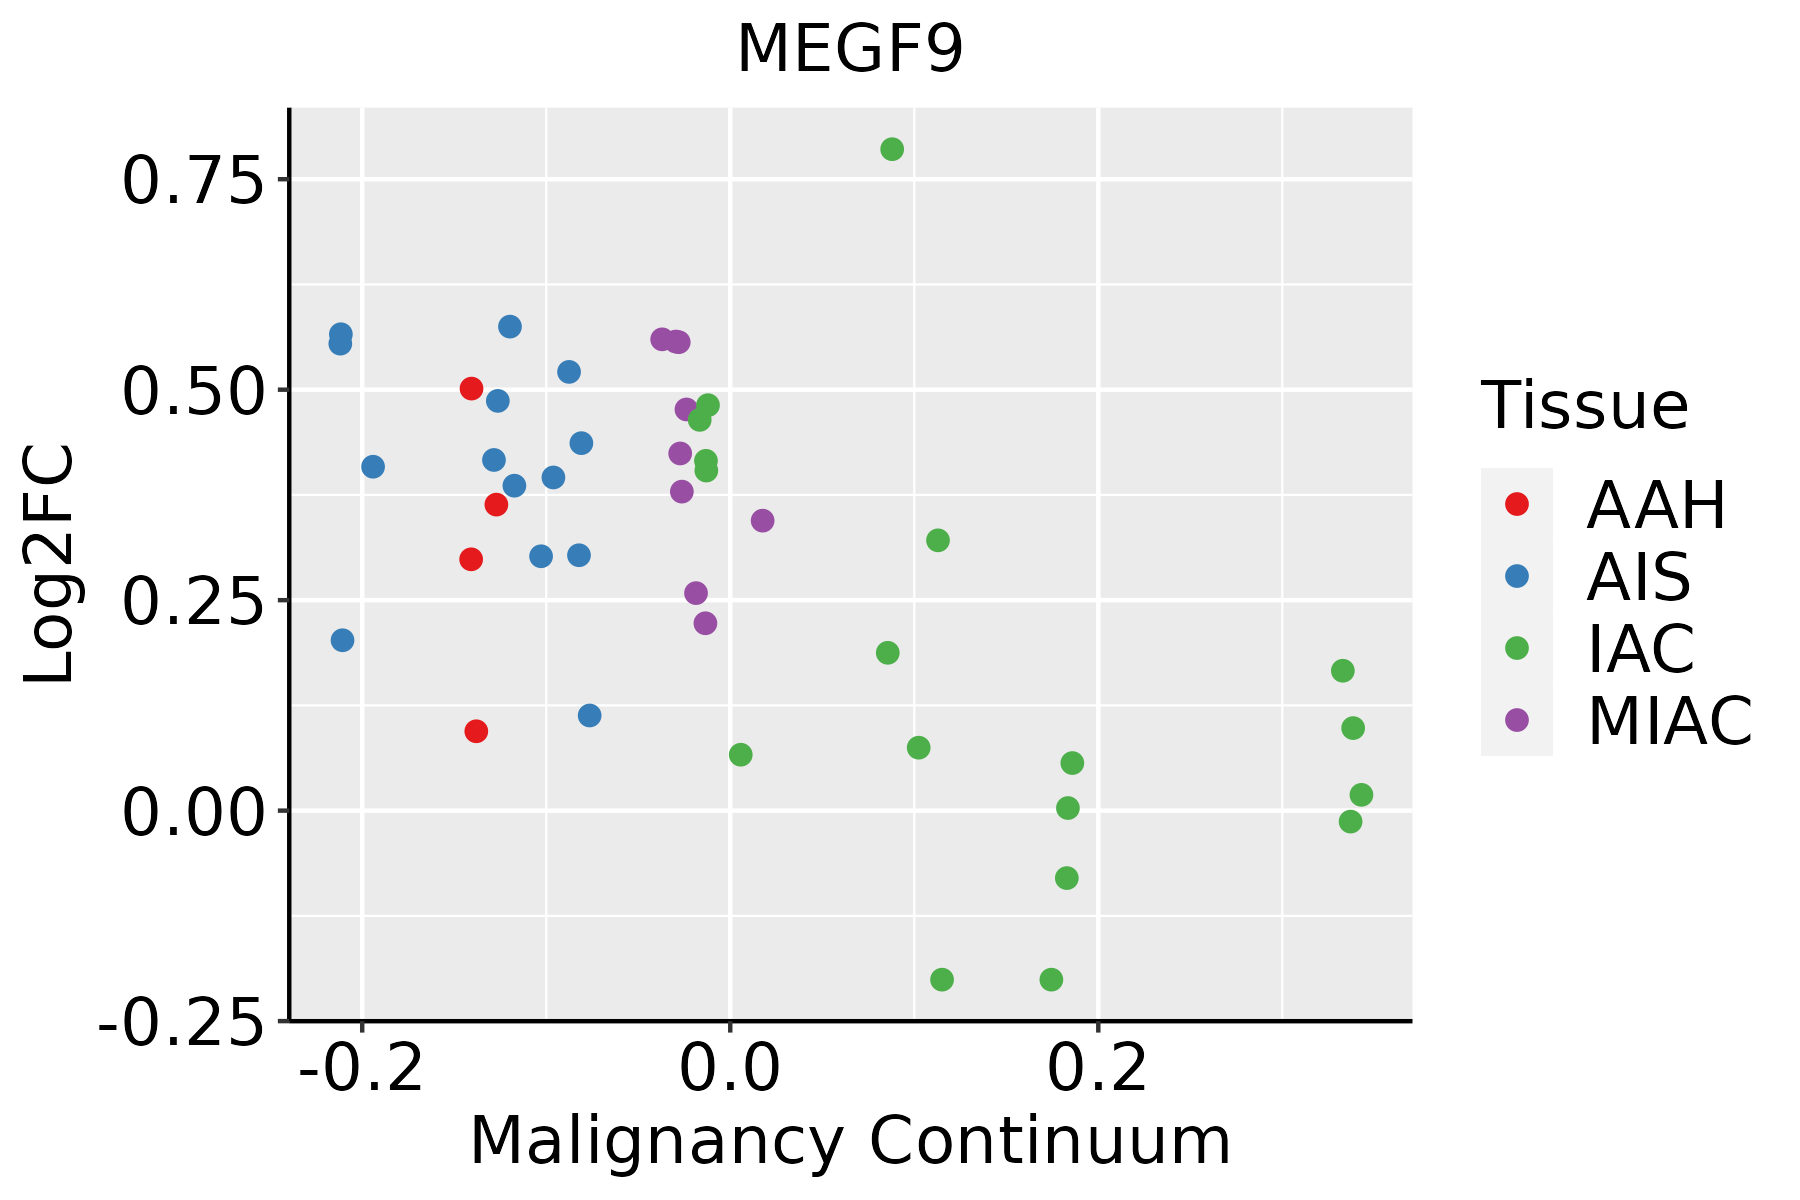 | AAH: Atypical adenomatous hyperplasia |
| AIS: Adenocarcinoma in situ | ||
| IAC: Invasive lung adenocarcinoma | ||
| MIA: Minimally invasive adenocarcinoma | ||
| Thyroid | 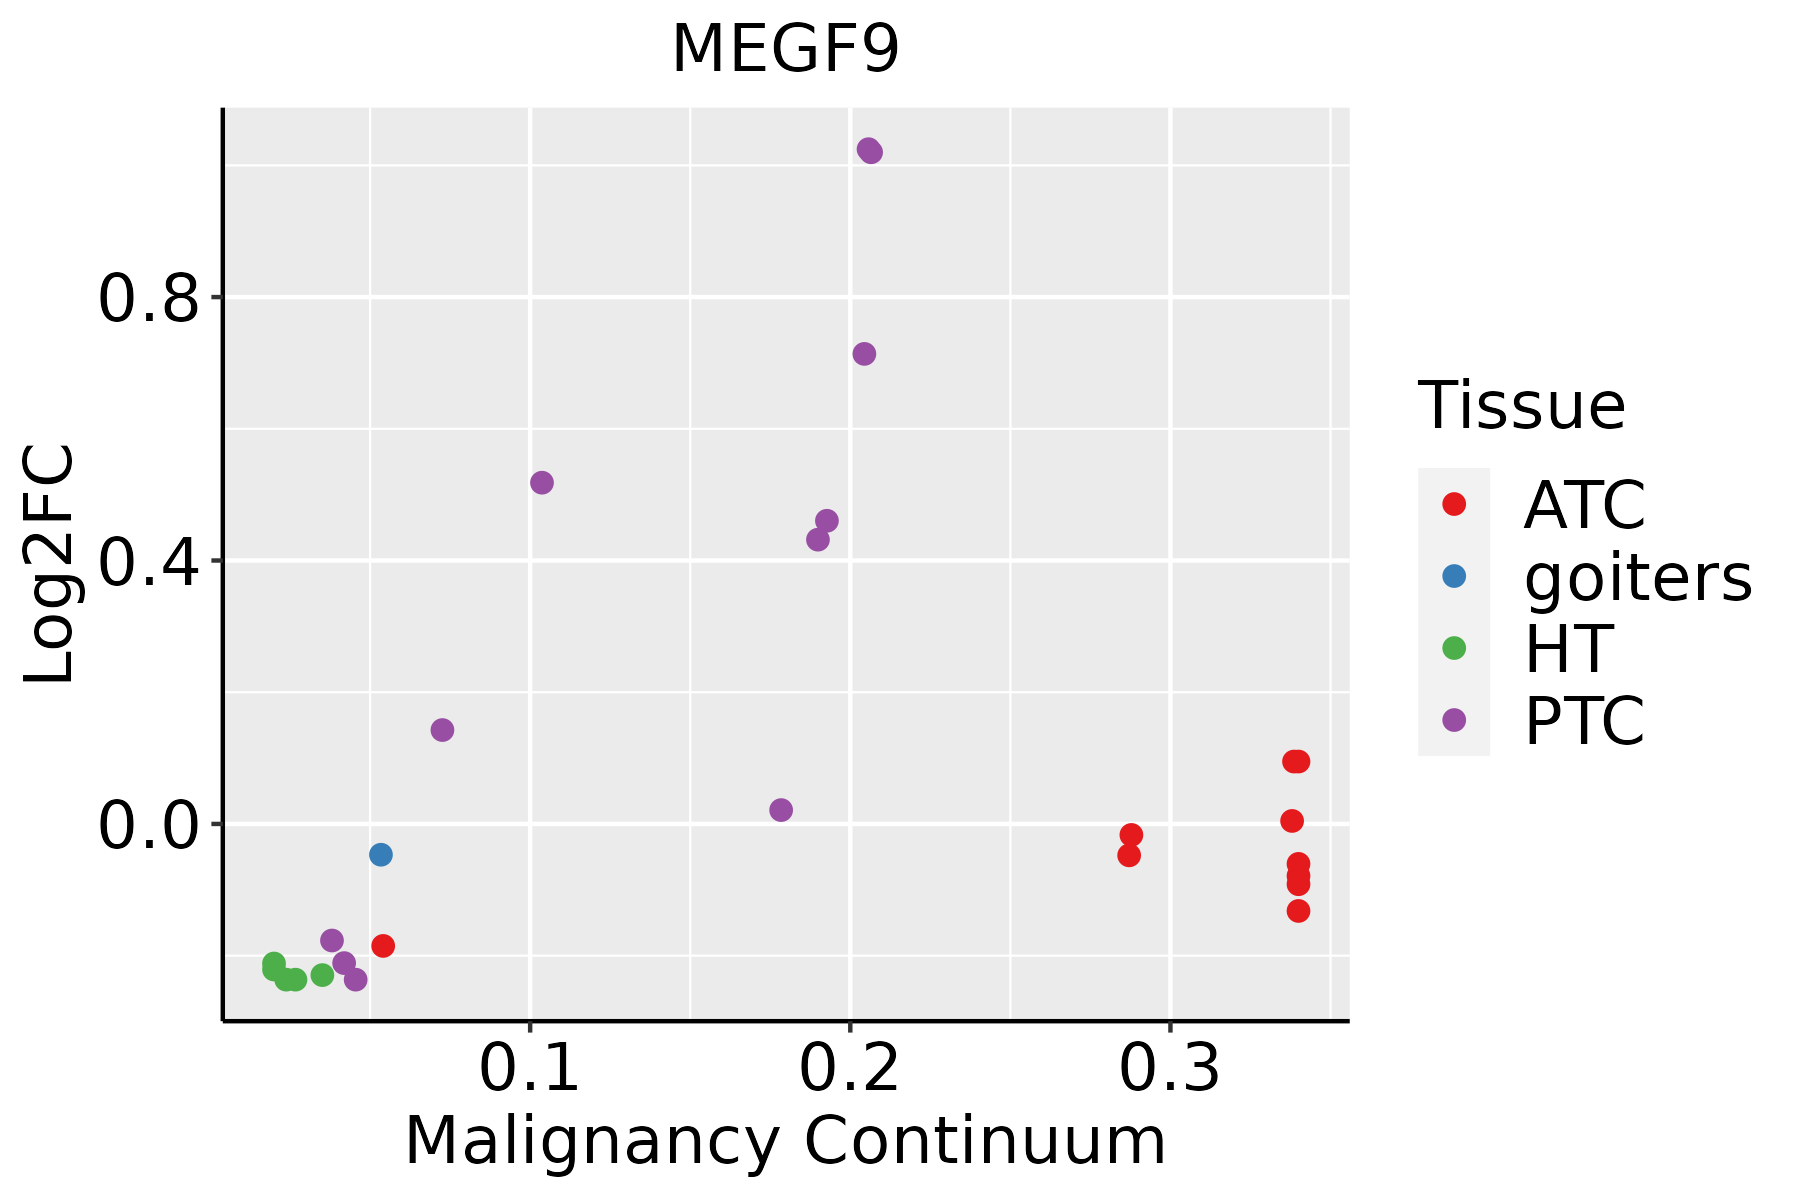 | ATC: Anaplastic thyroid cancer |
| HT: Hashimoto's thyroiditis | ||
| PTC: Papillary thyroid cancer |
| ∗log2FC in expression of this searched gene in stem-like cells from each diseased tissue sample relative to stem-like cells in normal samples in each tissue plotted against the malignancy continuum. Samples are colored based on if they are from different disease stage. |
Top |
Malignant transformation related pathway analysis |
| Find out the enriched GO biological processes and KEGG pathways involved in transition from healthy to precancer to cancer |
| Tissue | Disease Stage | Enriched GO biological Processes |
| Colorectum | AD |  |
| Colorectum | SER |  |
| Colorectum | MSS |  |
| Colorectum | MSI-H |  |
| Colorectum | FAP |  |
| ∗Top 15 enriched GO BP terms are showed in the bar plot of each disease state in each tissue. Each row represents a significant GO biological process which is colored according to the -log10(p.adjust). |
| Page: 1 2 3 4 5 6 7 8 9 |
| GO ID | Tissue | Disease Stage | Description | Gene Ratio | Bg Ratio | pvalue | p.adjust | Count |
| GO:003158919 | Esophagus | ESCC | cell-substrate adhesion | 221/8552 | 363/18723 | 3.06e-09 | 6.62e-08 | 221 |
| GO:003444620 | Esophagus | ESCC | substrate adhesion-dependent cell spreading | 65/8552 | 108/18723 | 1.67e-03 | 7.72e-03 | 65 |
| GO:00315896 | Liver | NAFLD | cell-substrate adhesion | 65/1882 | 363/18723 | 2.84e-06 | 1.18e-04 | 65 |
| GO:00344467 | Liver | NAFLD | substrate adhesion-dependent cell spreading | 25/1882 | 108/18723 | 5.41e-05 | 1.23e-03 | 25 |
| GO:003158912 | Liver | Cirrhotic | cell-substrate adhesion | 128/4634 | 363/18723 | 4.10e-06 | 6.90e-05 | 128 |
| GO:003444612 | Liver | Cirrhotic | substrate adhesion-dependent cell spreading | 47/4634 | 108/18723 | 1.48e-05 | 2.05e-04 | 47 |
| GO:003444622 | Liver | HCC | substrate adhesion-dependent cell spreading | 67/7958 | 108/18723 | 3.24e-05 | 3.28e-04 | 67 |
| GO:003158922 | Liver | HCC | cell-substrate adhesion | 188/7958 | 363/18723 | 2.00e-04 | 1.55e-03 | 188 |
| GO:00315897 | Lung | IAC | cell-substrate adhesion | 85/2061 | 363/18723 | 8.57e-12 | 4.27e-09 | 85 |
| GO:00344468 | Lung | IAC | substrate adhesion-dependent cell spreading | 21/2061 | 108/18723 | 6.67e-03 | 4.67e-02 | 21 |
| GO:003158913 | Lung | AIS | cell-substrate adhesion | 80/1849 | 363/18723 | 3.80e-12 | 3.16e-09 | 80 |
| GO:003444613 | Lung | AIS | substrate adhesion-dependent cell spreading | 21/1849 | 108/18723 | 1.86e-03 | 2.07e-02 | 21 |
| GO:003444625 | Thyroid | HT | substrate adhesion-dependent cell spreading | 19/1272 | 108/18723 | 1.12e-04 | 1.84e-03 | 19 |
| GO:003158927 | Thyroid | HT | cell-substrate adhesion | 41/1272 | 363/18723 | 9.54e-04 | 9.83e-03 | 41 |
| GO:0031589111 | Thyroid | PTC | cell-substrate adhesion | 169/5968 | 363/18723 | 2.73e-09 | 7.57e-08 | 169 |
| GO:0034446111 | Thyroid | PTC | substrate adhesion-dependent cell spreading | 58/5968 | 108/18723 | 2.07e-06 | 2.82e-05 | 58 |
| GO:003158928 | Thyroid | ATC | cell-substrate adhesion | 195/6293 | 363/18723 | 1.58e-15 | 1.17e-13 | 195 |
| GO:003444634 | Thyroid | ATC | substrate adhesion-dependent cell spreading | 64/6293 | 108/18723 | 3.98e-08 | 7.31e-07 | 64 |
| Page: 1 |
| Pathway ID | Tissue | Disease Stage | Description | Gene Ratio | Bg Ratio | pvalue | p.adjust | qvalue | Count |
| Page: 1 |
Top |
Cell-cell communication analysis |
| Identification of potential cell-cell interactions between two cell types and their ligand-receptor pairs for different disease states |
| Ligand | Receptor | LRpair | Pathway | Tissue | Disease Stage |
| Page: 1 |
Top |
Single-cell gene regulatory network inference analysis |
| Find out the significant the regulons (TFs) and the target genes of each regulon across cell types for different disease states |
| TF | Cell Type | Tissue | Disease Stage | Target Gene | RSS | Regulon Activity |
| ∗The dot plots of a searched regulon are shown for all cell subpopulations in each disease state of each tissue based on the regulon specific score inferred using pySCENIC and by calculating the average expression. |
| Page: 1 |
Top |
Somatic mutation of malignant transformation related genes |
| Annotation of somatic variants for genes involved in malignant transformation |
| Hugo Symbol | Variant Class | Variant Classification | dbSNP RS | HGVSc | HGVSp | HGVSp Short | SWISSPROT | BIOTYPE | SIFT | PolyPhen | Tumor Sample Barcode | Tissue | Histology | Sex | Age | Stage | Therapy Types | Drugs | Outcome |
| MEGF9 | SNV | Missense_Mutation | novel | c.1330N>A | p.Asp444Asn | p.D444N | Q9H1U4 | protein_coding | tolerated(0.1) | probably_damaging(0.978) | TCGA-AN-A046-01 | Breast | breast invasive carcinoma | Female | >=65 | I/II | Unknown | Unknown | SD |
| MEGF9 | SNV | Missense_Mutation | rs375707223 | c.416N>T | p.Ala139Val | p.A139V | Q9H1U4 | protein_coding | tolerated_low_confidence(0.2) | benign(0) | TCGA-BH-A1ET-01 | Breast | breast invasive carcinoma | Female | <65 | I/II | Unknown | Unknown | SD |
| MEGF9 | SNV | Missense_Mutation | c.415N>T | p.Ala139Ser | p.A139S | Q9H1U4 | protein_coding | tolerated_low_confidence(0.28) | benign(0.003) | TCGA-BH-A1ET-01 | Breast | breast invasive carcinoma | Female | <65 | I/II | Unknown | Unknown | SD | |
| MEGF9 | SNV | Missense_Mutation | c.1042N>T | p.Arg348Cys | p.R348C | Q9H1U4 | protein_coding | deleterious(0.03) | possibly_damaging(0.72) | TCGA-D8-A27G-01 | Breast | breast invasive carcinoma | Female | >=65 | I/II | Unknown | Unknown | SD | |
| MEGF9 | insertion | Nonsense_Mutation | novel | c.1287_1288insTAAATTATAAAGTAGCTGTAATCT | p.Thr429_Thr430insTer | p.T429_T430ins* | Q9H1U4 | protein_coding | TCGA-A8-A09E-01 | Breast | breast invasive carcinoma | Female | >=65 | III/IV | Hormone Therapy | anastrozole | SD | ||
| MEGF9 | SNV | Missense_Mutation | c.1000N>A | p.Glu334Lys | p.E334K | Q9H1U4 | protein_coding | tolerated(0.09) | benign(0.322) | TCGA-JW-A5VK-01 | Cervix | cervical & endocervical cancer | Female | <65 | I/II | Unknown | Unknown | SD | |
| MEGF9 | SNV | Missense_Mutation | rs756950624 | c.679N>T | p.Arg227Trp | p.R227W | Q9H1U4 | protein_coding | deleterious(0.04) | benign(0.326) | TCGA-AA-3510-01 | Colorectum | colon adenocarcinoma | Male | >=65 | I/II | Unknown | Unknown | SD |
| MEGF9 | SNV | Missense_Mutation | rs768882300 | c.854G>A | p.Arg285Gln | p.R285Q | Q9H1U4 | protein_coding | tolerated(0.96) | benign(0.003) | TCGA-AA-3984-01 | Colorectum | colon adenocarcinoma | Female | <65 | I/II | Unknown | Unknown | SD |
| MEGF9 | SNV | Missense_Mutation | c.1691N>T | p.Ser564Ile | p.S564I | Q9H1U4 | protein_coding | deleterious(0) | probably_damaging(0.997) | TCGA-AZ-6601-01 | Colorectum | colon adenocarcinoma | Male | >=65 | I/II | Unknown | Unknown | PD | |
| MEGF9 | SNV | Missense_Mutation | novel | c.1660G>A | p.Glu554Lys | p.E554K | Q9H1U4 | protein_coding | deleterious(0) | probably_damaging(0.996) | TCGA-CA-6717-01 | Colorectum | colon adenocarcinoma | Male | <65 | I/II | Chemotherapy | oxaliplatin | CR |
| Page: 1 2 3 4 5 6 |
Top |
Related drugs of malignant transformation related genes |
| Identification of chemicals and drugs interact with genes involved in malignant transfromation |
| (DGIdb 4.0) |
| Entrez ID | Symbol | Category | Interaction Types | Drug Claim Name | Drug Name | PMIDs |
| Page: 1 |

Copyright 2023-Present -The University of Texas Health Science Center at Houston |