
|
|||||
|
 | |
| |
| |
| |
| |
| |
|
Gene: MEGF8 |
Gene summary for MEGF8 |
| Gene information | Species | Human | Gene symbol | MEGF8 | Gene ID | 1954 |
| Gene name | multiple EGF like domains 8 | |
| Gene Alias | C19orf49 | |
| Cytomap | 19q13.2 | |
| Gene Type | protein-coding | GO ID | GO:0000902 | UniProtAcc | Q7Z7M0 |
Top |
Malignant transformation analysis |
| Identification of the aberrant gene expression in precancerous and cancerous lesions by comparing the gene expression of stem-like cells in diseased tissues with normal stem cells |
| Entrez ID | Symbol | Replicates | Species | Organ | Tissue | Adj P-value | Log2FC | Malignancy |
| 1954 | MEGF8 | HCC1_Meng | Human | Liver | HCC | 7.02e-23 | 2.55e-02 | 0.0246 |
| 1954 | MEGF8 | HCC2_Meng | Human | Liver | HCC | 3.54e-02 | 9.01e-06 | 0.0107 |
| 1954 | MEGF8 | HCC1 | Human | Liver | HCC | 2.48e-09 | 2.53e+00 | 0.5336 |
| 1954 | MEGF8 | HCC2 | Human | Liver | HCC | 1.57e-13 | 2.72e+00 | 0.5341 |
| 1954 | MEGF8 | HCC5 | Human | Liver | HCC | 3.91e-04 | 8.89e-01 | 0.4932 |
| 1954 | MEGF8 | S014 | Human | Liver | HCC | 4.40e-09 | 4.12e-01 | 0.2254 |
| 1954 | MEGF8 | S015 | Human | Liver | HCC | 1.61e-21 | 8.15e-01 | 0.2375 |
| 1954 | MEGF8 | S016 | Human | Liver | HCC | 4.94e-11 | 4.50e-01 | 0.2243 |
| 1954 | MEGF8 | S028 | Human | Liver | HCC | 1.19e-09 | 4.85e-01 | 0.2503 |
| 1954 | MEGF8 | S029 | Human | Liver | HCC | 2.22e-11 | 4.61e-01 | 0.2581 |
| 1954 | MEGF8 | male-WTA | Human | Thyroid | PTC | 3.78e-20 | 2.42e-01 | 0.1037 |
| 1954 | MEGF8 | PTC01 | Human | Thyroid | PTC | 5.23e-05 | 6.77e-02 | 0.1899 |
| 1954 | MEGF8 | PTC04 | Human | Thyroid | PTC | 6.15e-09 | 1.14e-01 | 0.1927 |
| 1954 | MEGF8 | PTC05 | Human | Thyroid | PTC | 1.20e-02 | 2.31e-01 | 0.2065 |
| 1954 | MEGF8 | PTC06 | Human | Thyroid | PTC | 3.93e-20 | 3.90e-01 | 0.2057 |
| 1954 | MEGF8 | PTC07 | Human | Thyroid | PTC | 1.77e-17 | 2.10e-01 | 0.2044 |
| 1954 | MEGF8 | ATC12 | Human | Thyroid | ATC | 1.90e-02 | 4.23e-02 | 0.34 |
| 1954 | MEGF8 | ATC13 | Human | Thyroid | ATC | 1.26e-73 | 1.35e+00 | 0.34 |
| 1954 | MEGF8 | ATC2 | Human | Thyroid | ATC | 5.15e-07 | 6.73e-01 | 0.34 |
| 1954 | MEGF8 | ATC4 | Human | Thyroid | ATC | 1.15e-03 | 6.48e-02 | 0.34 |
| Page: 1 2 |
| Tissue | Expression Dynamics | Abbreviation |
| Liver |  | HCC: Hepatocellular carcinoma |
| NAFLD: Non-alcoholic fatty liver disease | ||
| Thyroid | 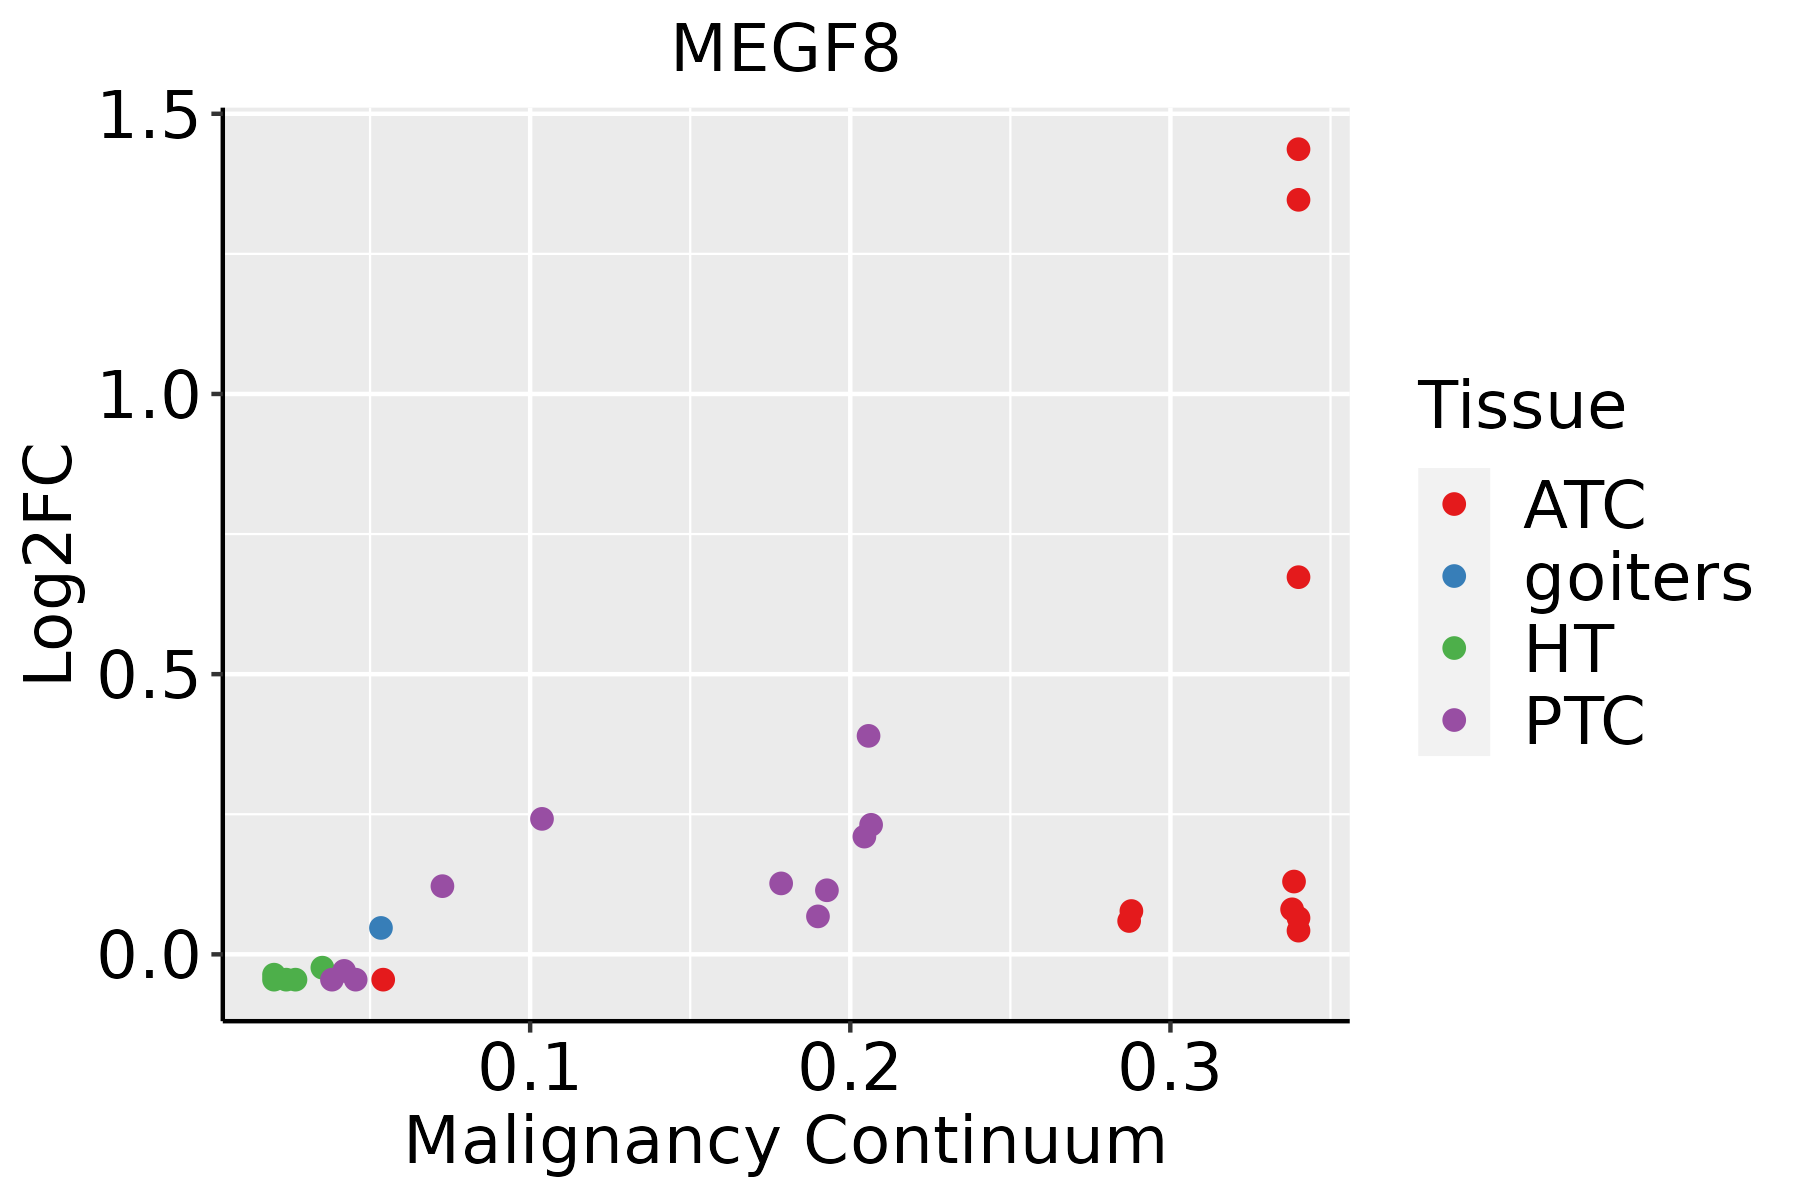 | ATC: Anaplastic thyroid cancer |
| HT: Hashimoto's thyroiditis | ||
| PTC: Papillary thyroid cancer |
| ∗log2FC in expression of this searched gene in stem-like cells from each diseased tissue sample relative to stem-like cells in normal samples in each tissue plotted against the malignancy continuum. Samples are colored based on if they are from different disease stage. |
Top |
Malignant transformation related pathway analysis |
| Find out the enriched GO biological processes and KEGG pathways involved in transition from healthy to precancer to cancer |
| Tissue | Disease Stage | Enriched GO biological Processes |
| Colorectum | AD |  |
| Colorectum | SER |  |
| Colorectum | MSS |  |
| Colorectum | MSI-H |  |
| Colorectum | FAP |  |
| ∗Top 15 enriched GO BP terms are showed in the bar plot of each disease state in each tissue. Each row represents a significant GO biological process which is colored according to the -log10(p.adjust). |
| Page: 1 2 3 4 5 6 7 8 9 |
| GO ID | Tissue | Disease Stage | Description | Gene Ratio | Bg Ratio | pvalue | p.adjust | Count |
| GO:001604921 | Liver | HCC | cell growth | 269/7958 | 482/18723 | 1.84e-09 | 5.35e-08 | 269 |
| GO:003253522 | Liver | HCC | regulation of cellular component size | 217/7958 | 383/18723 | 1.28e-08 | 3.14e-07 | 217 |
| GO:000155821 | Liver | HCC | regulation of cell growth | 228/7958 | 414/18723 | 1.34e-07 | 2.55e-06 | 228 |
| GO:003134611 | Liver | HCC | positive regulation of cell projection organization | 193/7958 | 353/18723 | 2.28e-06 | 3.08e-05 | 193 |
| GO:001072011 | Liver | HCC | positive regulation of cell development | 155/7958 | 298/18723 | 5.39e-04 | 3.48e-03 | 155 |
| GO:006056011 | Liver | HCC | developmental growth involved in morphogenesis | 124/7958 | 234/18723 | 7.37e-04 | 4.47e-03 | 124 |
| GO:001097511 | Liver | HCC | regulation of neuron projection development | 220/7958 | 445/18723 | 1.68e-03 | 8.78e-03 | 220 |
| GO:004867511 | Liver | HCC | axon extension | 67/7958 | 120/18723 | 2.17e-03 | 1.09e-02 | 67 |
| GO:199013811 | Liver | HCC | neuron projection extension | 92/7958 | 172/18723 | 2.31e-03 | 1.14e-02 | 92 |
| GO:004858811 | Liver | HCC | developmental cell growth | 121/7958 | 234/18723 | 2.68e-03 | 1.28e-02 | 121 |
| GO:00507674 | Liver | HCC | regulation of neurogenesis | 181/7958 | 364/18723 | 3.00e-03 | 1.40e-02 | 181 |
| GO:004577321 | Liver | HCC | positive regulation of axon extension | 27/7958 | 42/18723 | 3.60e-03 | 1.60e-02 | 27 |
| GO:00507693 | Liver | HCC | positive regulation of neurogenesis | 116/7958 | 225/18723 | 3.67e-03 | 1.63e-02 | 116 |
| GO:003030711 | Liver | HCC | positive regulation of cell growth | 88/7958 | 166/18723 | 3.95e-03 | 1.74e-02 | 88 |
| GO:00083614 | Liver | HCC | regulation of cell size | 95/7958 | 181/18723 | 4.15e-03 | 1.81e-02 | 95 |
| GO:00305164 | Liver | HCC | regulation of axon extension | 52/7958 | 95/18723 | 1.07e-02 | 3.97e-02 | 52 |
| GO:000166721 | Liver | HCC | ameboidal-type cell migration | 226/7958 | 475/18723 | 1.35e-02 | 4.81e-02 | 226 |
| GO:004592711 | Liver | HCC | positive regulation of growth | 128/7958 | 259/18723 | 1.41e-02 | 4.99e-02 | 128 |
| GO:0016049112 | Thyroid | PTC | cell growth | 225/5968 | 482/18723 | 4.75e-12 | 2.07e-10 | 225 |
| GO:0031346110 | Thyroid | PTC | positive regulation of cell projection organization | 173/5968 | 353/18723 | 1.09e-11 | 4.40e-10 | 173 |
| Page: 1 2 3 4 5 6 |
| Pathway ID | Tissue | Disease Stage | Description | Gene Ratio | Bg Ratio | pvalue | p.adjust | qvalue | Count |
| Page: 1 |
Top |
Cell-cell communication analysis |
| Identification of potential cell-cell interactions between two cell types and their ligand-receptor pairs for different disease states |
| Ligand | Receptor | LRpair | Pathway | Tissue | Disease Stage |
| Page: 1 |
Top |
Single-cell gene regulatory network inference analysis |
| Find out the significant the regulons (TFs) and the target genes of each regulon across cell types for different disease states |
| TF | Cell Type | Tissue | Disease Stage | Target Gene | RSS | Regulon Activity |
| ∗The dot plots of a searched regulon are shown for all cell subpopulations in each disease state of each tissue based on the regulon specific score inferred using pySCENIC and by calculating the average expression. |
| Page: 1 |
Top |
Somatic mutation of malignant transformation related genes |
| Annotation of somatic variants for genes involved in malignant transformation |
| Hugo Symbol | Variant Class | Variant Classification | dbSNP RS | HGVSc | HGVSp | HGVSp Short | SWISSPROT | BIOTYPE | SIFT | PolyPhen | Tumor Sample Barcode | Tissue | Histology | Sex | Age | Stage | Therapy Types | Drugs | Outcome |
| MEGF8 | SNV | Missense_Mutation | c.4777N>T | p.Thr1593Ser | p.T1593S | Q7Z7M0 | protein_coding | tolerated(0.74) | benign(0.005) | TCGA-A2-A04R-01 | Breast | breast invasive carcinoma | Female | <65 | I/II | Chemotherapy | taxol | SD | |
| MEGF8 | SNV | Missense_Mutation | novel | c.3235N>T | p.Arg1079Cys | p.R1079C | Q7Z7M0 | protein_coding | deleterious(0.01) | probably_damaging(0.998) | TCGA-A2-A0T1-01 | Breast | breast invasive carcinoma | Female | <65 | III/IV | Targeted Molecular therapy | herceptin | SD |
| MEGF8 | SNV | Missense_Mutation | novel | c.6919C>A | p.Arg2307Ser | p.R2307S | Q7Z7M0 | protein_coding | tolerated(0.1) | possibly_damaging(0.77) | TCGA-A8-A07F-01 | Breast | breast invasive carcinoma | Female | >=65 | I/II | Hormone Therapy | tamoxiphen | SD |
| MEGF8 | SNV | Missense_Mutation | rs760533124 | c.1573N>A | p.Val525Ile | p.V525I | Q7Z7M0 | protein_coding | tolerated(0.18) | benign(0.106) | TCGA-A8-A09Q-01 | Breast | breast invasive carcinoma | Female | >=65 | III/IV | Hormone Therapy | anastrozole | SD |
| MEGF8 | SNV | Missense_Mutation | novel | c.3763N>A | p.Ala1255Thr | p.A1255T | Q7Z7M0 | protein_coding | tolerated(0.08) | possibly_damaging(0.446) | TCGA-AC-A2QI-01 | Breast | breast invasive carcinoma | Female | >=65 | III/IV | Chemotherapy | cytoxan | CR |
| MEGF8 | SNV | Missense_Mutation | novel | c.7159N>A | p.Asp2387Asn | p.D2387N | Q7Z7M0 | protein_coding | tolerated(0.21) | probably_damaging(0.989) | TCGA-AC-A5XU-01 | Breast | breast invasive carcinoma | Female | >=65 | I/II | Hormone Therapy | letrozole | SD |
| MEGF8 | SNV | Missense_Mutation | c.4009N>G | p.Thr1337Ala | p.T1337A | Q7Z7M0 | protein_coding | tolerated(0.13) | possibly_damaging(0.554) | TCGA-AN-A0FF-01 | Breast | breast invasive carcinoma | Female | <65 | I/II | Unknown | Unknown | SD | |
| MEGF8 | SNV | Missense_Mutation | rs758529363 | c.1603C>T | p.Arg535Trp | p.R535W | Q7Z7M0 | protein_coding | tolerated(0.19) | possibly_damaging(0.676) | TCGA-AR-A250-01 | Breast | breast invasive carcinoma | Female | <65 | I/II | Chemotherapy | doxorubicin | SD |
| MEGF8 | SNV | Missense_Mutation | c.6002N>C | p.Cys2001Ser | p.C2001S | Q7Z7M0 | protein_coding | deleterious(0) | probably_damaging(0.991) | TCGA-BH-A0BZ-01 | Breast | breast invasive carcinoma | Female | <65 | III/IV | Chemotherapy | doxorubicin | CR | |
| MEGF8 | SNV | Missense_Mutation | rs748260455 | c.7826N>T | p.Ser2609Leu | p.S2609L | Q7Z7M0 | protein_coding | deleterious(0.01) | possibly_damaging(0.692) | TCGA-BH-A0BZ-01 | Breast | breast invasive carcinoma | Female | <65 | III/IV | Chemotherapy | doxorubicin | CR |
| Page: 1 2 3 4 5 6 7 8 9 10 11 12 13 14 15 16 17 18 19 20 21 22 23 24 25 26 27 |
Top |
Related drugs of malignant transformation related genes |
| Identification of chemicals and drugs interact with genes involved in malignant transfromation |
| (DGIdb 4.0) |
| Entrez ID | Symbol | Category | Interaction Types | Drug Claim Name | Drug Name | PMIDs |
| Page: 1 |

Copyright 2023-Present -The University of Texas Health Science Center at Houston |