| Entrez ID | Symbol | Replicates | Species | Organ | Tissue | Adj P-value | Log2FC | Malignancy |
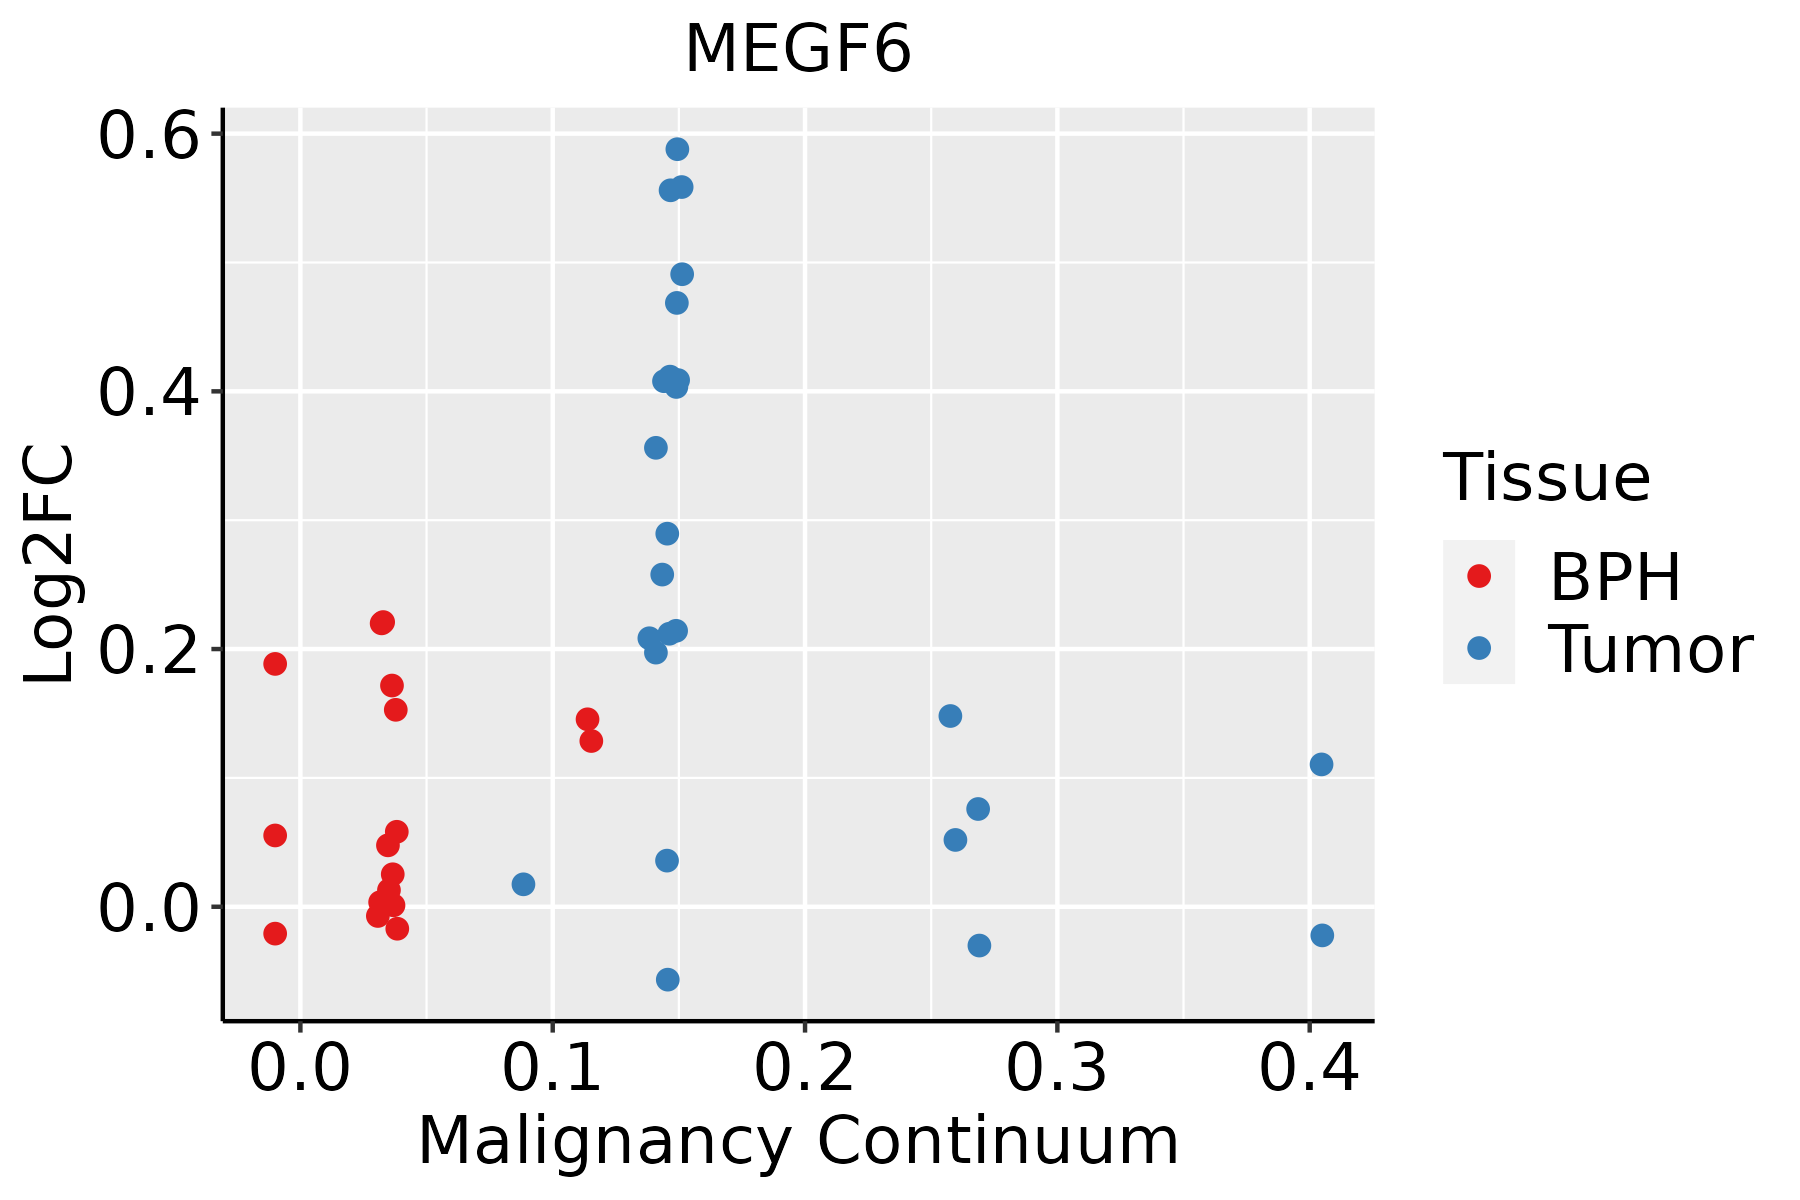
| 1953 | MEGF6 | GSM5252136_BPH556PrGA1_Fcol | Human | Prostate | BPH | 7.48e-03 | 1.53e-01 | -0.23 |
| 1953 | MEGF6 | GSM5252137_BPH556PrGA2_Fcol | Human | Prostate | BPH | 1.25e-03 | 1.72e-01 | -0.23 |
| 1953 | MEGF6 | 048752_1579-all-cells | Human | Prostate | BPH | 6.16e-04 | 1.88e-01 | 0.1008 |
| 1953 | MEGF6 | 052095_1628-all-cells | Human | Prostate | BPH | 1.02e-04 | 1.45e-01 | 0.1032 |
| 1953 | MEGF6 | Dong_P1 | Human | Prostate | Tumor | 3.39e-08 | 4.58e-02 | 0.035 |
| 1953 | MEGF6 | Dong_P3 | Human | Prostate | Tumor | 4.36e-03 | 6.11e-02 | 0.0278 |
| 1953 | MEGF6 | GSM5353221_PA_PB2A_Pool_1_3_S25_L001 | Human | Prostate | Tumor | 1.30e-04 | 4.91e-01 | 0.1633 |
| 1953 | MEGF6 | GSM5353222_PA_PB2B_Pool_1_3_S52_L002 | Human | Prostate | Tumor | 5.41e-04 | 4.03e-01 | 0.1608 |
| 1953 | MEGF6 | GSM5353223_PA_PB2B_Pool_2_S26_L001 | Human | Prostate | Tumor | 8.15e-04 | 4.69e-01 | 0.1604 |
| 1953 | MEGF6 | GSM5353224_PA_PR5186_Pool_1_2_3_S27_L001 | Human | Prostate | Tumor | 1.39e-02 | 4.09e-01 | 0.1621 |
| 1953 | MEGF6 | GSM5353227_PA_PR5199-193K_Pool_1_2_3_S55_L002 | Human | Prostate | Tumor | 1.34e-02 | 4.11e-01 | 0.1602 |
| 1953 | MEGF6 | GSM5353236_PA_PR5251_T1_S7_L001 | Human | Prostate | Tumor | 3.18e-03 | 5.88e-01 | 0.1608 |
| 1953 | MEGF6 | GSM5353240_PA_PR5254_T1_S15_L001 | Human | Prostate | Tumor | 2.05e-04 | 4.08e-01 | 0.1575 |
| Hugo Symbol | Variant Class | Variant Classification | dbSNP RS | HGVSc | HGVSp | HGVSp Short | SWISSPROT | BIOTYPE | SIFT | PolyPhen | Tumor Sample Barcode | Tissue | Histology | Sex | Age | Stage | Therapy Types | Drugs | Outcome |
| MEGF6 | SNV | Missense_Mutation | rs762873581 | c.958G>A | p.Asp320Asn | p.D320N | O75095 | protein_coding | tolerated(0.07) | benign(0.373) | TCGA-3C-AALK-01 | Breast | breast invasive carcinoma | Female | <65 | I/II | Chemotherapy | docetaxel | SD |
| MEGF6 | SNV | Missense_Mutation | | c.148G>C | p.Glu50Gln | p.E50Q | O75095 | protein_coding | tolerated(0.08) | possibly_damaging(0.903) | TCGA-A2-A0SY-01 | Breast | breast invasive carcinoma | Female | <65 | III/IV | Hormone Therapy | arimidex | SD |
| MEGF6 | SNV | Missense_Mutation | novel | c.1645C>A | p.Leu549Ile | p.L549I | O75095 | protein_coding | tolerated(1) | benign(0.029) | TCGA-AC-A3TM-01 | Breast | breast invasive carcinoma | Female | <65 | III/IV | Chemotherapy | cytoxan | CR |
| MEGF6 | SNV | Missense_Mutation | novel | c.4573N>G | p.Leu1525Val | p.L1525V | O75095 | protein_coding | tolerated(0.5) | benign(0.014) | TCGA-AC-A5XS-01 | Breast | breast invasive carcinoma | Female | >=65 | I/II | Hormone Therapy | femara | SD |
| MEGF6 | SNV | Missense_Mutation | rs754996501 | c.1021G>A | p.Gly341Ser | p.G341S | O75095 | protein_coding | deleterious(0) | probably_damaging(1) | TCGA-2W-A8YY-01 | Cervix | cervical & endocervical cancer | Female | <65 | I/II | Chemotherapy | cisplatin | CR |
| MEGF6 | SNV | Missense_Mutation | novel | c.2335G>T | p.Gly779Trp | p.G779W | O75095 | protein_coding | deleterious(0) | probably_damaging(1) | TCGA-DS-A1OB-01 | Cervix | cervical & endocervical cancer | Female | <65 | I/II | Chemotherapy | carboplatin | PD |
| MEGF6 | SNV | Missense_Mutation | rs762873581 | c.958N>A | p.Asp320Asn | p.D320N | O75095 | protein_coding | tolerated(0.07) | benign(0.373) | TCGA-VS-A952-01 | Cervix | cervical & endocervical cancer | Female | >=65 | I/II | Unknown | Unknown | SD |
| MEGF6 | SNV | Missense_Mutation | novel | c.3771C>G | p.Asn1257Lys | p.N1257K | O75095 | protein_coding | deleterious(0.02) | benign(0.101) | TCGA-VS-A953-01 | Cervix | cervical & endocervical cancer | Female | <65 | I/II | Unknown | Unknown | PD |
| MEGF6 | deletion | Frame_Shift_Del | novel | c.2322_2332delCGAGGGCCGCT | p.Glu775GlyfsTer20 | p.E775Gfs*20 | O75095 | protein_coding | | | TCGA-DS-A1OB-01 | Cervix | cervical & endocervical cancer | Female | <65 | I/II | Chemotherapy | carboplatin | PD |
| MEGF6 | deletion | Frame_Shift_Del | rs759225724 | c.4318delN | p.Ala1440HisfsTer78 | p.A1440Hfs*78 | O75095 | protein_coding | | | TCGA-VS-A94Z-01 | Cervix | cervical & endocervical cancer | Female | <65 | I/II | Chemotherapy | cisplatin | CR |