
|
|||||
|
 | |
| |
| |
| |
| |
| |
|
Gene: MEG8 |
Gene summary for MEG8 |
| Gene information | Species | Human | Gene symbol | MEG8 | Gene ID | 79104 |
| Gene name | maternally expressed 8, small nucleolar RNA host gene | |
| Gene Alias | Bsr | |
| Cytomap | 14q32.2-q32.31 | |
| Gene Type | ncRNA | GO ID | GO:0005575 | UniProtAcc | NA |
Top |
Malignant transformation analysis |
| Identification of the aberrant gene expression in precancerous and cancerous lesions by comparing the gene expression of stem-like cells in diseased tissues with normal stem cells |
| Entrez ID | Symbol | Replicates | Species | Organ | Tissue | Adj P-value | Log2FC | Malignancy |
| 79104 | MEG8 | RNA-P7T1-P7T1-1 | Human | Lung | AIS | 1.36e-03 | 5.42e-01 | -0.0961 |
| 79104 | MEG8 | RNA-P7T1-P7T1-2 | Human | Lung | AIS | 3.45e-03 | 4.60e-01 | -0.0876 |
| 79104 | MEG8 | RNA-P7T1-P7T1-3 | Human | Lung | AIS | 5.60e-06 | 6.71e-01 | -0.0822 |
| 79104 | MEG8 | RNA-P7T1-P7T1-4 | Human | Lung | AIS | 2.35e-06 | 6.33e-01 | -0.0809 |
| 79104 | MEG8 | GSM5252128_BPH327PrGF_Via | Human | Prostate | BPH | 3.98e-03 | 3.97e-01 | -0.1688 |
| 79104 | MEG8 | GSM5252129_BPH327PrSF_Via | Human | Prostate | BPH | 1.88e-02 | 6.85e-01 | -0.1697 |
| 79104 | MEG8 | GSM5252131_BPH340PrSF_Via | Human | Prostate | BPH | 7.82e-04 | 4.82e-01 | -0.2126 |
| 79104 | MEG8 | GSM5252134_BPH511PrG_Fcol_3GEX | Human | Prostate | BPH | 1.04e-02 | 4.05e-01 | -0.1433 |
| 79104 | MEG8 | GSM5252136_BPH556PrGA1_Fcol | Human | Prostate | BPH | 1.32e-13 | 6.42e-01 | -0.23 |
| 79104 | MEG8 | GSM5252137_BPH556PrGA2_Fcol | Human | Prostate | BPH | 1.78e-09 | 6.98e-01 | -0.23 |
| 79104 | MEG8 | 047563_1562-all-cells | Human | Prostate | BPH | 5.48e-18 | 6.92e-01 | 0.0791 |
| 79104 | MEG8 | 048752_1579-all-cells | Human | Prostate | BPH | 1.63e-31 | 8.19e-01 | 0.1008 |
| 79104 | MEG8 | 052095_1628-all-cells | Human | Prostate | BPH | 4.65e-07 | 4.17e-01 | 0.1032 |
| 79104 | MEG8 | 052097_1595-all-cells | Human | Prostate | BPH | 3.16e-34 | 8.75e-01 | 0.0972 |
| 79104 | MEG8 | 052099_1652-all-cells | Human | Prostate | BPH | 1.13e-32 | 8.44e-01 | 0.1038 |
| 79104 | MEG8 | Dong_P1 | Human | Prostate | Tumor | 6.45e-05 | -1.58e-01 | 0.035 |
| 79104 | MEG8 | Dong_P5 | Human | Prostate | Tumor | 3.26e-03 | -1.52e-01 | 0.053 |
| 79104 | MEG8 | GSM5353243_PA_PR5261_T1_S23_L002 | Human | Prostate | Tumor | 3.25e-02 | -1.60e-01 | 0.1545 |
| 79104 | MEG8 | ATC11 | Human | Thyroid | ATC | 1.60e-07 | 5.38e-01 | 0.3386 |
| 79104 | MEG8 | ATC13 | Human | Thyroid | ATC | 1.48e-46 | 8.13e-01 | 0.34 |
| Page: 1 2 |
| Tissue | Expression Dynamics | Abbreviation |
| Lung |  | AAH: Atypical adenomatous hyperplasia |
| AIS: Adenocarcinoma in situ | ||
| IAC: Invasive lung adenocarcinoma | ||
| MIA: Minimally invasive adenocarcinoma | ||
| Prostate | 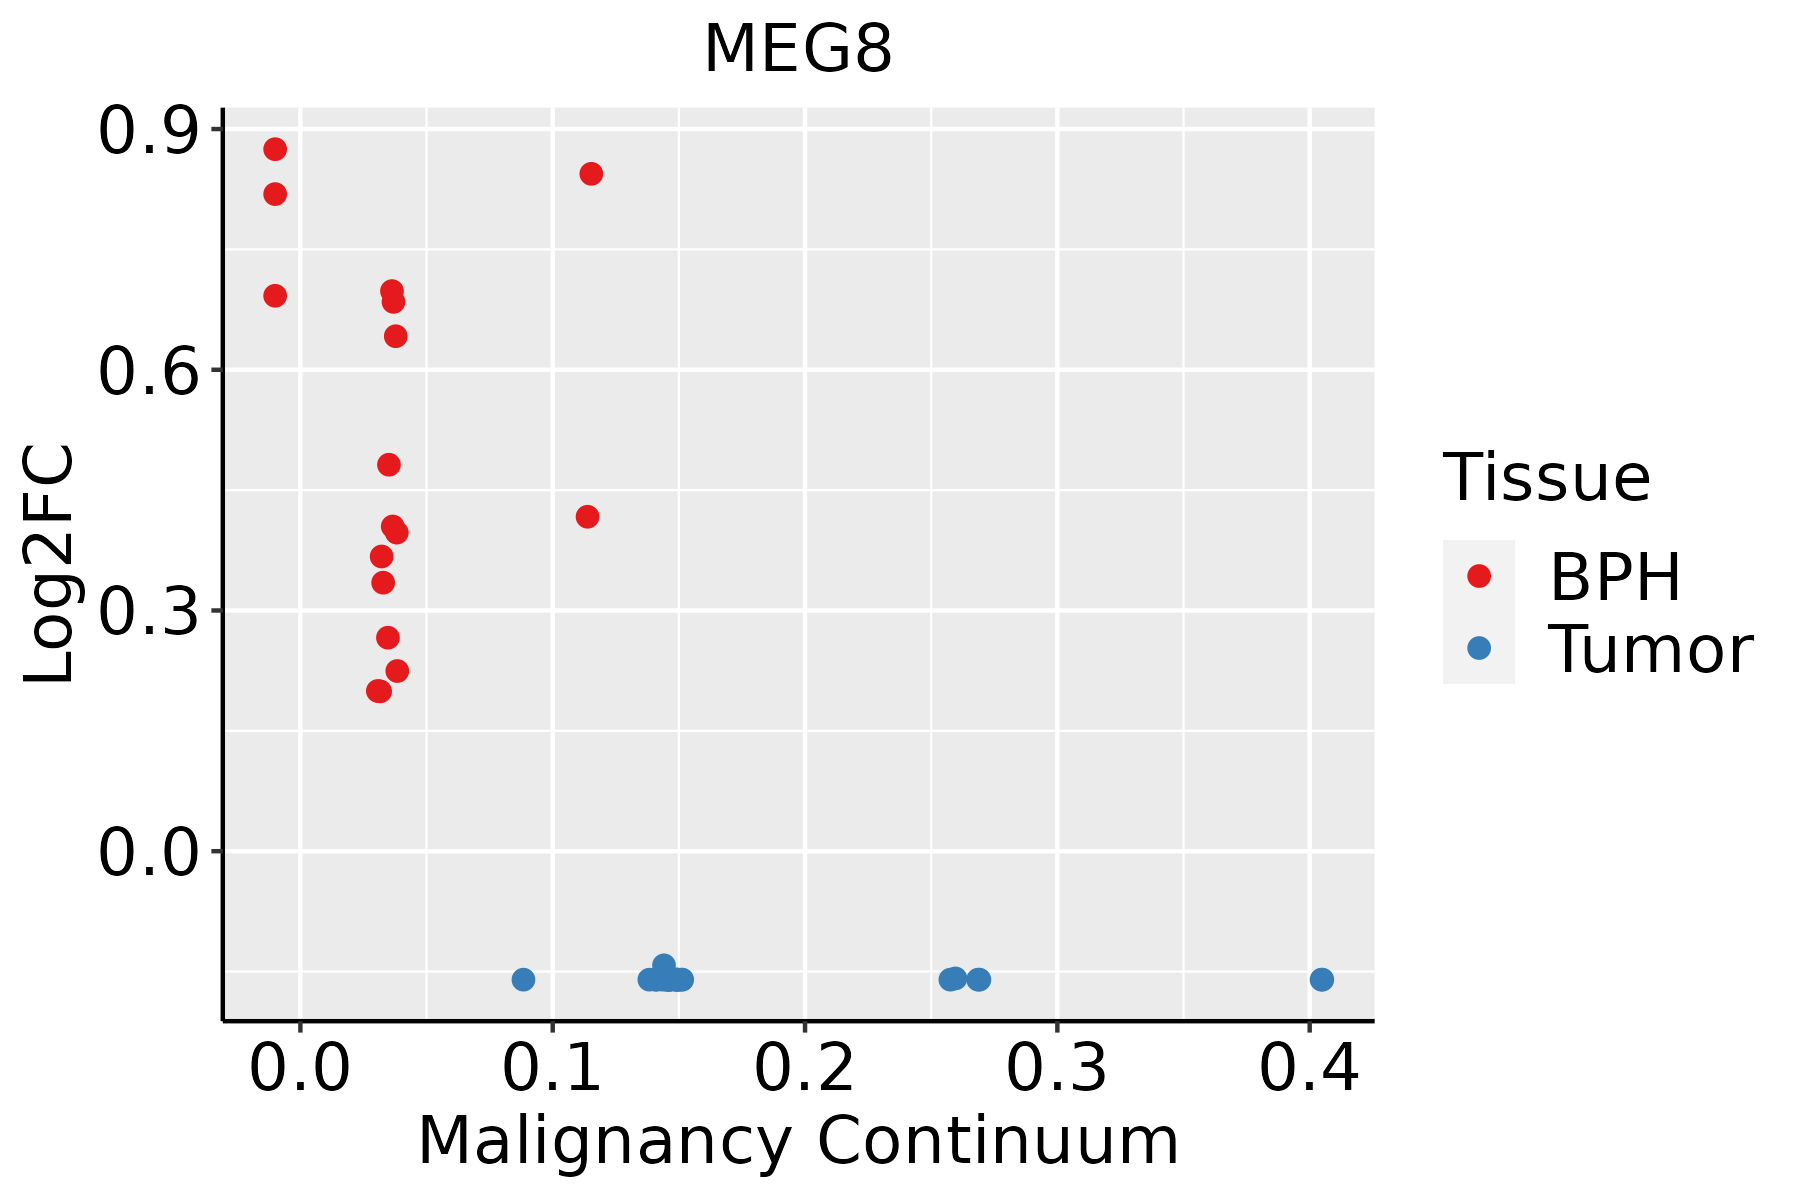 | BPH: Benign Prostatic Hyperplasia |
| Thyroid | 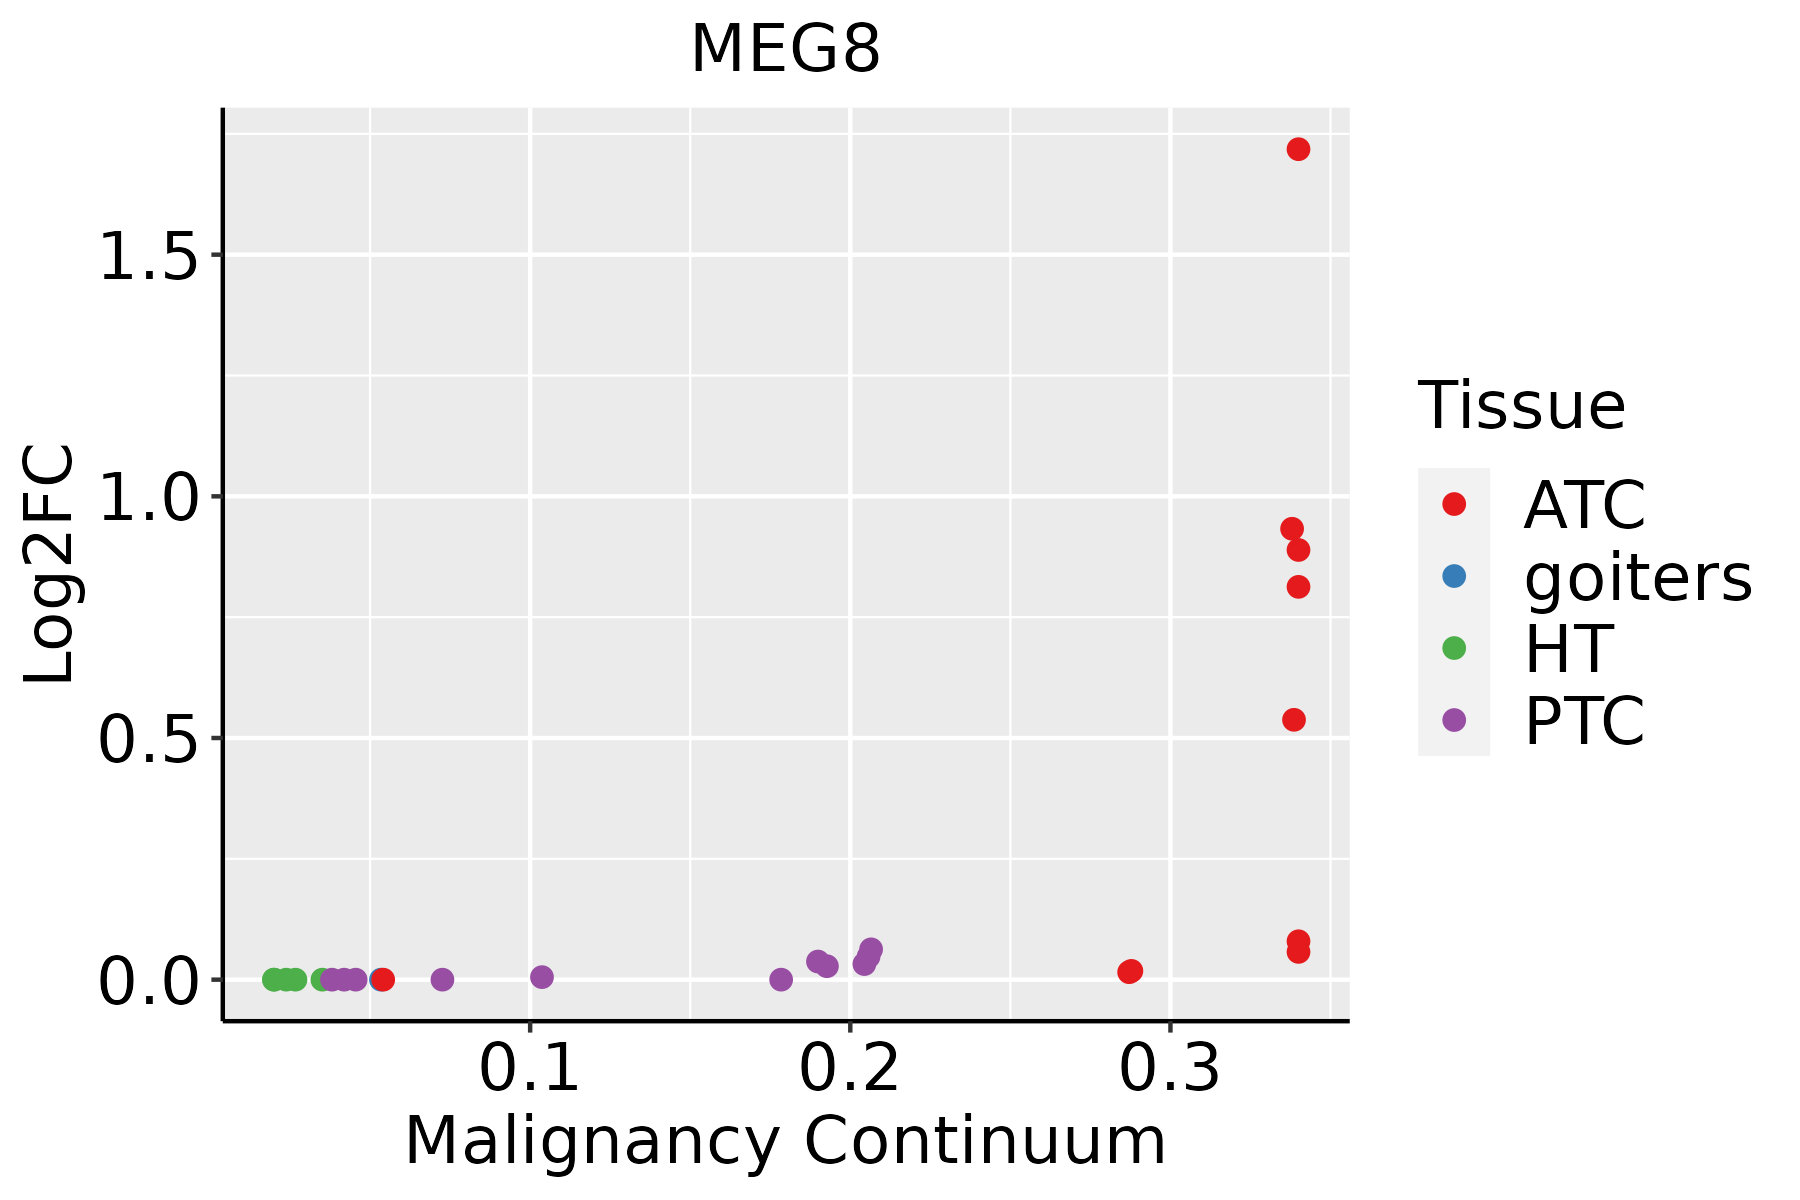 | ATC: Anaplastic thyroid cancer |
| HT: Hashimoto's thyroiditis | ||
| PTC: Papillary thyroid cancer |
| ∗log2FC in expression of this searched gene in stem-like cells from each diseased tissue sample relative to stem-like cells in normal samples in each tissue plotted against the malignancy continuum. Samples are colored based on if they are from different disease stage. |
Top |
Malignant transformation related pathway analysis |
| Find out the enriched GO biological processes and KEGG pathways involved in transition from healthy to precancer to cancer |
| Tissue | Disease Stage | Enriched GO biological Processes |
| Colorectum | AD |  |
| Colorectum | SER |  |
| Colorectum | MSS |  |
| Colorectum | MSI-H |  |
| Colorectum | FAP |  |
| ∗Top 15 enriched GO BP terms are showed in the bar plot of each disease state in each tissue. Each row represents a significant GO biological process which is colored according to the -log10(p.adjust). |
| Page: 1 2 3 4 5 6 7 8 9 |
| GO ID | Tissue | Disease Stage | Description | Gene Ratio | Bg Ratio | pvalue | p.adjust | Count |
| Page: 1 |
| Pathway ID | Tissue | Disease Stage | Description | Gene Ratio | Bg Ratio | pvalue | p.adjust | qvalue | Count |
| Page: 1 |
Top |
Cell-cell communication analysis |
| Identification of potential cell-cell interactions between two cell types and their ligand-receptor pairs for different disease states |
| Ligand | Receptor | LRpair | Pathway | Tissue | Disease Stage |
| Page: 1 |
Top |
Single-cell gene regulatory network inference analysis |
| Find out the significant the regulons (TFs) and the target genes of each regulon across cell types for different disease states |
| TF | Cell Type | Tissue | Disease Stage | Target Gene | RSS | Regulon Activity |
| ∗The dot plots of a searched regulon are shown for all cell subpopulations in each disease state of each tissue based on the regulon specific score inferred using pySCENIC and by calculating the average expression. |
| Page: 1 |
Top |
Somatic mutation of malignant transformation related genes |
| Annotation of somatic variants for genes involved in malignant transformation |
| Hugo Symbol | Variant Class | Variant Classification | dbSNP RS | HGVSc | HGVSp | HGVSp Short | SWISSPROT | BIOTYPE | SIFT | PolyPhen | Tumor Sample Barcode | Tissue | Histology | Sex | Age | Stage | Therapy Types | Drugs | Outcome |
| Page: 1 |
Top |
Related drugs of malignant transformation related genes |
| Identification of chemicals and drugs interact with genes involved in malignant transfromation |
| (DGIdb 4.0) |
| Entrez ID | Symbol | Category | Interaction Types | Drug Claim Name | Drug Name | PMIDs |
| Page: 1 |

Copyright 2023-Present -The University of Texas Health Science Center at Houston |