
|
|||||
|
 | |
| |
| |
| |
| |
| |
|
Gene: MEG3 |
Gene summary for MEG3 |
| Gene information | Species | Human | Gene symbol | MEG3 | Gene ID | 55384 |
| Gene name | maternally expressed 3 | |
| Gene Alias | FP504 | |
| Cytomap | 14q32.2 | |
| Gene Type | ncRNA | GO ID | GO:0001558 | UniProtAcc | NA |
Top |
Malignant transformation analysis |
| Identification of the aberrant gene expression in precancerous and cancerous lesions by comparing the gene expression of stem-like cells in diseased tissues with normal stem cells |
| Entrez ID | Symbol | Replicates | Species | Organ | Tissue | Adj P-value | Log2FC | Malignancy |
| 55384 | MEG3 | AEH-subject1 | Human | Endometrium | AEH | 2.25e-23 | -5.79e-01 | -0.3059 |
| 55384 | MEG3 | AEH-subject2 | Human | Endometrium | AEH | 1.31e-25 | -5.72e-01 | -0.2525 |
| 55384 | MEG3 | AEH-subject3 | Human | Endometrium | AEH | 1.63e-18 | -5.12e-01 | -0.2576 |
| 55384 | MEG3 | AEH-subject5 | Human | Endometrium | AEH | 7.38e-22 | -5.63e-01 | -0.2953 |
| 55384 | MEG3 | EEC-subject1 | Human | Endometrium | EEC | 1.24e-23 | -5.91e-01 | -0.2682 |
| 55384 | MEG3 | EEC-subject2 | Human | Endometrium | EEC | 3.18e-32 | -6.15e-01 | -0.2607 |
| 55384 | MEG3 | EEC-subject3 | Human | Endometrium | EEC | 1.11e-27 | -5.87e-01 | -0.2525 |
| 55384 | MEG3 | EEC-subject4 | Human | Endometrium | EEC | 1.73e-19 | -5.62e-01 | -0.2571 |
| 55384 | MEG3 | EEC-subject5 | Human | Endometrium | EEC | 7.80e-30 | -6.15e-01 | -0.249 |
| 55384 | MEG3 | GSM5276934 | Human | Endometrium | EEC | 2.22e-03 | 4.18e-01 | -0.0913 |
| 55384 | MEG3 | GSM5276935 | Human | Endometrium | EEC | 1.00e-20 | -5.83e-01 | -0.123 |
| 55384 | MEG3 | GSM6177620_NYU_UCEC1_lib1_lib1 | Human | Endometrium | EEC | 3.97e-27 | -6.15e-01 | -0.1869 |
| 55384 | MEG3 | GSM6177620_NYU_UCEC1_lib2_lib2 | Human | Endometrium | EEC | 3.30e-24 | -6.15e-01 | -0.1875 |
| 55384 | MEG3 | GSM6177620_NYU_UCEC1_lib3_lib3 | Human | Endometrium | EEC | 4.60e-28 | -6.15e-01 | -0.1883 |
| 55384 | MEG3 | GSM6177621_NYU_UCEC2_lib1_lib1 | Human | Endometrium | EEC | 5.05e-31 | -6.15e-01 | -0.1934 |
| 55384 | MEG3 | GSM6177622_NYU_UCEC3_lib1_lib1 | Human | Endometrium | EEC | 3.14e-30 | -6.15e-01 | -0.1917 |
| 55384 | MEG3 | GSM6177622_NYU_UCEC3_lib2_lib2 | Human | Endometrium | EEC | 4.34e-36 | -6.15e-01 | -0.1916 |
| 55384 | MEG3 | GSM6177623_NYU_UCEC3_Vis | Human | Endometrium | EEC | 1.70e-06 | -4.34e-01 | -0.1269 |
| 55384 | MEG3 | LZE24T | Human | Esophagus | ESCC | 4.41e-27 | 1.24e+00 | 0.0596 |
| 55384 | MEG3 | P4T-E | Human | Esophagus | ESCC | 2.15e-58 | 1.80e+00 | 0.1323 |
| Page: 1 2 3 4 5 6 |
| Tissue | Expression Dynamics | Abbreviation |
| Endometrium | 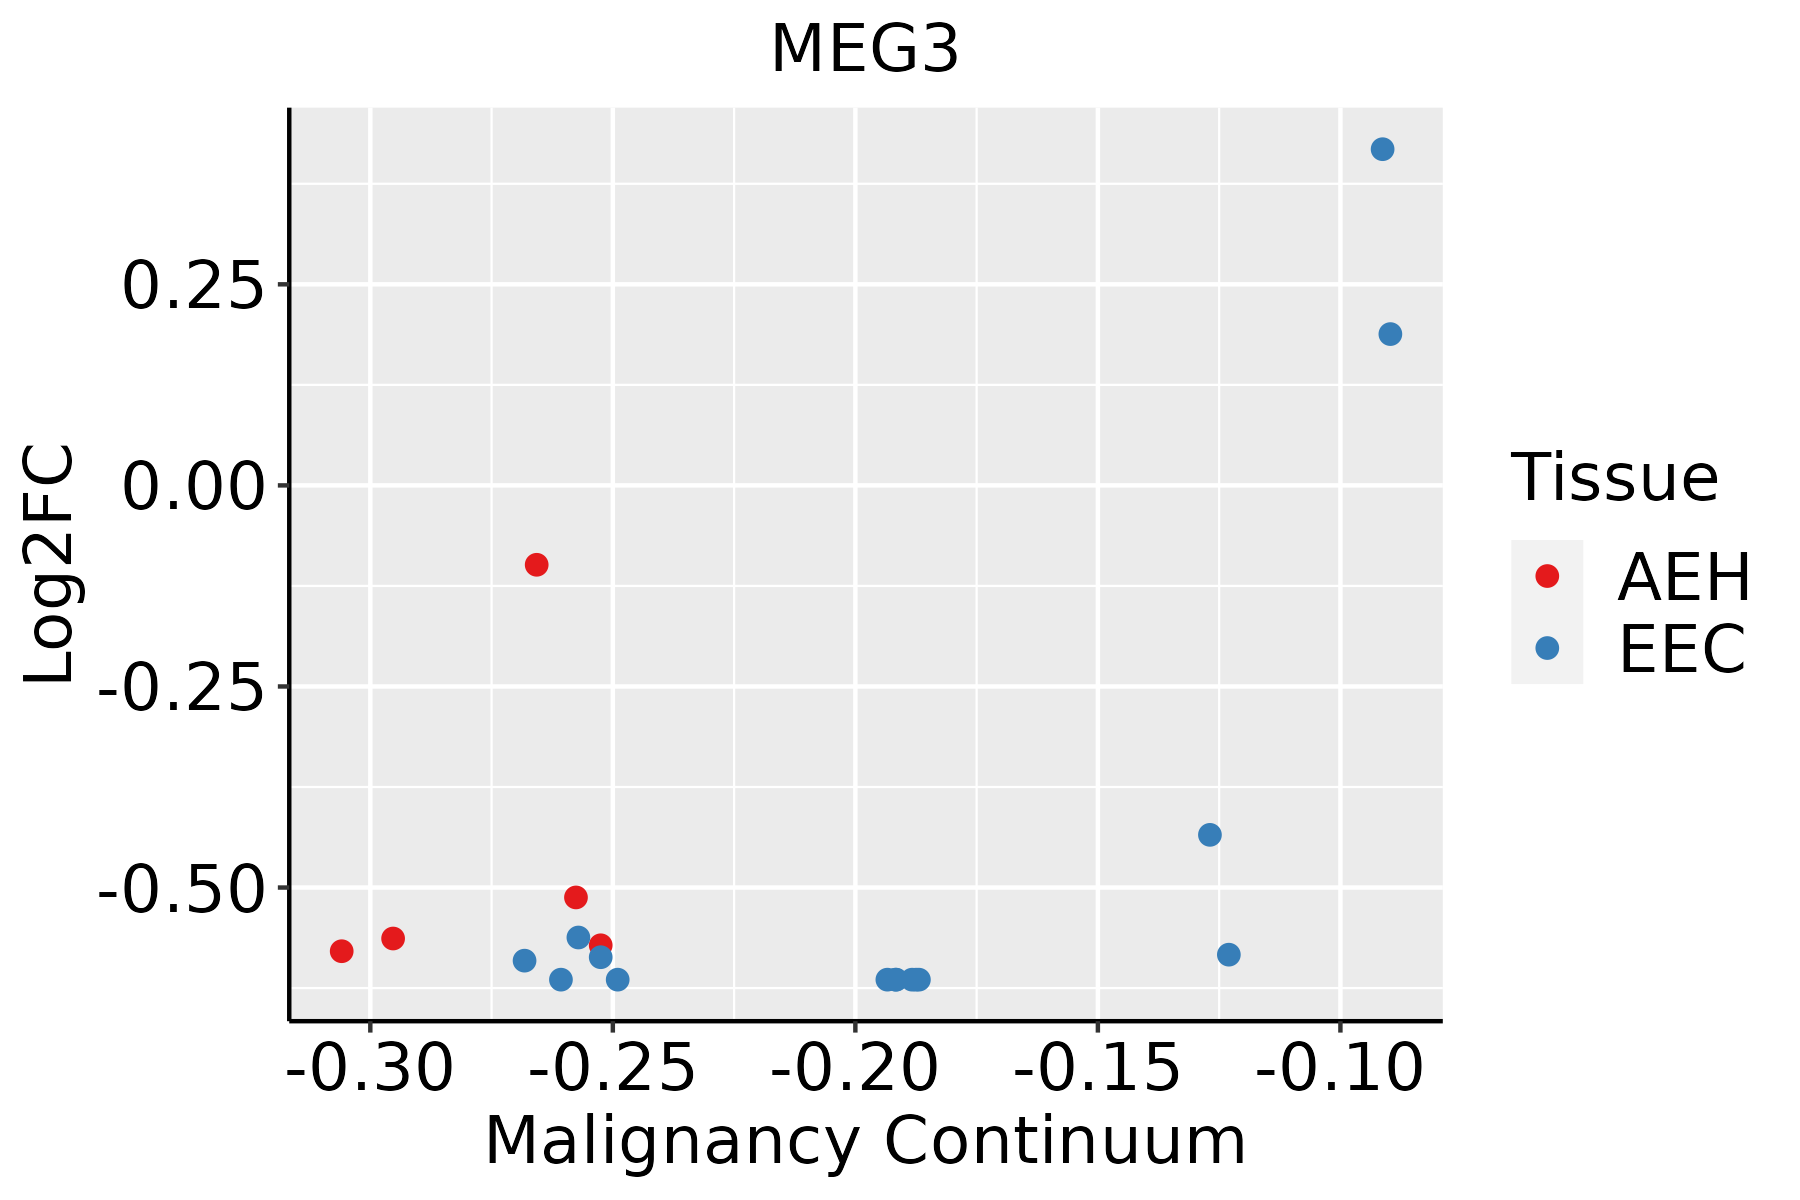 | AEH: Atypical endometrial hyperplasia |
| EEC: Endometrioid Cancer | ||
| Esophagus | 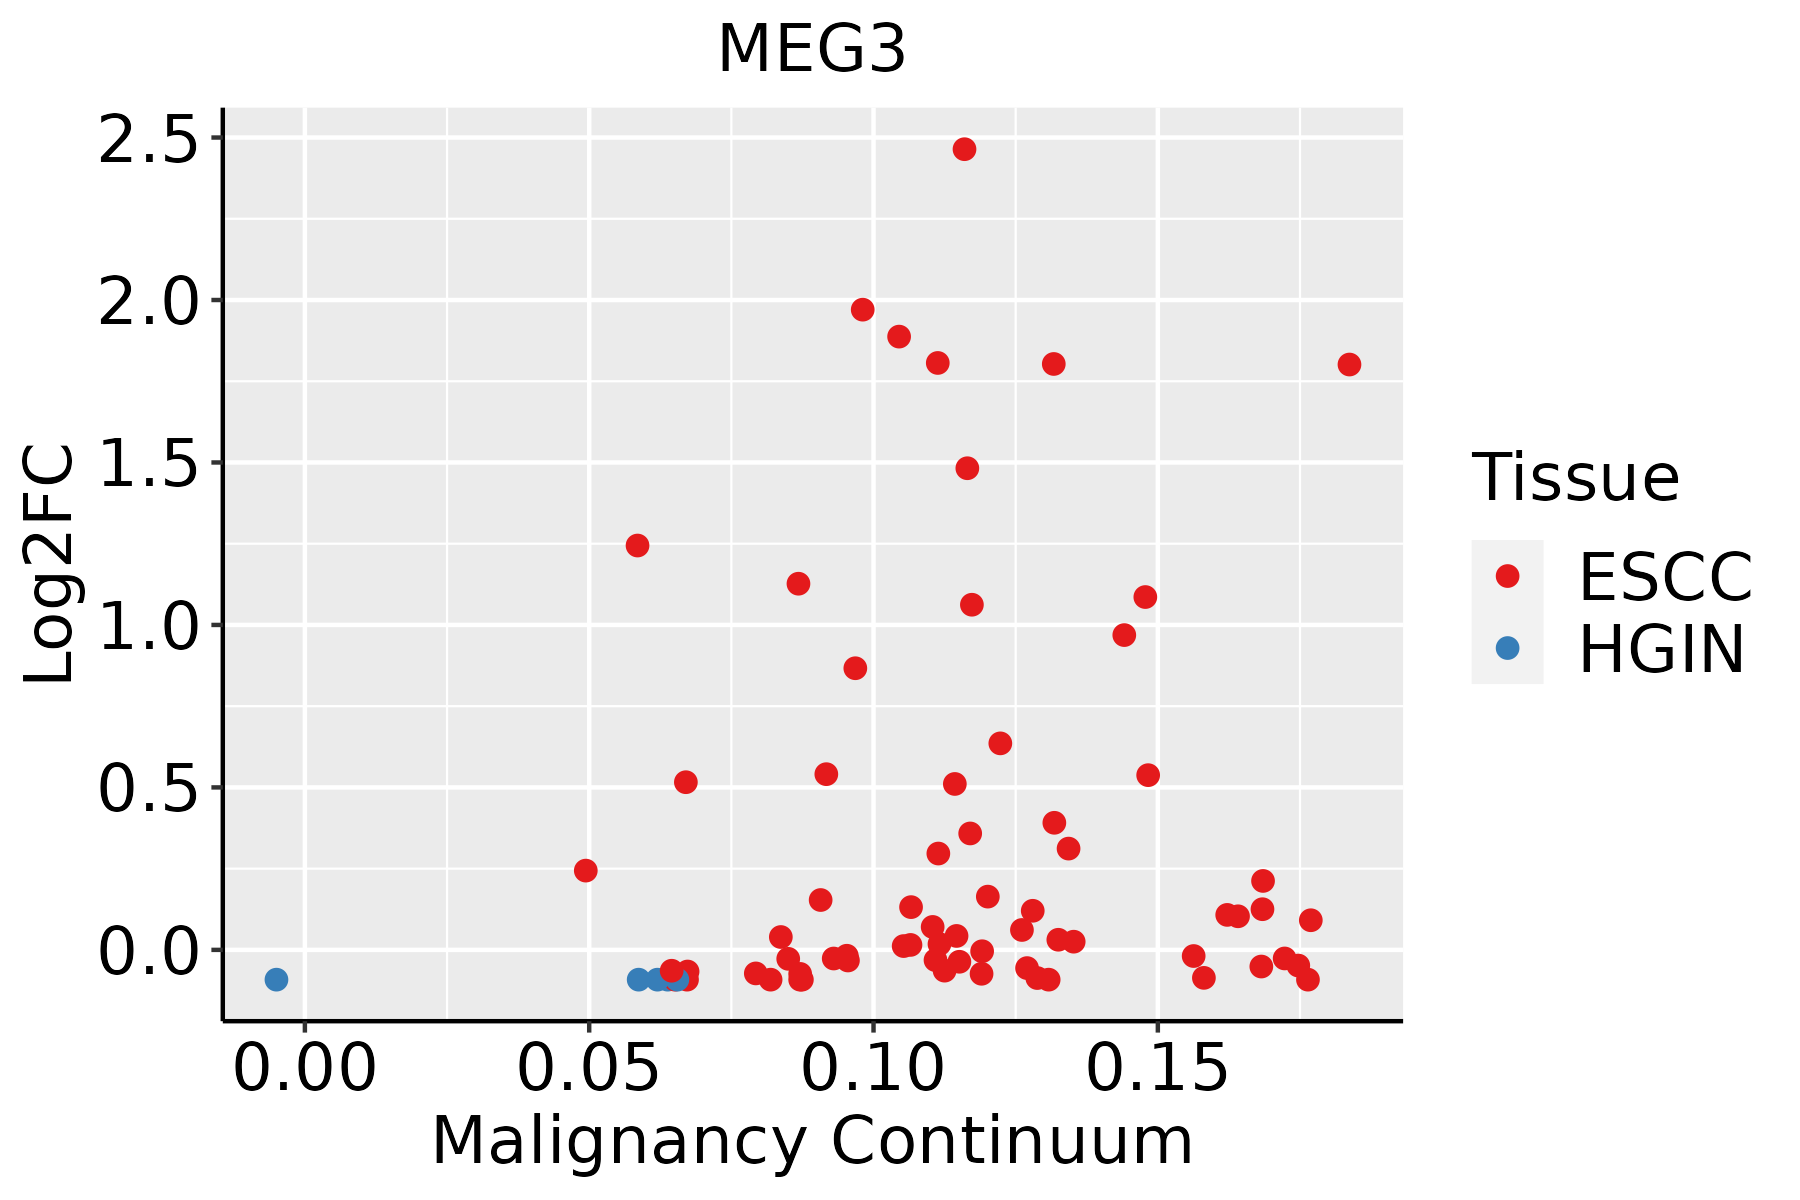 | ESCC: Esophageal squamous cell carcinoma |
| HGIN: High-grade intraepithelial neoplasias | ||
| LGIN: Low-grade intraepithelial neoplasias | ||
| Liver | 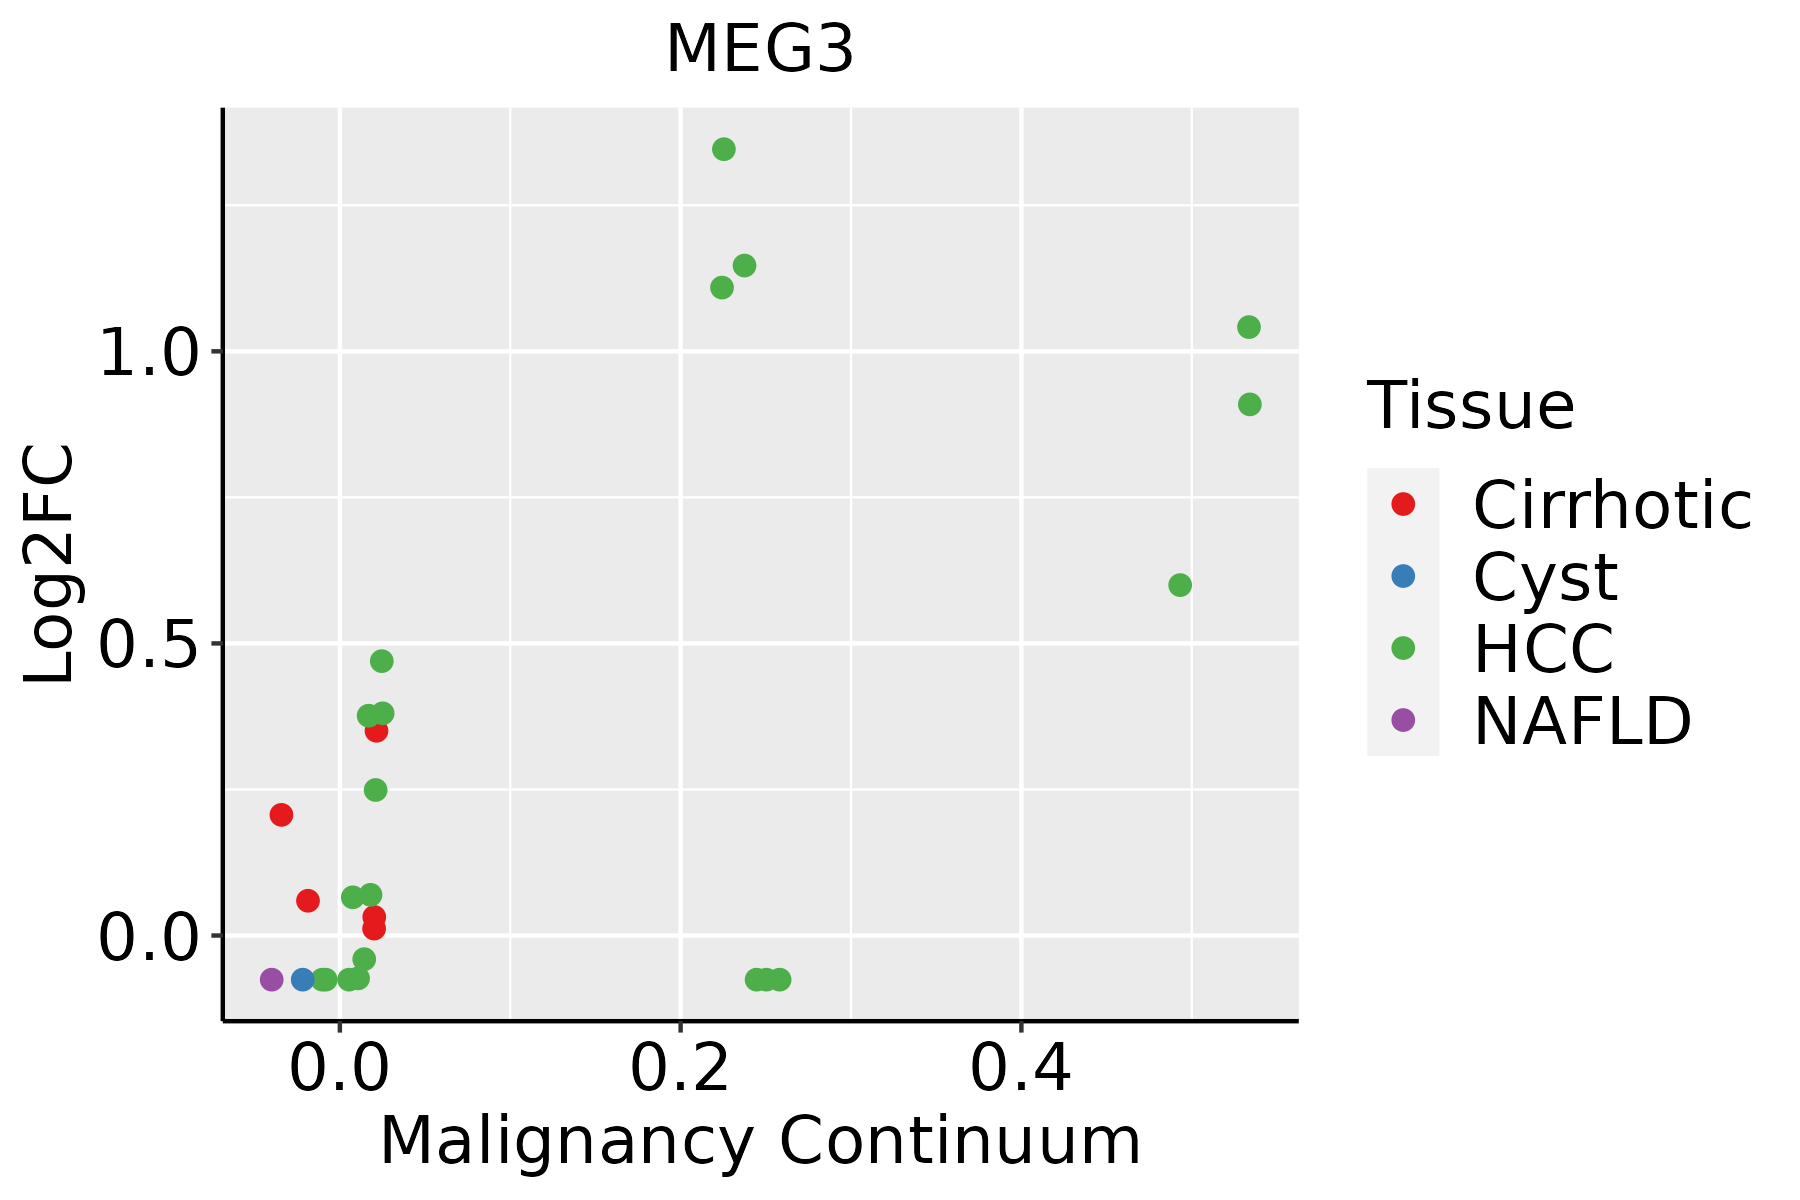 | HCC: Hepatocellular carcinoma |
| NAFLD: Non-alcoholic fatty liver disease | ||
| Lung | 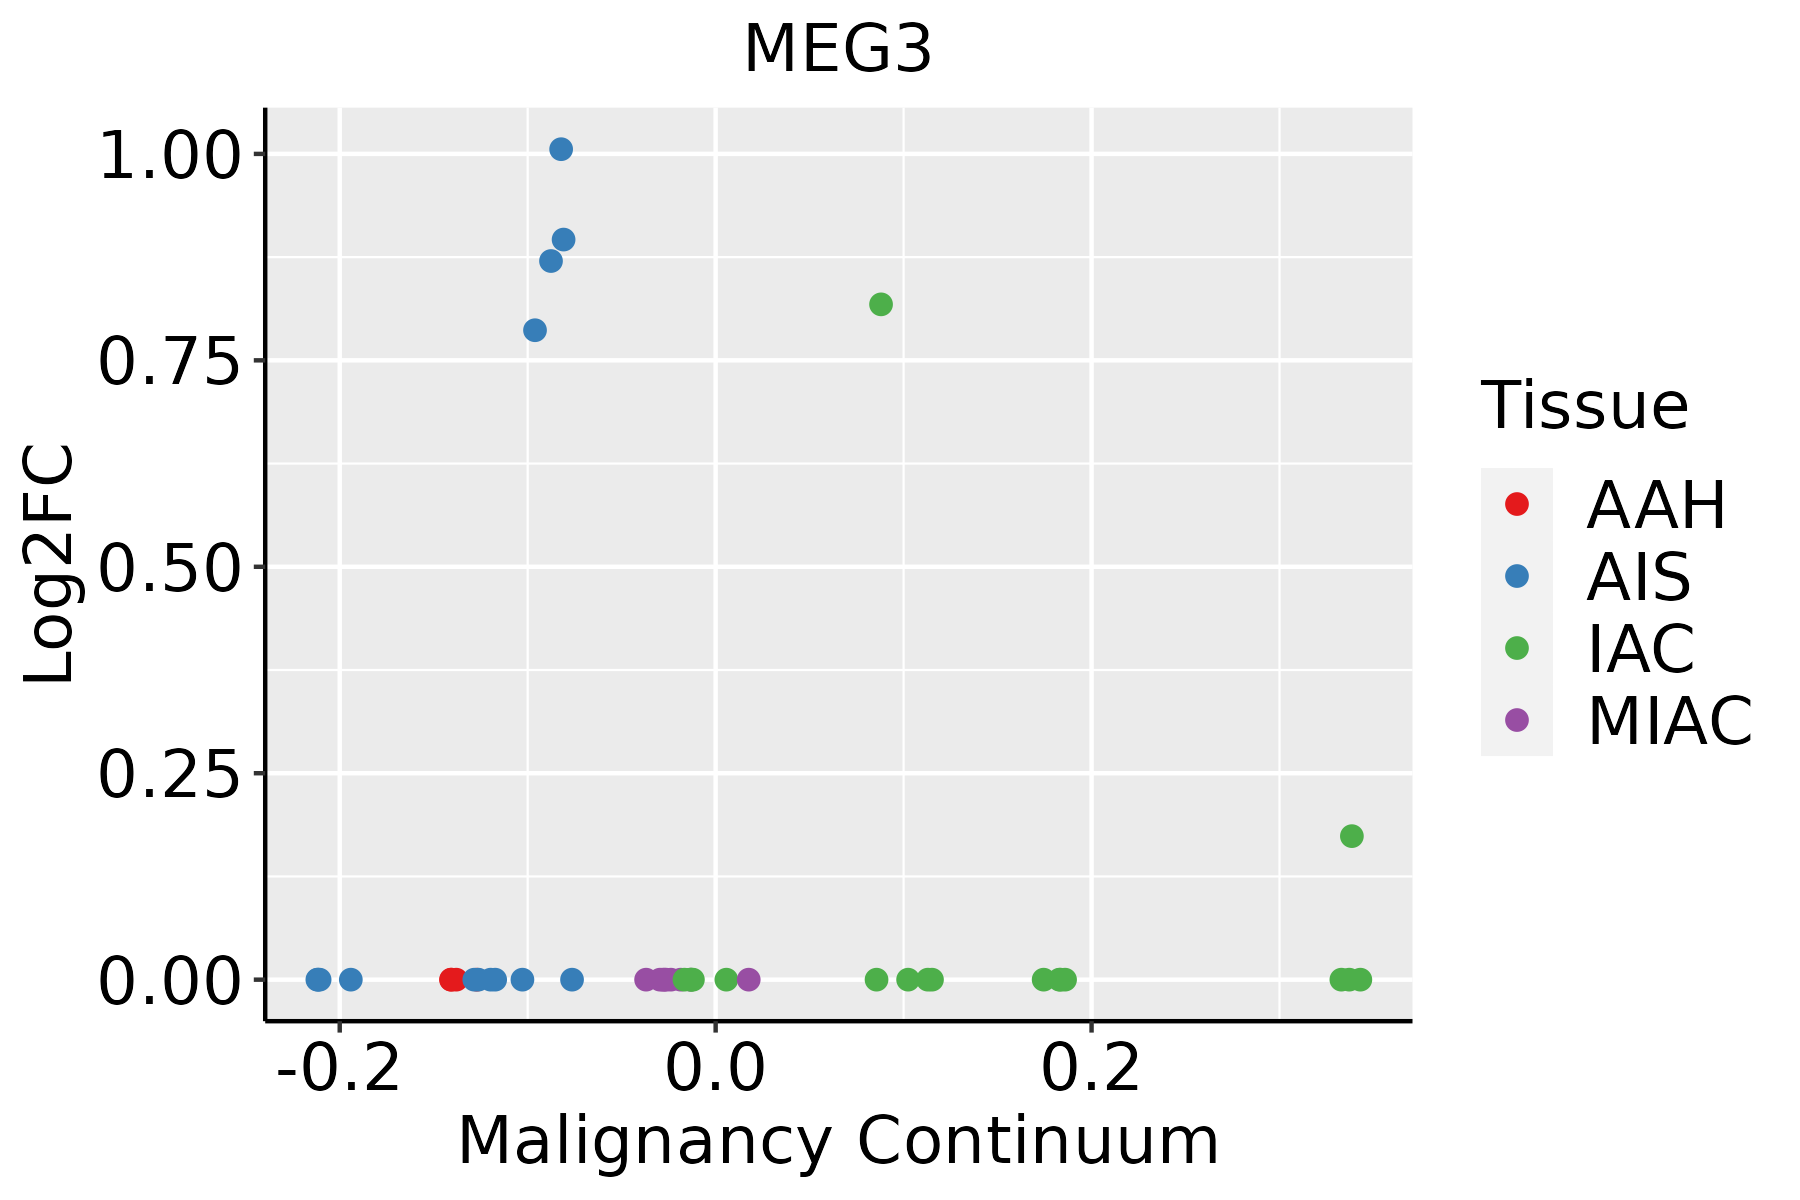 | AAH: Atypical adenomatous hyperplasia |
| AIS: Adenocarcinoma in situ | ||
| IAC: Invasive lung adenocarcinoma | ||
| MIA: Minimally invasive adenocarcinoma | ||
| Oral Cavity |  | EOLP: Erosive Oral lichen planus |
| LP: leukoplakia | ||
| NEOLP: Non-erosive oral lichen planus | ||
| OSCC: Oral squamous cell carcinoma | ||
| Prostate | 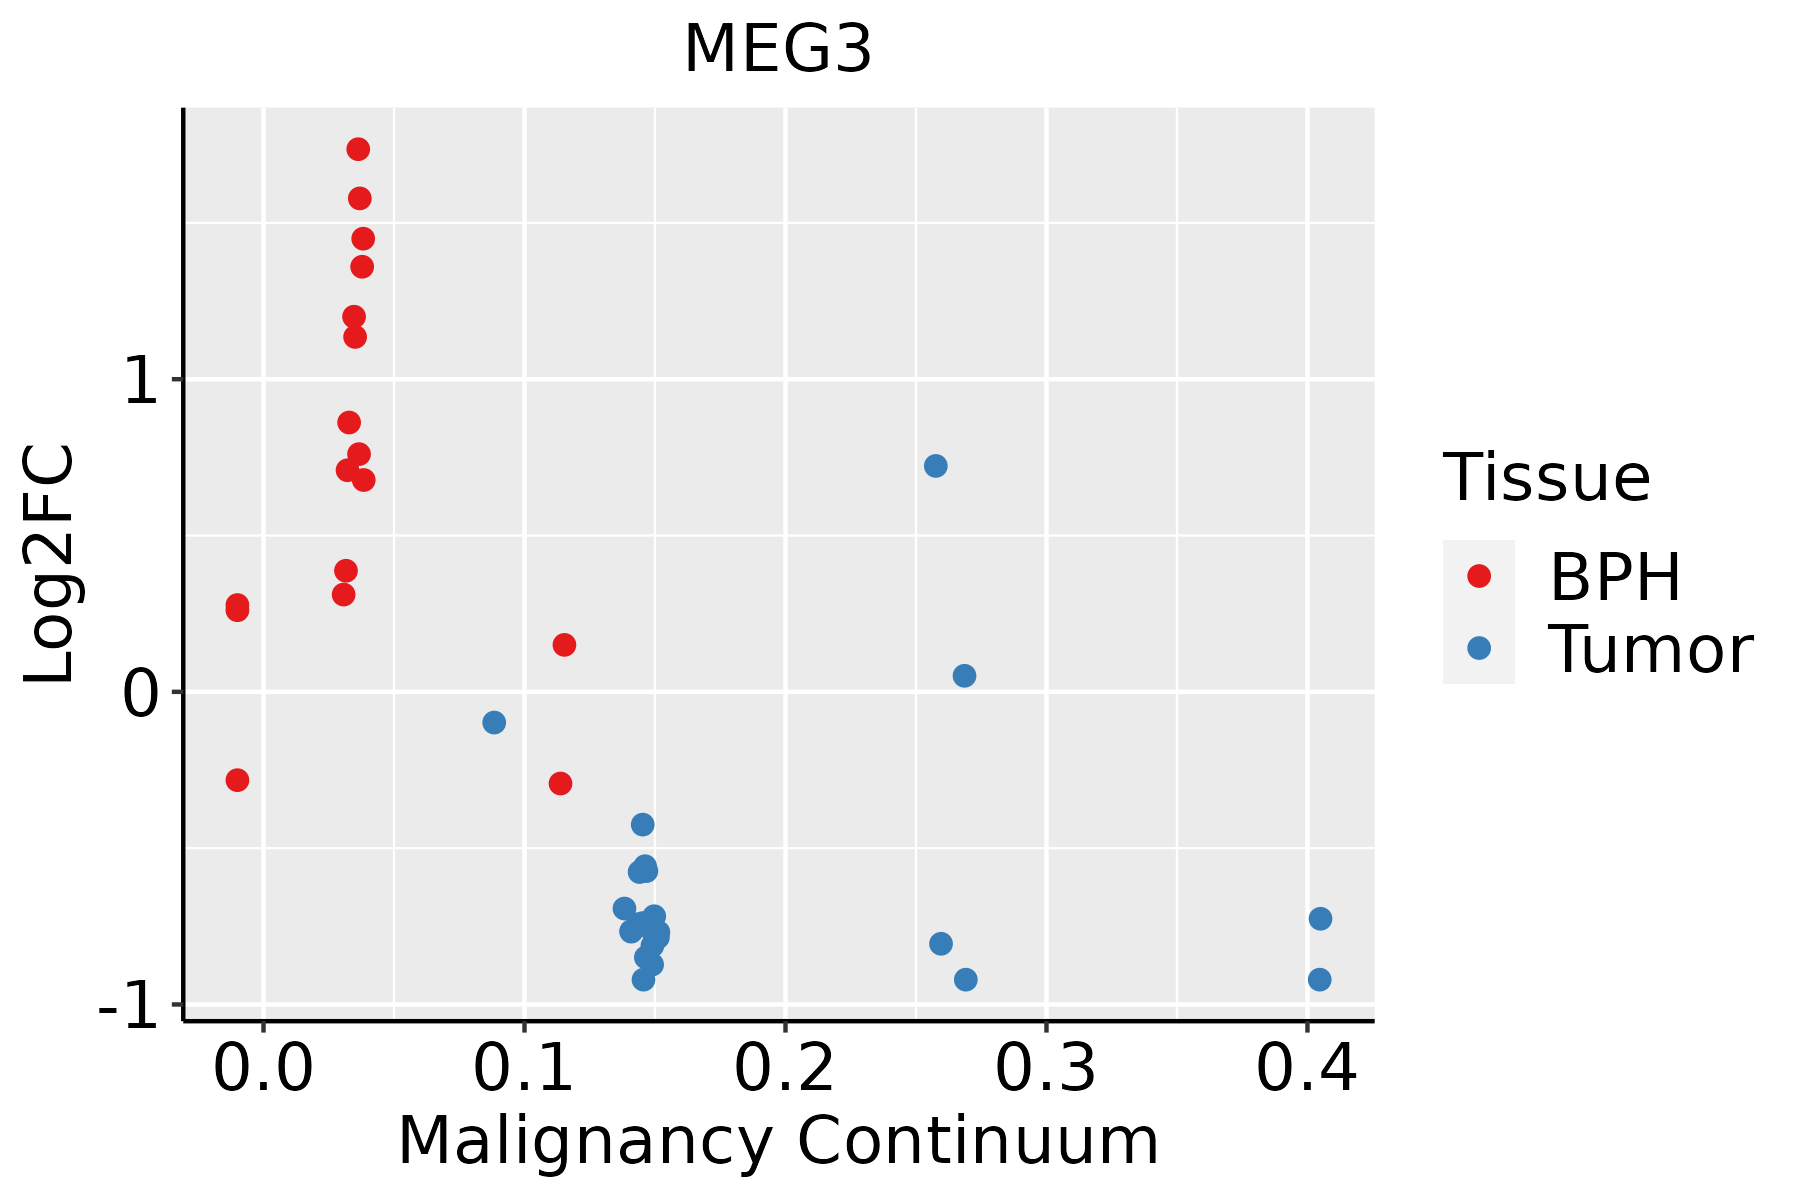 | BPH: Benign Prostatic Hyperplasia |
| Skin | 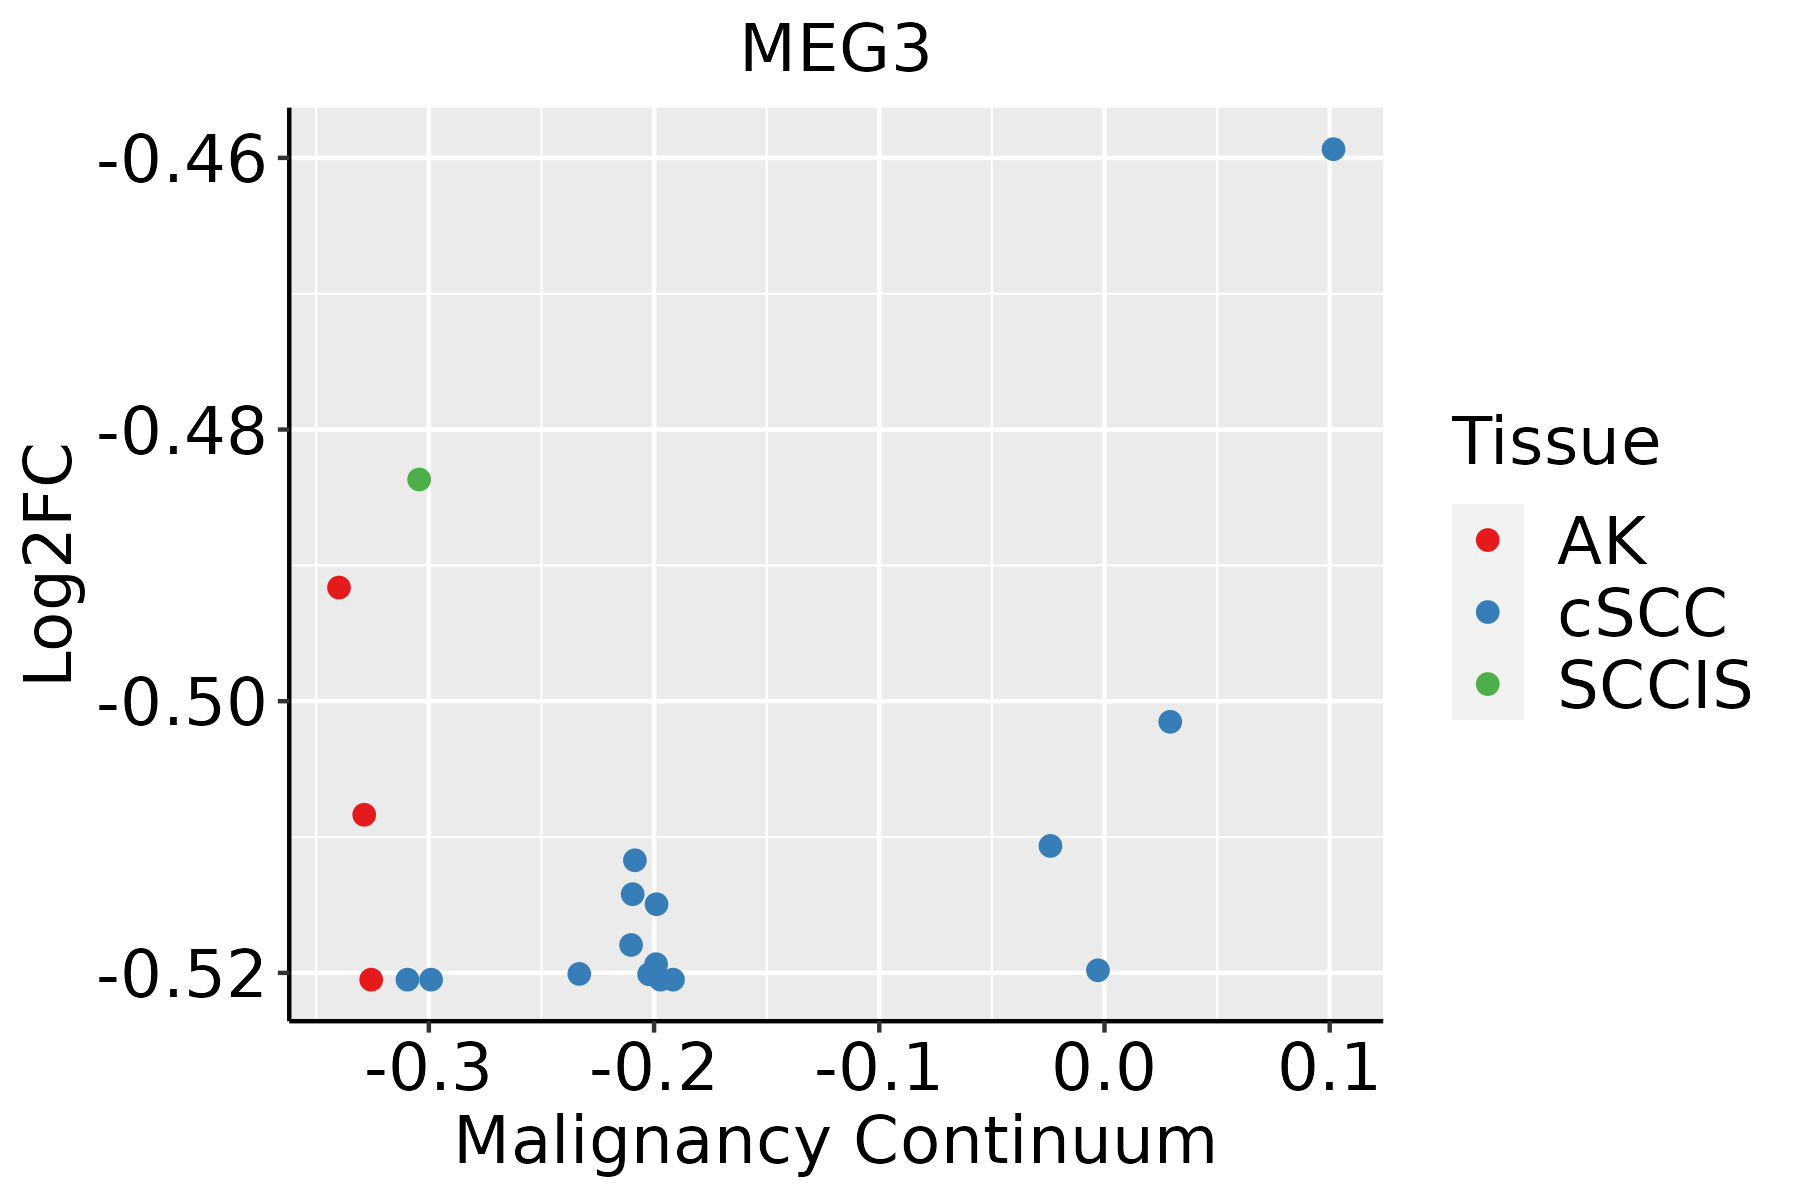 | AK: Actinic keratosis |
| cSCC: Cutaneous squamous cell carcinoma | ||
| SCCIS:squamous cell carcinoma in situ | ||
| Thyroid |  | ATC: Anaplastic thyroid cancer |
| HT: Hashimoto's thyroiditis | ||
| PTC: Papillary thyroid cancer |
| ∗log2FC in expression of this searched gene in stem-like cells from each diseased tissue sample relative to stem-like cells in normal samples in each tissue plotted against the malignancy continuum. Samples are colored based on if they are from different disease stage. |
Top |
Malignant transformation related pathway analysis |
| Find out the enriched GO biological processes and KEGG pathways involved in transition from healthy to precancer to cancer |
| Tissue | Disease Stage | Enriched GO biological Processes |
| Colorectum | AD |  |
| Colorectum | SER |  |
| Colorectum | MSS |  |
| Colorectum | MSI-H |  |
| Colorectum | FAP |  |
| ∗Top 15 enriched GO BP terms are showed in the bar plot of each disease state in each tissue. Each row represents a significant GO biological process which is colored according to the -log10(p.adjust). |
| Page: 1 2 3 4 5 6 7 8 9 |
| GO ID | Tissue | Disease Stage | Description | Gene Ratio | Bg Ratio | pvalue | p.adjust | Count |
| GO:00160499 | Endometrium | AEH | cell growth | 93/2100 | 482/18723 | 1.00e-07 | 4.99e-06 | 93 |
| GO:00015589 | Endometrium | AEH | regulation of cell growth | 75/2100 | 414/18723 | 1.79e-05 | 3.65e-04 | 75 |
| GO:00459264 | Endometrium | AEH | negative regulation of growth | 47/2100 | 249/18723 | 2.36e-04 | 2.84e-03 | 47 |
| GO:00303082 | Endometrium | AEH | negative regulation of cell growth | 36/2100 | 188/18723 | 9.15e-04 | 8.37e-03 | 36 |
| GO:001604915 | Endometrium | EEC | cell growth | 95/2168 | 482/18723 | 1.16e-07 | 5.54e-06 | 95 |
| GO:000155814 | Endometrium | EEC | regulation of cell growth | 77/2168 | 414/18723 | 1.64e-05 | 3.16e-04 | 77 |
| GO:004592611 | Endometrium | EEC | negative regulation of growth | 48/2168 | 249/18723 | 2.58e-04 | 2.98e-03 | 48 |
| GO:00303081 | Endometrium | EEC | negative regulation of cell growth | 37/2168 | 188/18723 | 8.33e-04 | 7.67e-03 | 37 |
| GO:0016049110 | Esophagus | ESCC | cell growth | 289/8552 | 482/18723 | 1.29e-10 | 3.77e-09 | 289 |
| GO:000155819 | Esophagus | ESCC | regulation of cell growth | 248/8552 | 414/18723 | 2.97e-09 | 6.45e-08 | 248 |
| GO:00459267 | Esophagus | ESCC | negative regulation of growth | 148/8552 | 249/18723 | 7.88e-06 | 7.73e-05 | 148 |
| GO:00303085 | Esophagus | ESCC | negative regulation of cell growth | 108/8552 | 188/18723 | 7.46e-04 | 3.87e-03 | 108 |
| GO:001604911 | Liver | Cirrhotic | cell growth | 160/4634 | 482/18723 | 1.50e-05 | 2.07e-04 | 160 |
| GO:000155811 | Liver | Cirrhotic | regulation of cell growth | 132/4634 | 414/18723 | 5.53e-04 | 4.36e-03 | 132 |
| GO:001604921 | Liver | HCC | cell growth | 269/7958 | 482/18723 | 1.84e-09 | 5.35e-08 | 269 |
| GO:000155821 | Liver | HCC | regulation of cell growth | 228/7958 | 414/18723 | 1.34e-07 | 2.55e-06 | 228 |
| GO:00459263 | Liver | HCC | negative regulation of growth | 129/7958 | 249/18723 | 1.81e-03 | 9.37e-03 | 129 |
| GO:0030308 | Liver | HCC | negative regulation of cell growth | 98/7958 | 188/18723 | 4.74e-03 | 2.02e-02 | 98 |
| GO:00160496 | Lung | IAC | cell growth | 89/2061 | 482/18723 | 6.10e-07 | 3.67e-05 | 89 |
| GO:00015586 | Lung | IAC | regulation of cell growth | 70/2061 | 414/18723 | 1.69e-04 | 3.01e-03 | 70 |
| Page: 1 2 3 |
| Pathway ID | Tissue | Disease Stage | Description | Gene Ratio | Bg Ratio | pvalue | p.adjust | qvalue | Count |
| Page: 1 |
Top |
Cell-cell communication analysis |
| Identification of potential cell-cell interactions between two cell types and their ligand-receptor pairs for different disease states |
| Ligand | Receptor | LRpair | Pathway | Tissue | Disease Stage |
| Page: 1 |
Top |
Single-cell gene regulatory network inference analysis |
| Find out the significant the regulons (TFs) and the target genes of each regulon across cell types for different disease states |
| TF | Cell Type | Tissue | Disease Stage | Target Gene | RSS | Regulon Activity |
| ∗The dot plots of a searched regulon are shown for all cell subpopulations in each disease state of each tissue based on the regulon specific score inferred using pySCENIC and by calculating the average expression. |
| Page: 1 |
Top |
Somatic mutation of malignant transformation related genes |
| Annotation of somatic variants for genes involved in malignant transformation |
| Hugo Symbol | Variant Class | Variant Classification | dbSNP RS | HGVSc | HGVSp | HGVSp Short | SWISSPROT | BIOTYPE | SIFT | PolyPhen | Tumor Sample Barcode | Tissue | Histology | Sex | Age | Stage | Therapy Types | Drugs | Outcome |
| Page: 1 |
Top |
Related drugs of malignant transformation related genes |
| Identification of chemicals and drugs interact with genes involved in malignant transfromation |
| (DGIdb 4.0) |
| Entrez ID | Symbol | Category | Interaction Types | Drug Claim Name | Drug Name | PMIDs |
| 55384 | MEG3 | NA | Platinum compounds | |||
| 55384 | MEG3 | NA | radiotherapy |
| Page: 1 |

Copyright 2023-Present -The University of Texas Health Science Center at Houston |