| Tissue | Expression Dynamics | Abbreviation |
| Cervix | 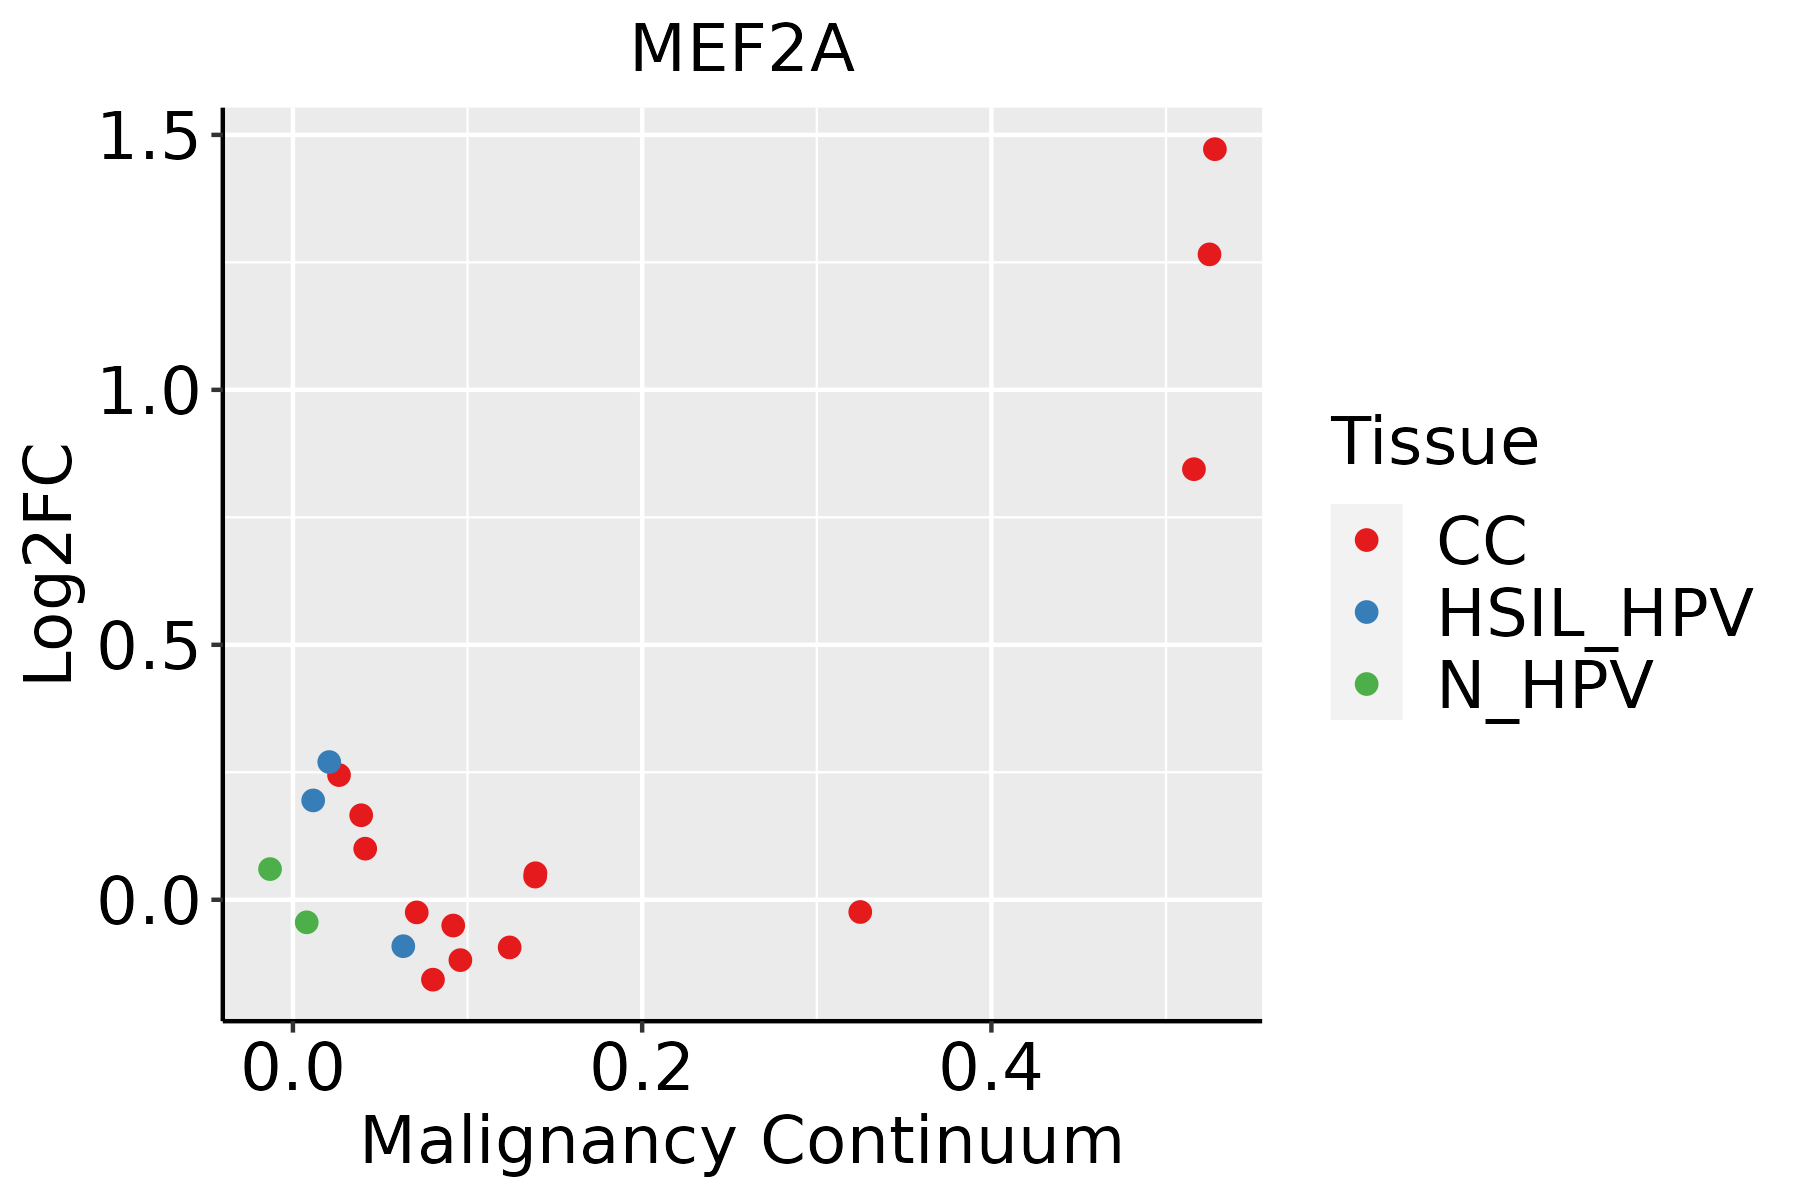 | CC: Cervix cancer |
| HSIL_HPV: HPV-infected high-grade squamous intraepithelial lesions |
| N_HPV: HPV-infected normal cervix |
| Colorectum (GSE201348) |  | FAP: Familial adenomatous polyposis |
| CRC: Colorectal cancer |
| Colorectum (HTA11) |  | AD: Adenomas |
| SER: Sessile serrated lesions |
| MSI-H: Microsatellite-high colorectal cancer |
| MSS: Microsatellite stable colorectal cancer |
| Endometrium |  | AEH: Atypical endometrial hyperplasia |
| EEC: Endometrioid Cancer |
| Esophagus |  | ESCC: Esophageal squamous cell carcinoma |
| HGIN: High-grade intraepithelial neoplasias |
| LGIN: Low-grade intraepithelial neoplasias |
| Liver |  | HCC: Hepatocellular carcinoma |
| NAFLD: Non-alcoholic fatty liver disease |
| Lung | 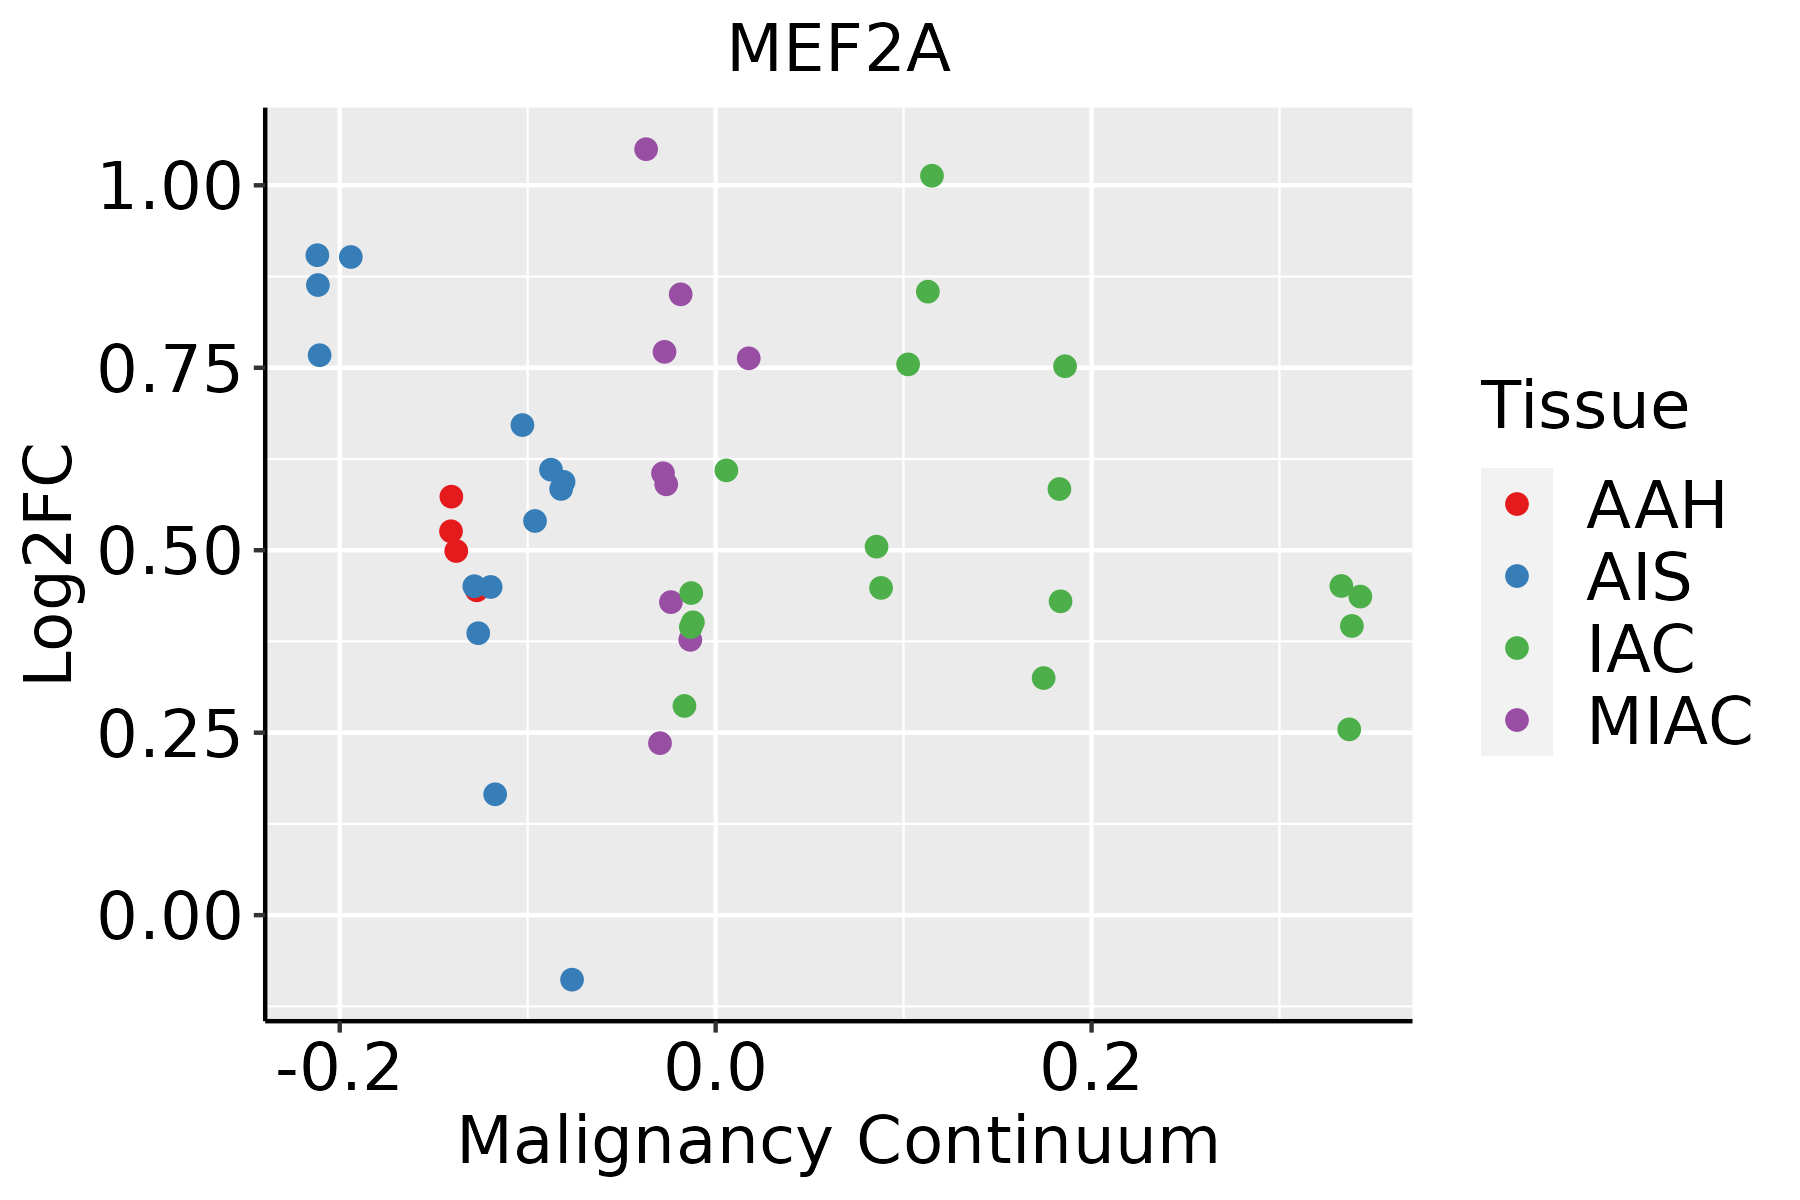 | AAH: Atypical adenomatous hyperplasia |
| AIS: Adenocarcinoma in situ |
| IAC: Invasive lung adenocarcinoma |
| MIA: Minimally invasive adenocarcinoma |
| Oral Cavity | 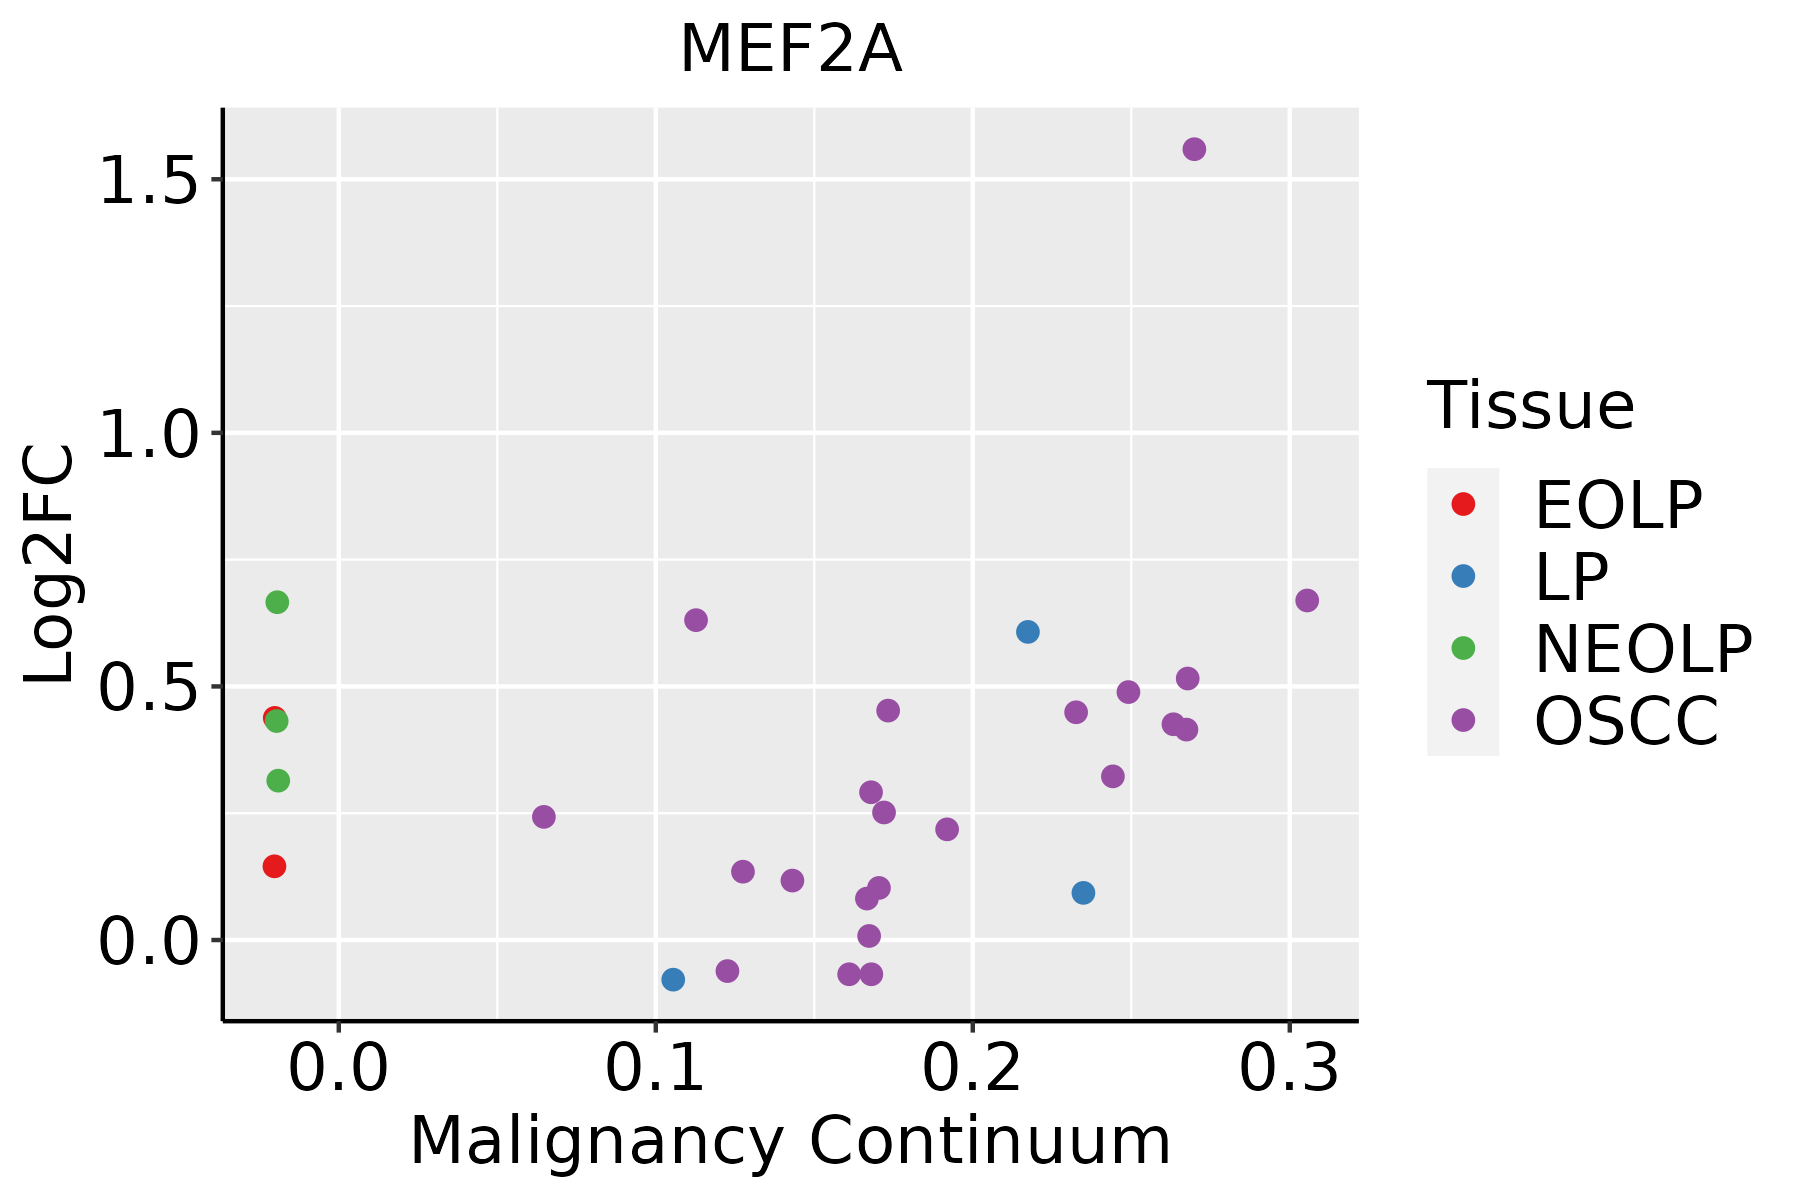 | EOLP: Erosive Oral lichen planus |
| LP: leukoplakia |
| NEOLP: Non-erosive oral lichen planus |
| OSCC: Oral squamous cell carcinoma |
| Prostate |  | BPH: Benign Prostatic Hyperplasia |
| Skin |  | AK: Actinic keratosis |
| cSCC: Cutaneous squamous cell carcinoma |
| SCCIS:squamous cell carcinoma in situ |
| Thyroid | 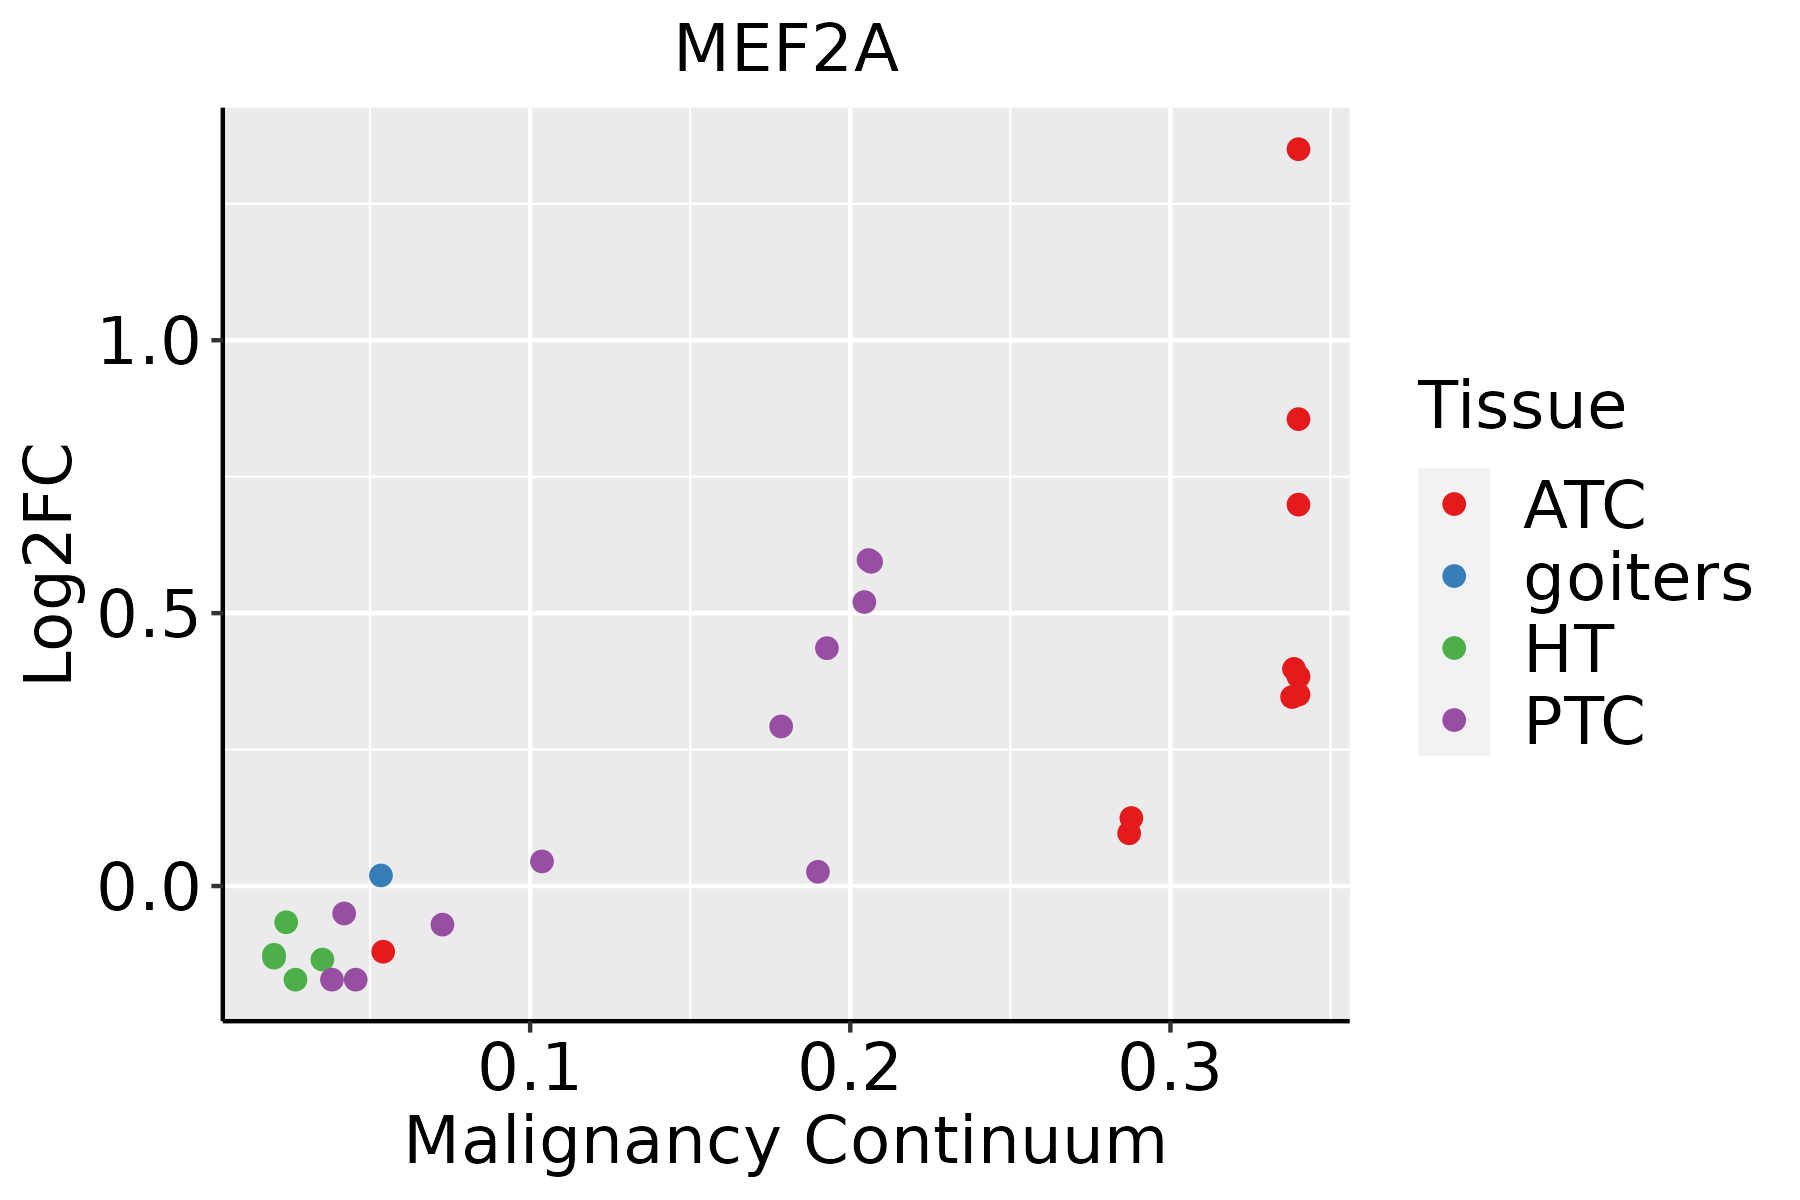 | ATC: Anaplastic thyroid cancer |
| HT: Hashimoto's thyroiditis |
| PTC: Papillary thyroid cancer |
| GO ID | Tissue | Disease Stage | Description | Gene Ratio | Bg Ratio | pvalue | p.adjust | Count |
| GO:00163587 | Cervix | CC | dendrite development | 58/2311 | 243/18723 | 4.52e-07 | 1.76e-05 | 58 |
| GO:00605375 | Cervix | CC | muscle tissue development | 76/2311 | 403/18723 | 9.76e-05 | 1.27e-03 | 76 |
| GO:00310329 | Cervix | CC | actomyosin structure organization | 43/2311 | 196/18723 | 1.11e-04 | 1.40e-03 | 43 |
| GO:00147064 | Cervix | CC | striated muscle tissue development | 72/2311 | 384/18723 | 1.76e-04 | 2.07e-03 | 72 |
| GO:00426924 | Cervix | CC | muscle cell differentiation | 69/2311 | 384/18723 | 8.12e-04 | 7.09e-03 | 69 |
| GO:001003810 | Cervix | CC | response to metal ion | 67/2311 | 373/18723 | 9.67e-04 | 8.10e-03 | 67 |
| GO:00515926 | Cervix | CC | response to calcium ion | 31/2311 | 149/18723 | 2.31e-03 | 1.65e-02 | 31 |
| GO:00075173 | Cervix | CC | muscle organ development | 58/2311 | 327/18723 | 2.73e-03 | 1.85e-02 | 58 |
| GO:00488135 | Cervix | CC | dendrite morphogenesis | 30/2311 | 146/18723 | 3.27e-03 | 2.13e-02 | 30 |
| GO:00148963 | Cervix | CC | muscle hypertrophy | 23/2311 | 104/18723 | 3.63e-03 | 2.32e-02 | 23 |
| GO:00511464 | Cervix | CC | striated muscle cell differentiation | 50/2311 | 283/18723 | 5.53e-03 | 3.19e-02 | 50 |
| GO:00148972 | Cervix | CC | striated muscle hypertrophy | 22/2311 | 102/18723 | 5.99e-03 | 3.42e-02 | 22 |
| GO:00516461 | Cervix | CC | mitochondrion localization | 13/2311 | 50/18723 | 6.42e-03 | 3.58e-02 | 13 |
| GO:00902578 | Cervix | CC | regulation of muscle system process | 45/2311 | 252/18723 | 6.73e-03 | 3.70e-02 | 45 |
| GO:00347645 | Cervix | CC | positive regulation of transmembrane transport | 40/2311 | 219/18723 | 6.97e-03 | 3.76e-02 | 40 |
| GO:00435024 | Cervix | CC | regulation of muscle adaptation | 21/2311 | 98/18723 | 7.71e-03 | 4.09e-02 | 21 |
| GO:00033003 | Cervix | CC | cardiac muscle hypertrophy | 21/2311 | 99/18723 | 8.67e-03 | 4.46e-02 | 21 |
| GO:0031032 | Colorectum | AD | actomyosin structure organization | 65/3918 | 196/18723 | 4.17e-05 | 7.37e-04 | 65 |
| GO:0010038 | Colorectum | AD | response to metal ion | 106/3918 | 373/18723 | 3.22e-04 | 3.83e-03 | 106 |
| GO:0071248 | Colorectum | AD | cellular response to metal ion | 61/3918 | 197/18723 | 5.74e-04 | 6.09e-03 | 61 |
| Pathway ID | Tissue | Disease Stage | Description | Gene Ratio | Bg Ratio | pvalue | p.adjust | qvalue | Count |
| hsa0541820 | Cervix | CC | Fluid shear stress and atherosclerosis | 50/1267 | 139/8465 | 5.71e-10 | 1.32e-08 | 7.81e-09 | 50 |
| hsa0492812 | Cervix | CC | Parathyroid hormone synthesis, secretion and action | 27/1267 | 106/8465 | 3.12e-03 | 1.19e-02 | 7.03e-03 | 27 |
| hsa05418110 | Cervix | CC | Fluid shear stress and atherosclerosis | 50/1267 | 139/8465 | 5.71e-10 | 1.32e-08 | 7.81e-09 | 50 |
| hsa0492813 | Cervix | CC | Parathyroid hormone synthesis, secretion and action | 27/1267 | 106/8465 | 3.12e-03 | 1.19e-02 | 7.03e-03 | 27 |
| hsa05418 | Colorectum | AD | Fluid shear stress and atherosclerosis | 54/2092 | 139/8465 | 1.41e-04 | 1.16e-03 | 7.37e-04 | 54 |
| hsa04928 | Colorectum | AD | Parathyroid hormone synthesis, secretion and action | 38/2092 | 106/8465 | 6.60e-03 | 2.77e-02 | 1.76e-02 | 38 |
| hsa054181 | Colorectum | AD | Fluid shear stress and atherosclerosis | 54/2092 | 139/8465 | 1.41e-04 | 1.16e-03 | 7.37e-04 | 54 |
| hsa049281 | Colorectum | AD | Parathyroid hormone synthesis, secretion and action | 38/2092 | 106/8465 | 6.60e-03 | 2.77e-02 | 1.76e-02 | 38 |
| hsa054182 | Colorectum | SER | Fluid shear stress and atherosclerosis | 40/1580 | 139/8465 | 2.28e-03 | 1.75e-02 | 1.27e-02 | 40 |
| hsa049282 | Colorectum | SER | Parathyroid hormone synthesis, secretion and action | 31/1580 | 106/8465 | 5.20e-03 | 3.28e-02 | 2.38e-02 | 31 |
| hsa054183 | Colorectum | SER | Fluid shear stress and atherosclerosis | 40/1580 | 139/8465 | 2.28e-03 | 1.75e-02 | 1.27e-02 | 40 |
| hsa049283 | Colorectum | SER | Parathyroid hormone synthesis, secretion and action | 31/1580 | 106/8465 | 5.20e-03 | 3.28e-02 | 2.38e-02 | 31 |
| hsa054184 | Colorectum | MSS | Fluid shear stress and atherosclerosis | 51/1875 | 139/8465 | 6.06e-05 | 5.80e-04 | 3.55e-04 | 51 |
| hsa049284 | Colorectum | MSS | Parathyroid hormone synthesis, secretion and action | 37/1875 | 106/8465 | 1.72e-03 | 9.13e-03 | 5.59e-03 | 37 |
| hsa04022 | Colorectum | MSS | cGMP-PKG signaling pathway | 51/1875 | 167/8465 | 6.83e-03 | 2.73e-02 | 1.67e-02 | 51 |
| hsa054185 | Colorectum | MSS | Fluid shear stress and atherosclerosis | 51/1875 | 139/8465 | 6.06e-05 | 5.80e-04 | 3.55e-04 | 51 |
| hsa049285 | Colorectum | MSS | Parathyroid hormone synthesis, secretion and action | 37/1875 | 106/8465 | 1.72e-03 | 9.13e-03 | 5.59e-03 | 37 |
| hsa040221 | Colorectum | MSS | cGMP-PKG signaling pathway | 51/1875 | 167/8465 | 6.83e-03 | 2.73e-02 | 1.67e-02 | 51 |
| hsa054188 | Colorectum | FAP | Fluid shear stress and atherosclerosis | 45/1404 | 139/8465 | 3.05e-06 | 4.63e-05 | 2.81e-05 | 45 |
| hsa040222 | Colorectum | FAP | cGMP-PKG signaling pathway | 42/1404 | 167/8465 | 2.84e-03 | 1.27e-02 | 7.70e-03 | 42 |
| TF | Cell Type | Tissue | Disease Stage | Target Gene | RSS | Regulon Activity |
| MEF2A | LYMEND | Breast | ADJ | SPAG9,MALAT1,ANKRD12, etc. | 6.07e-02 |  |
| MEF2A | PVA | Breast | Healthy | SPAG9,MALAT1,ANKRD12, etc. | 2.41e-01 |  |
| MEF2A | MVA | Breast | Healthy | SPAG9,MALAT1,ANKRD12, etc. | 1.50e-01 | |
| MEF2A | GLAN | Endometrium | Healthy | GNAO1,CLASP2,ABI3BP, etc. | 5.88e-01 |  |
| MEF2A | BMEM | Endometrium | EEC | LASP1,PLXDC2,PALD1, etc. | 1.25e-01 |  |
| MEF2A | MVA | Esophagus | ADJ | PAK1,IGF1R,TM2D3, etc. | 1.90e-01 |  |
| MEF2A | MVA | Esophagus | ESCC | PAK1,IGF1R,TM2D3, etc. | 3.34e-01 |  |
| MEF2A | MVA | Esophagus | Healthy | PAK1,IGF1R,TM2D3, etc. | 3.39e-02 |  |
| MEF2A | LC | Lung | ADJ | PLXDC2,CAMK1D,C20orf194, etc. | 2.02e-01 |  |
| MEF2A | cDC | Lung | ADJ | PLXDC2,CAMK1D,C20orf194, etc. | 3.13e-02 | |
| Hugo Symbol | Variant Class | Variant Classification | dbSNP RS | HGVSc | HGVSp | HGVSp Short | SWISSPROT | BIOTYPE | SIFT | PolyPhen | Tumor Sample Barcode | Tissue | Histology | Sex | Age | Stage | Therapy Types | Drugs | Outcome |
| MEF2A | SNV | Missense_Mutation | | c.316G>C | p.Glu106Gln | p.E106Q | Q02078 | protein_coding | tolerated(0.4) | benign(0.033) | TCGA-AC-A23H-01 | Breast | breast invasive carcinoma | Female | >=65 | I/II | Unknown | Unknown | PD |
| MEF2A | SNV | Missense_Mutation | | c.1052T>C | p.Phe351Ser | p.F351S | Q02078 | protein_coding | deleterious(0.02) | probably_damaging(0.991) | TCGA-AC-A23H-01 | Breast | breast invasive carcinoma | Female | >=65 | I/II | Unknown | Unknown | PD |
| MEF2A | SNV | Missense_Mutation | | c.58A>T | p.Thr20Ser | p.T20S | Q02078 | protein_coding | deleterious(0) | possibly_damaging(0.746) | TCGA-C8-A26Y-01 | Breast | breast invasive carcinoma | Female | >=65 | I/II | Unknown | Unknown | SD |
| MEF2A | SNV | Missense_Mutation | rs553844161 | c.245C>T | p.Ser82Leu | p.S82L | Q02078 | protein_coding | deleterious(0.01) | probably_damaging(0.962) | TCGA-E2-A14W-01 | Breast | breast invasive carcinoma | Male | >=65 | I/II | Chemotherapy | cytoxan | SD |
| MEF2A | SNV | Missense_Mutation | | c.955A>G | p.Ser319Gly | p.S319G | Q02078 | protein_coding | deleterious(0.02) | probably_damaging(0.981) | TCGA-E9-A1N5-01 | Breast | breast invasive carcinoma | Female | <65 | I/II | Chemotherapy | doxorubicin | SD |
| MEF2A | deletion | In_Frame_Del | novel | c.1277_1288delAGCAGCAGCCGC | p.Gln426_Pro429del | p.Q426_P429del | Q02078 | protein_coding | | | TCGA-A2-A3XS-01 | Breast | breast invasive carcinoma | Female | <65 | III/IV | Chemotherapy | cytoxan | PD |
| MEF2A | insertion | In_Frame_Ins | novel | c.981_982insTATGTT | p.Tyr327_Ser328insTyrVal | p.Y327_S328insYV | Q02078 | protein_coding | | | TCGA-AR-A0TY-01 | Breast | breast invasive carcinoma | Female | <65 | I/II | Unspecific | Paclitaxel | PD |
| MEF2A | insertion | Nonsense_Mutation | novel | c.983_984insTTAGCATGGACAAAGGTTAAG | p.Ser328_Ala329insTer | p.S328_A329ins* | Q02078 | protein_coding | | | TCGA-AR-A0TY-01 | Breast | breast invasive carcinoma | Female | <65 | I/II | Unspecific | Paclitaxel | PD |
| MEF2A | deletion | Frame_Shift_Del | | c.705delN | p.Leu236Ter | p.L236* | Q02078 | protein_coding | | | TCGA-D8-A27V-01 | Breast | breast invasive carcinoma | Female | <65 | I/II | Hormone Therapy | tamoxiphen | SD |
| MEF2A | SNV | Missense_Mutation | | c.698C>T | p.Ser233Phe | p.S233F | Q02078 | protein_coding | deleterious(0) | probably_damaging(0.996) | TCGA-IR-A3LH-01 | Cervix | cervical & endocervical cancer | Female | <65 | I/II | Chemotherapy | cisplatin | CR |


