
|
|||||
|
 | |
| |
| |
| |
| |
| |
|
Gene: MED7 |
Gene summary for MED7 |
| Gene information | Species | Human | Gene symbol | MED7 | Gene ID | 9443 |
| Gene name | mediator complex subunit 7 | |
| Gene Alias | ARC34 | |
| Cytomap | 5q33.3 | |
| Gene Type | protein-coding | GO ID | GO:0006139 | UniProtAcc | O43513 |
Top |
Malignant transformation analysis |
| Identification of the aberrant gene expression in precancerous and cancerous lesions by comparing the gene expression of stem-like cells in diseased tissues with normal stem cells |
| Entrez ID | Symbol | Replicates | Species | Organ | Tissue | Adj P-value | Log2FC | Malignancy |
| 9443 | MED7 | male-WTA | Human | Thyroid | PTC | 1.30e-06 | 1.24e-02 | 0.1037 |
| 9443 | MED7 | PTC01 | Human | Thyroid | PTC | 1.37e-10 | 6.99e-02 | 0.1899 |
| 9443 | MED7 | PTC04 | Human | Thyroid | PTC | 1.58e-12 | 7.82e-02 | 0.1927 |
| 9443 | MED7 | PTC05 | Human | Thyroid | PTC | 1.78e-04 | 2.78e-01 | 0.2065 |
| 9443 | MED7 | PTC06 | Human | Thyroid | PTC | 1.94e-19 | 3.59e-01 | 0.2057 |
| 9443 | MED7 | PTC07 | Human | Thyroid | PTC | 8.00e-26 | 3.03e-01 | 0.2044 |
| 9443 | MED7 | ATC12 | Human | Thyroid | ATC | 1.42e-09 | 2.87e-02 | 0.34 |
| 9443 | MED7 | ATC13 | Human | Thyroid | ATC | 1.03e-17 | 4.93e-02 | 0.34 |
| 9443 | MED7 | ATC2 | Human | Thyroid | ATC | 2.23e-10 | 7.39e-01 | 0.34 |
| 9443 | MED7 | ATC4 | Human | Thyroid | ATC | 3.25e-07 | 8.60e-02 | 0.34 |
| 9443 | MED7 | ATC5 | Human | Thyroid | ATC | 1.02e-06 | 6.06e-02 | 0.34 |
| Page: 1 |
| Tissue | Expression Dynamics | Abbreviation |
| Thyroid | 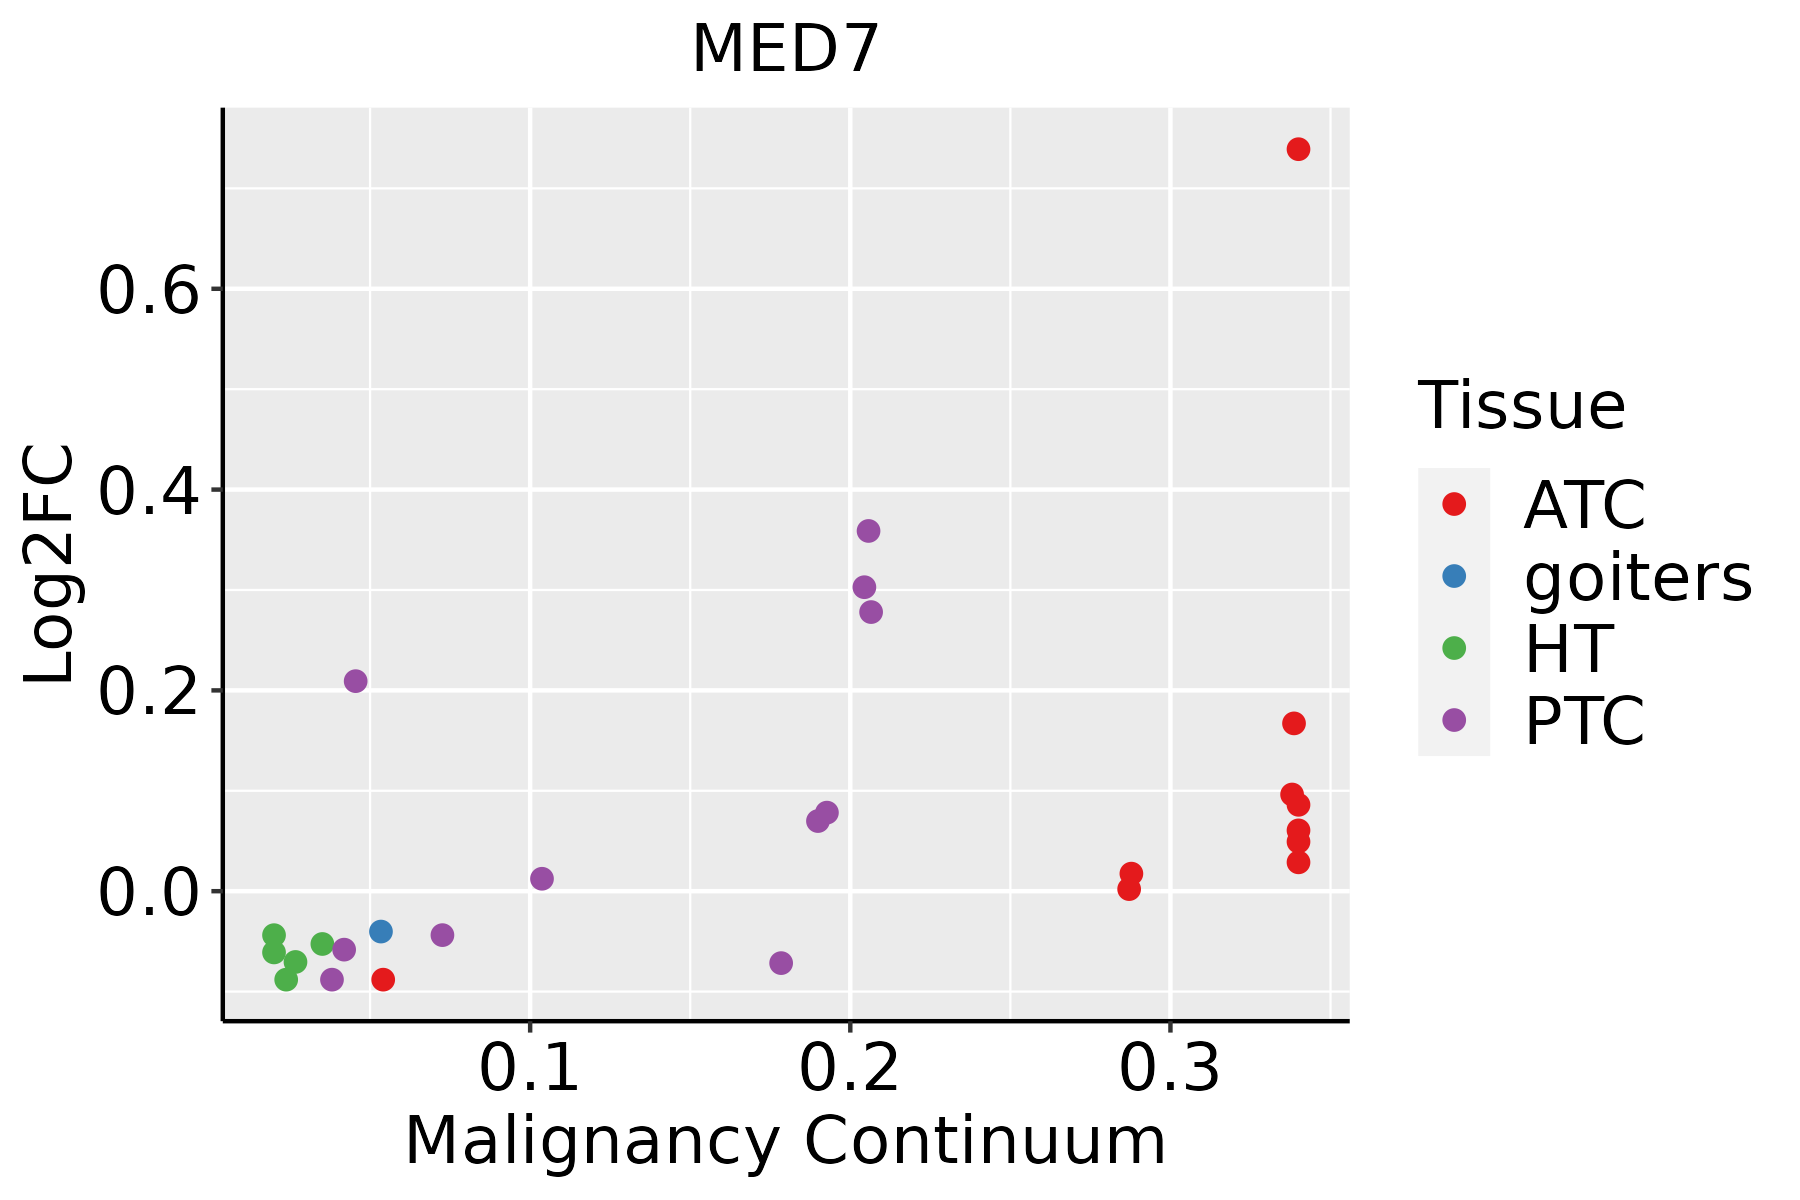 | ATC: Anaplastic thyroid cancer |
| HT: Hashimoto's thyroiditis | ||
| PTC: Papillary thyroid cancer |
| ∗log2FC in expression of this searched gene in stem-like cells from each diseased tissue sample relative to stem-like cells in normal samples in each tissue plotted against the malignancy continuum. Samples are colored based on if they are from different disease stage. |
Top |
Malignant transformation related pathway analysis |
| Find out the enriched GO biological processes and KEGG pathways involved in transition from healthy to precancer to cancer |
| Tissue | Disease Stage | Enriched GO biological Processes |
| Colorectum | AD |  |
| Colorectum | SER |  |
| Colorectum | MSS |  |
| Colorectum | MSI-H |  |
| Colorectum | FAP |  |
| ∗Top 15 enriched GO BP terms are showed in the bar plot of each disease state in each tissue. Each row represents a significant GO biological process which is colored according to the -log10(p.adjust). |
| Page: 1 2 3 4 5 6 7 8 9 |
| GO ID | Tissue | Disease Stage | Description | Gene Ratio | Bg Ratio | pvalue | p.adjust | Count |
| GO:004819318 | Esophagus | ESCC | Golgi vesicle transport | 231/8552 | 296/18723 | 1.82e-30 | 9.63e-28 | 231 |
| GO:000688815 | Esophagus | ESCC | endoplasmic reticulum to Golgi vesicle-mediated transport | 102/8552 | 130/18723 | 1.73e-14 | 9.22e-13 | 102 |
| GO:00070308 | Esophagus | ESCC | Golgi organization | 101/8552 | 157/18723 | 1.78e-06 | 2.10e-05 | 101 |
| GO:004819311 | Liver | Cirrhotic | Golgi vesicle transport | 153/4634 | 296/18723 | 1.02e-23 | 6.43e-21 | 153 |
| GO:000688811 | Liver | Cirrhotic | endoplasmic reticulum to Golgi vesicle-mediated transport | 77/4634 | 130/18723 | 5.78e-17 | 7.56e-15 | 77 |
| GO:00070301 | Liver | Cirrhotic | Golgi organization | 68/4634 | 157/18723 | 2.57e-07 | 6.41e-06 | 68 |
| GO:004819321 | Liver | HCC | Golgi vesicle transport | 217/7958 | 296/18723 | 2.58e-27 | 1.02e-24 | 217 |
| GO:000688821 | Liver | HCC | endoplasmic reticulum to Golgi vesicle-mediated transport | 100/7958 | 130/18723 | 1.15e-15 | 8.67e-14 | 100 |
| GO:00070302 | Liver | HCC | Golgi organization | 99/7958 | 157/18723 | 1.54e-07 | 2.85e-06 | 99 |
| GO:004819315 | Oral cavity | OSCC | Golgi vesicle transport | 209/7305 | 296/18723 | 1.39e-28 | 6.30e-26 | 209 |
| GO:00068888 | Oral cavity | OSCC | endoplasmic reticulum to Golgi vesicle-mediated transport | 97/7305 | 130/18723 | 1.42e-16 | 1.15e-14 | 97 |
| GO:00070307 | Oral cavity | OSCC | Golgi organization | 92/7305 | 157/18723 | 4.96e-07 | 7.27e-06 | 92 |
| GO:004819316 | Oral cavity | LP | Golgi vesicle transport | 141/4623 | 296/18723 | 6.11e-18 | 1.06e-15 | 141 |
| GO:000688814 | Oral cavity | LP | endoplasmic reticulum to Golgi vesicle-mediated transport | 67/4623 | 130/18723 | 3.74e-11 | 2.39e-09 | 67 |
| GO:0048193110 | Skin | cSCC | Golgi vesicle transport | 153/4864 | 296/18723 | 1.85e-21 | 3.41e-19 | 153 |
| GO:000688810 | Skin | cSCC | endoplasmic reticulum to Golgi vesicle-mediated transport | 73/4864 | 130/18723 | 2.60e-13 | 1.57e-11 | 73 |
| GO:00070309 | Skin | cSCC | Golgi organization | 64/4864 | 157/18723 | 3.53e-05 | 3.83e-04 | 64 |
| GO:000688816 | Thyroid | HT | endoplasmic reticulum to Golgi vesicle-mediated transport | 17/1272 | 130/18723 | 6.97e-03 | 4.22e-02 | 17 |
| GO:004819320 | Thyroid | PTC | Golgi vesicle transport | 186/5968 | 296/18723 | 3.09e-28 | 1.22e-25 | 186 |
| GO:000688817 | Thyroid | PTC | endoplasmic reticulum to Golgi vesicle-mediated transport | 83/5968 | 130/18723 | 6.19e-14 | 3.52e-12 | 83 |
| Page: 1 2 |
| Pathway ID | Tissue | Disease Stage | Description | Gene Ratio | Bg Ratio | pvalue | p.adjust | qvalue | Count |
| Page: 1 |
Top |
Cell-cell communication analysis |
| Identification of potential cell-cell interactions between two cell types and their ligand-receptor pairs for different disease states |
| Ligand | Receptor | LRpair | Pathway | Tissue | Disease Stage |
| Page: 1 |
Top |
Single-cell gene regulatory network inference analysis |
| Find out the significant the regulons (TFs) and the target genes of each regulon across cell types for different disease states |
| TF | Cell Type | Tissue | Disease Stage | Target Gene | RSS | Regulon Activity |
| ∗The dot plots of a searched regulon are shown for all cell subpopulations in each disease state of each tissue based on the regulon specific score inferred using pySCENIC and by calculating the average expression. |
| Page: 1 |
Top |
Somatic mutation of malignant transformation related genes |
| Annotation of somatic variants for genes involved in malignant transformation |
| Hugo Symbol | Variant Class | Variant Classification | dbSNP RS | HGVSc | HGVSp | HGVSp Short | SWISSPROT | BIOTYPE | SIFT | PolyPhen | Tumor Sample Barcode | Tissue | Histology | Sex | Age | Stage | Therapy Types | Drugs | Outcome |
| MED7 | SNV | Missense_Mutation | c.509N>G | p.Ser170Cys | p.S170C | O43513 | protein_coding | deleterious(0.01) | probably_damaging(0.94) | TCGA-AR-A24H-01 | Breast | breast invasive carcinoma | Female | >=65 | I/II | Hormone Therapy | tamoxiphen | SD | |
| MED7 | SNV | Missense_Mutation | c.268T>G | p.Leu90Val | p.L90V | O43513 | protein_coding | deleterious(0.01) | possibly_damaging(0.651) | TCGA-A6-6141-01 | Colorectum | colon adenocarcinoma | Male | <65 | I/II | Chemotherapy | 5-fu | SD | |
| MED7 | SNV | Missense_Mutation | rs372006031 | c.170G>A | p.Arg57His | p.R57H | O43513 | protein_coding | deleterious(0.01) | probably_damaging(0.952) | TCGA-AA-3663-01 | Colorectum | colon adenocarcinoma | Male | <65 | I/II | Unknown | Unknown | SD |
| MED7 | SNV | Missense_Mutation | novel | c.490N>G | p.Ile164Val | p.I164V | O43513 | protein_coding | tolerated(0.3) | benign(0.177) | TCGA-AA-3984-01 | Colorectum | colon adenocarcinoma | Female | <65 | I/II | Unknown | Unknown | SD |
| MED7 | SNV | Missense_Mutation | c.412N>G | p.Met138Val | p.M138V | O43513 | protein_coding | tolerated(0.05) | benign(0.084) | TCGA-AZ-4615-01 | Colorectum | colon adenocarcinoma | Male | >=65 | III/IV | Chemotherapy | xeloda | PD | |
| MED7 | SNV | Missense_Mutation | novel | c.321G>T | p.Glu107Asp | p.E107D | O43513 | protein_coding | tolerated(0.05) | benign(0.344) | TCGA-AG-A002-01 | Colorectum | rectum adenocarcinoma | Male | <65 | I/II | Unknown | Unknown | SD |
| MED7 | SNV | Missense_Mutation | rs372006031 | c.170N>A | p.Arg57His | p.R57H | O43513 | protein_coding | deleterious(0.01) | probably_damaging(0.952) | TCGA-AP-A1DV-01 | Endometrium | uterine corpus endometrioid carcinoma | Female | <65 | I/II | Unknown | Unknown | SD |
| MED7 | SNV | Missense_Mutation | c.382N>T | p.Pro128Ser | p.P128S | O43513 | protein_coding | deleterious(0) | probably_damaging(0.999) | TCGA-AX-A0J1-01 | Endometrium | uterine corpus endometrioid carcinoma | Female | >=65 | I/II | Unknown | Unknown | SD | |
| MED7 | SNV | Missense_Mutation | novel | c.430C>T | p.Arg144Cys | p.R144C | O43513 | protein_coding | tolerated(0.07) | benign(0.005) | TCGA-AX-A2HC-01 | Endometrium | uterine corpus endometrioid carcinoma | Female | <65 | III/IV | Chemotherapy | paclitaxel | PD |
| MED7 | SNV | Missense_Mutation | c.57N>T | p.Lys19Asn | p.K19N | O43513 | protein_coding | tolerated(1) | benign(0.085) | TCGA-B5-A0JY-01 | Endometrium | uterine corpus endometrioid carcinoma | Female | <65 | III/IV | Chemotherapy | doxorubicin | SD |
| Page: 1 2 3 |
Top |
Related drugs of malignant transformation related genes |
| Identification of chemicals and drugs interact with genes involved in malignant transfromation |
| (DGIdb 4.0) |
| Entrez ID | Symbol | Category | Interaction Types | Drug Claim Name | Drug Name | PMIDs |
| Page: 1 |

Copyright 2023-Present -The University of Texas Health Science Center at Houston |