
|
|||||
|
 | |
| |
| |
| |
| |
| |
|
Gene: MED30 |
Gene summary for MED30 |
| Gene information | Species | Human | Gene symbol | MED30 | Gene ID | 90390 |
| Gene name | mediator complex subunit 30 | |
| Gene Alias | MED30S | |
| Cytomap | 8q24.11 | |
| Gene Type | protein-coding | GO ID | GO:0006139 | UniProtAcc | Q96HR3 |
Top |
Malignant transformation analysis |
| Identification of the aberrant gene expression in precancerous and cancerous lesions by comparing the gene expression of stem-like cells in diseased tissues with normal stem cells |
| Entrez ID | Symbol | Replicates | Species | Organ | Tissue | Adj P-value | Log2FC | Malignancy |
| 90390 | MED30 | LZE4T | Human | Esophagus | ESCC | 6.49e-28 | 8.87e-01 | 0.0811 |
| 90390 | MED30 | LZE7T | Human | Esophagus | ESCC | 4.20e-05 | 5.12e-01 | 0.0667 |
| 90390 | MED30 | LZE8T | Human | Esophagus | ESCC | 3.33e-13 | 4.69e-01 | 0.067 |
| 90390 | MED30 | LZE20T | Human | Esophagus | ESCC | 6.93e-11 | 4.83e-01 | 0.0662 |
| 90390 | MED30 | LZE22T | Human | Esophagus | ESCC | 4.25e-02 | 4.78e-01 | 0.068 |
| 90390 | MED30 | LZE24T | Human | Esophagus | ESCC | 1.05e-25 | 7.82e-01 | 0.0596 |
| 90390 | MED30 | LZE21T | Human | Esophagus | ESCC | 4.44e-05 | 4.11e-01 | 0.0655 |
| 90390 | MED30 | LZE6T | Human | Esophagus | ESCC | 4.23e-09 | 3.80e-01 | 0.0845 |
| 90390 | MED30 | P1T-E | Human | Esophagus | ESCC | 7.46e-08 | 4.96e-01 | 0.0875 |
| 90390 | MED30 | P2T-E | Human | Esophagus | ESCC | 5.29e-46 | 8.98e-01 | 0.1177 |
| 90390 | MED30 | P4T-E | Human | Esophagus | ESCC | 3.08e-33 | 9.10e-01 | 0.1323 |
| 90390 | MED30 | P5T-E | Human | Esophagus | ESCC | 1.76e-27 | 7.37e-01 | 0.1327 |
| 90390 | MED30 | P8T-E | Human | Esophagus | ESCC | 2.39e-30 | 7.01e-01 | 0.0889 |
| 90390 | MED30 | P9T-E | Human | Esophagus | ESCC | 6.02e-28 | 8.33e-01 | 0.1131 |
| 90390 | MED30 | P10T-E | Human | Esophagus | ESCC | 5.54e-50 | 8.98e-01 | 0.116 |
| 90390 | MED30 | P11T-E | Human | Esophagus | ESCC | 3.69e-11 | 4.99e-01 | 0.1426 |
| 90390 | MED30 | P12T-E | Human | Esophagus | ESCC | 1.00e-45 | 8.42e-01 | 0.1122 |
| 90390 | MED30 | P15T-E | Human | Esophagus | ESCC | 1.23e-36 | 7.97e-01 | 0.1149 |
| 90390 | MED30 | P16T-E | Human | Esophagus | ESCC | 7.46e-57 | 1.19e+00 | 0.1153 |
| 90390 | MED30 | P17T-E | Human | Esophagus | ESCC | 3.60e-09 | 7.00e-01 | 0.1278 |
| Page: 1 2 3 4 5 6 |
| Tissue | Expression Dynamics | Abbreviation |
| Esophagus |  | ESCC: Esophageal squamous cell carcinoma |
| HGIN: High-grade intraepithelial neoplasias | ||
| LGIN: Low-grade intraepithelial neoplasias | ||
| Liver | 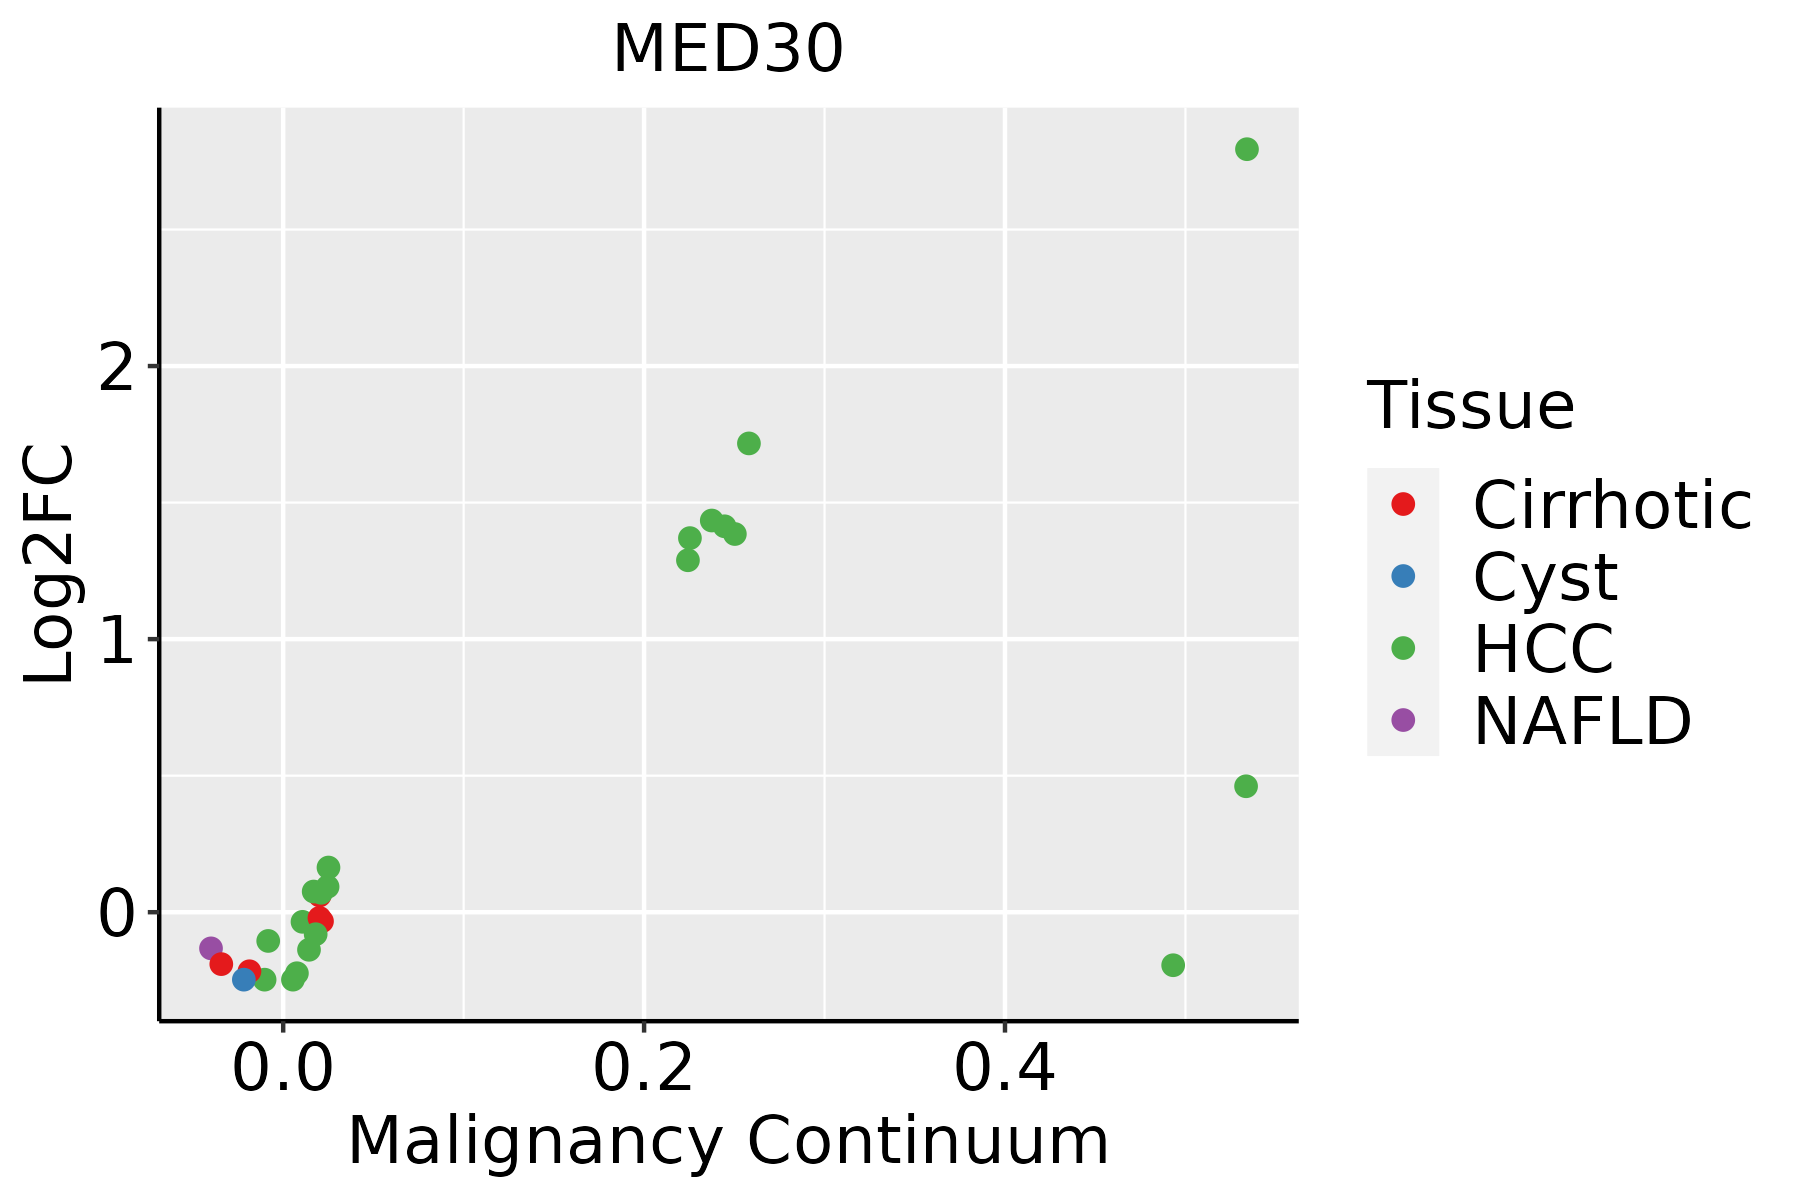 | HCC: Hepatocellular carcinoma |
| NAFLD: Non-alcoholic fatty liver disease | ||
| Oral Cavity |  | EOLP: Erosive Oral lichen planus |
| LP: leukoplakia | ||
| NEOLP: Non-erosive oral lichen planus | ||
| OSCC: Oral squamous cell carcinoma | ||
| Skin | 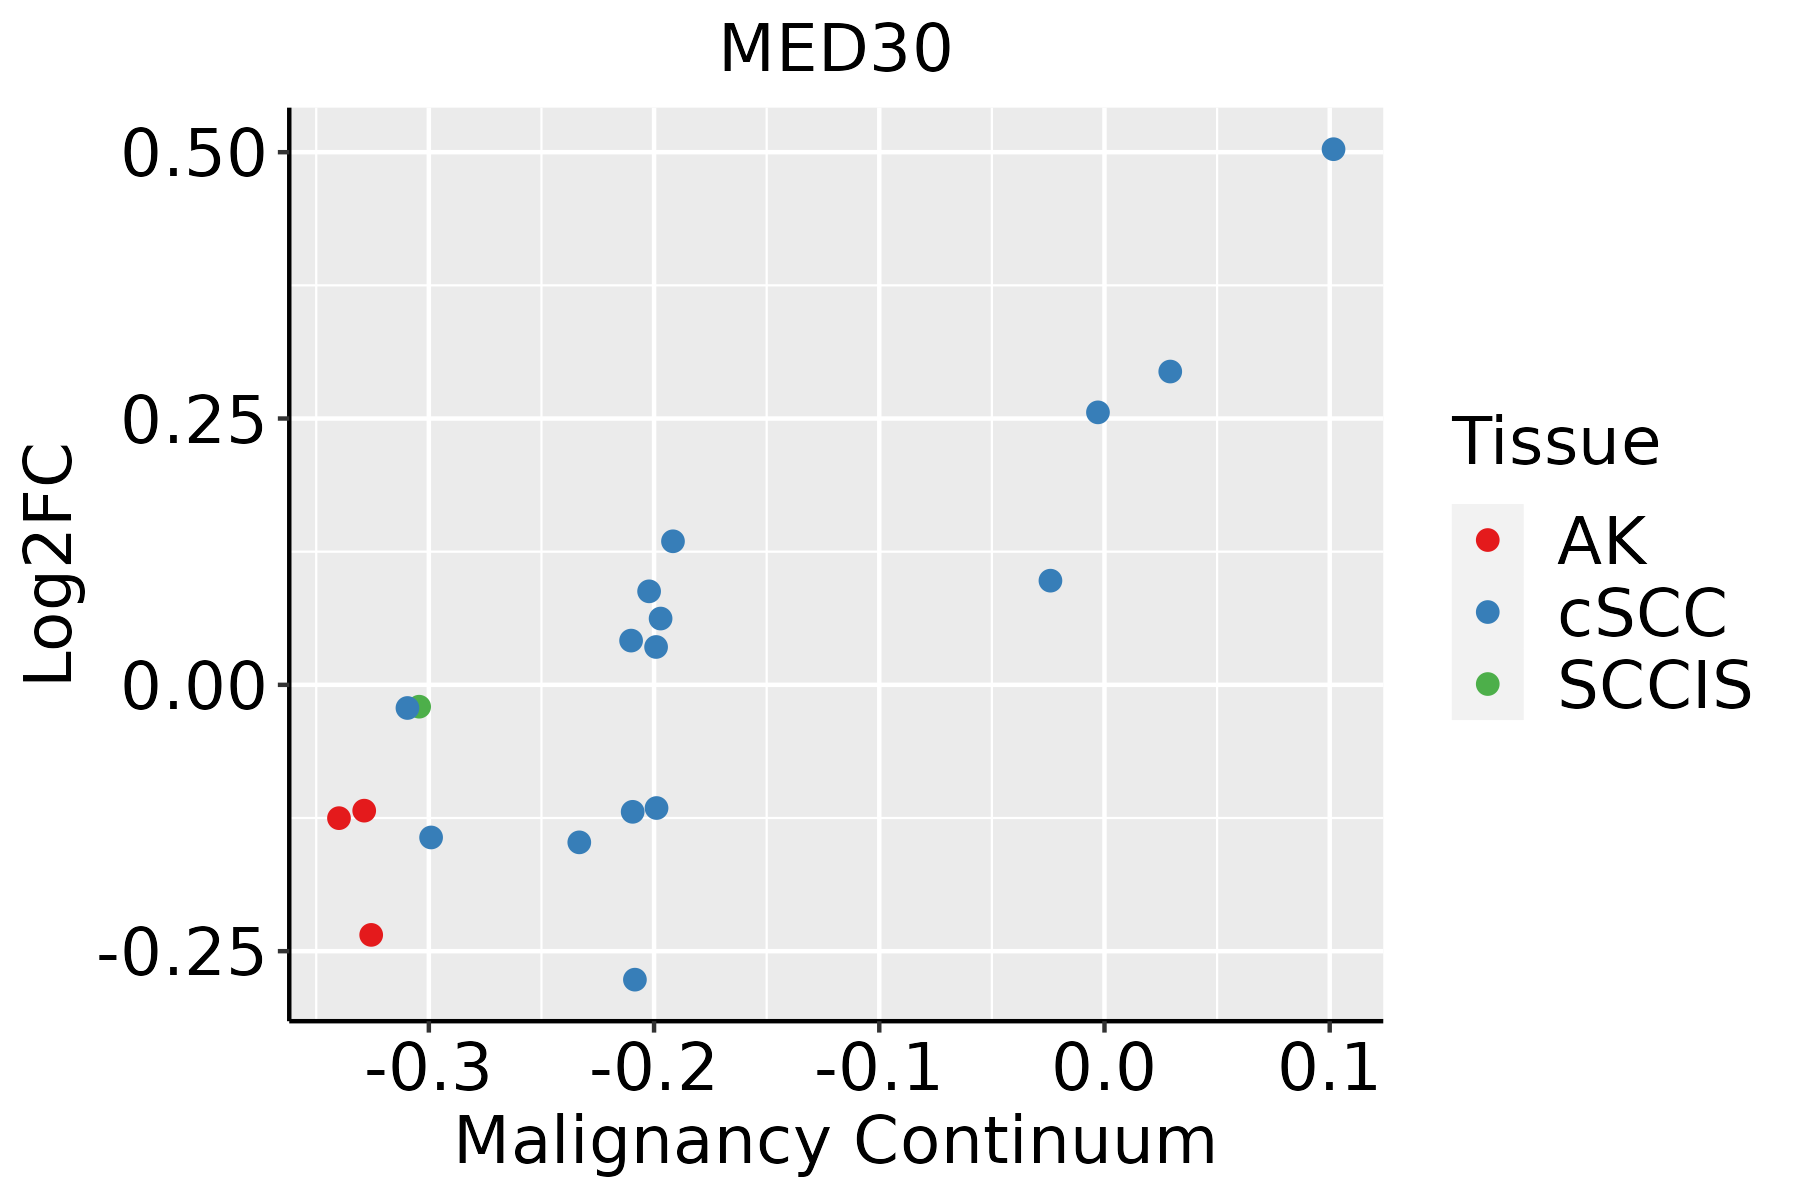 | AK: Actinic keratosis |
| cSCC: Cutaneous squamous cell carcinoma | ||
| SCCIS:squamous cell carcinoma in situ |
| ∗log2FC in expression of this searched gene in stem-like cells from each diseased tissue sample relative to stem-like cells in normal samples in each tissue plotted against the malignancy continuum. Samples are colored based on if they are from different disease stage. |
Top |
Malignant transformation related pathway analysis |
| Find out the enriched GO biological processes and KEGG pathways involved in transition from healthy to precancer to cancer |
| Tissue | Disease Stage | Enriched GO biological Processes |
| Colorectum | AD |  |
| Colorectum | SER |  |
| Colorectum | MSS |  |
| Colorectum | MSI-H |  |
| Colorectum | FAP |  |
| ∗Top 15 enriched GO BP terms are showed in the bar plot of each disease state in each tissue. Each row represents a significant GO biological process which is colored according to the -log10(p.adjust). |
| Page: 1 2 3 4 5 6 7 8 9 |
| GO ID | Tissue | Disease Stage | Description | Gene Ratio | Bg Ratio | pvalue | p.adjust | Count |
| GO:009872714 | Esophagus | ESCC | maintenance of cell number | 90/8552 | 134/18723 | 3.94e-07 | 5.43e-06 | 90 |
| GO:001982714 | Esophagus | ESCC | stem cell population maintenance | 88/8552 | 131/18723 | 5.23e-07 | 6.97e-06 | 88 |
| GO:00063673 | Esophagus | ESCC | transcription initiation from RNA polymerase II promoter | 56/8552 | 77/18723 | 1.30e-06 | 1.59e-05 | 56 |
| GO:000635211 | Esophagus | ESCC | DNA-templated transcription, initiation | 86/8552 | 130/18723 | 1.88e-06 | 2.19e-05 | 86 |
| GO:00602603 | Esophagus | ESCC | regulation of transcription initiation from RNA polymerase II promoter | 25/8552 | 33/18723 | 4.30e-04 | 2.43e-03 | 25 |
| GO:200014212 | Esophagus | ESCC | regulation of DNA-templated transcription, initiation | 29/8552 | 40/18723 | 5.32e-04 | 2.93e-03 | 29 |
| GO:20001443 | Esophagus | ESCC | positive regulation of DNA-templated transcription, initiation | 21/8552 | 31/18723 | 1.10e-02 | 3.70e-02 | 21 |
| GO:001982711 | Liver | Cirrhotic | stem cell population maintenance | 48/4634 | 131/18723 | 1.58e-03 | 1.03e-02 | 48 |
| GO:0006367 | Liver | Cirrhotic | transcription initiation from RNA polymerase II promoter | 31/4634 | 77/18723 | 1.91e-03 | 1.20e-02 | 31 |
| GO:009872711 | Liver | Cirrhotic | maintenance of cell number | 48/4634 | 134/18723 | 2.70e-03 | 1.58e-02 | 48 |
| GO:0060260 | Liver | Cirrhotic | regulation of transcription initiation from RNA polymerase II promoter | 15/4634 | 33/18723 | 7.61e-03 | 3.60e-02 | 15 |
| GO:2000142 | Liver | Cirrhotic | regulation of DNA-templated transcription, initiation | 17/4634 | 40/18723 | 1.04e-02 | 4.61e-02 | 17 |
| GO:00063671 | Liver | HCC | transcription initiation from RNA polymerase II promoter | 52/7958 | 77/18723 | 7.87e-06 | 9.27e-05 | 52 |
| GO:0006352 | Liver | HCC | DNA-templated transcription, initiation | 78/7958 | 130/18723 | 4.19e-05 | 4.11e-04 | 78 |
| GO:00987272 | Liver | HCC | maintenance of cell number | 77/7958 | 134/18723 | 3.32e-04 | 2.33e-03 | 77 |
| GO:20001421 | Liver | HCC | regulation of DNA-templated transcription, initiation | 28/7958 | 40/18723 | 4.01e-04 | 2.71e-03 | 28 |
| GO:00602601 | Liver | HCC | regulation of transcription initiation from RNA polymerase II promoter | 24/7958 | 33/18723 | 4.24e-04 | 2.85e-03 | 24 |
| GO:00198272 | Liver | HCC | stem cell population maintenance | 75/7958 | 131/18723 | 4.58e-04 | 3.04e-03 | 75 |
| GO:2000144 | Liver | HCC | positive regulation of DNA-templated transcription, initiation | 21/7958 | 31/18723 | 4.01e-03 | 1.76e-02 | 21 |
| GO:0060261 | Liver | HCC | positive regulation of transcription initiation from RNA polymerase II promoter | 17/7958 | 25/18723 | 8.94e-03 | 3.45e-02 | 17 |
| Page: 1 2 |
| Pathway ID | Tissue | Disease Stage | Description | Gene Ratio | Bg Ratio | pvalue | p.adjust | qvalue | Count |
| hsa0491928 | Esophagus | ESCC | Thyroid hormone signaling pathway | 78/4205 | 121/8465 | 6.79e-04 | 2.23e-03 | 1.14e-03 | 78 |
| hsa04919113 | Esophagus | ESCC | Thyroid hormone signaling pathway | 78/4205 | 121/8465 | 6.79e-04 | 2.23e-03 | 1.14e-03 | 78 |
| hsa0491912 | Liver | HCC | Thyroid hormone signaling pathway | 75/4020 | 121/8465 | 8.76e-04 | 3.38e-03 | 1.88e-03 | 75 |
| hsa0491913 | Liver | HCC | Thyroid hormone signaling pathway | 75/4020 | 121/8465 | 8.76e-04 | 3.38e-03 | 1.88e-03 | 75 |
| hsa0491926 | Oral cavity | OSCC | Thyroid hormone signaling pathway | 73/3704 | 121/8465 | 1.63e-04 | 5.52e-04 | 2.81e-04 | 73 |
| hsa04919112 | Oral cavity | OSCC | Thyroid hormone signaling pathway | 73/3704 | 121/8465 | 1.63e-04 | 5.52e-04 | 2.81e-04 | 73 |
| Page: 1 |
Top |
Cell-cell communication analysis |
| Identification of potential cell-cell interactions between two cell types and their ligand-receptor pairs for different disease states |
| Ligand | Receptor | LRpair | Pathway | Tissue | Disease Stage |
| Page: 1 |
Top |
Single-cell gene regulatory network inference analysis |
| Find out the significant the regulons (TFs) and the target genes of each regulon across cell types for different disease states |
| TF | Cell Type | Tissue | Disease Stage | Target Gene | RSS | Regulon Activity |
| MED30 | TUF | Colorectum | CRC | ARID3A,SOX4,BICC1, etc. | 4.77e-02 |  |
| ∗The dot plots of a searched regulon are shown for all cell subpopulations in each disease state of each tissue based on the regulon specific score inferred using pySCENIC and by calculating the average expression. |
| Page: 1 |
Top |
Somatic mutation of malignant transformation related genes |
| Annotation of somatic variants for genes involved in malignant transformation |
| Hugo Symbol | Variant Class | Variant Classification | dbSNP RS | HGVSc | HGVSp | HGVSp Short | SWISSPROT | BIOTYPE | SIFT | PolyPhen | Tumor Sample Barcode | Tissue | Histology | Sex | Age | Stage | Therapy Types | Drugs | Outcome |
| MED30 | SNV | Missense_Mutation | novel | c.132N>G | p.Ile44Met | p.I44M | Q96HR3 | protein_coding | deleterious(0) | probably_damaging(0.982) | TCGA-JW-A5VL-01 | Cervix | cervical & endocervical cancer | Female | <65 | I/II | Unknown | Unknown | SD |
| MED30 | SNV | Missense_Mutation | novel | c.270N>T | p.Arg90Ser | p.R90S | Q96HR3 | protein_coding | deleterious(0) | possibly_damaging(0.503) | TCGA-VS-A9UU-01 | Cervix | cervical & endocervical cancer | Female | <65 | I/II | Chemotherapy | cisplatin | CR |
| MED30 | SNV | Missense_Mutation | rs764507160 | c.247C>T | p.Arg83Cys | p.R83C | Q96HR3 | protein_coding | deleterious(0) | probably_damaging(0.981) | TCGA-A6-6141-01 | Colorectum | colon adenocarcinoma | Male | <65 | I/II | Chemotherapy | 5-fu | SD |
| MED30 | SNV | Missense_Mutation | c.104N>A | p.Arg35His | p.R35H | Q96HR3 | protein_coding | deleterious(0) | probably_damaging(0.989) | TCGA-CM-6171-01 | Colorectum | colon adenocarcinoma | Female | >=65 | I/II | Unknown | Unknown | SD | |
| MED30 | SNV | Missense_Mutation | c.302A>T | p.Glu101Val | p.E101V | Q96HR3 | protein_coding | deleterious(0) | probably_damaging(0.939) | TCGA-G4-6304-01 | Colorectum | colon adenocarcinoma | Female | >=65 | I/II | Chemotherapy | fluorouracil | PD | |
| MED30 | SNV | Missense_Mutation | novel | c.367T>A | p.Ser123Thr | p.S123T | Q96HR3 | protein_coding | tolerated(0.72) | benign(0.078) | TCGA-A5-A1OF-01 | Endometrium | uterine corpus endometrioid carcinoma | Female | <65 | I/II | Unknown | Unknown | SD |
| MED30 | SNV | Missense_Mutation | novel | c.453N>C | p.Gln151His | p.Q151H | Q96HR3 | protein_coding | tolerated(0.55) | possibly_damaging(0.477) | TCGA-AJ-A3TW-01 | Endometrium | uterine corpus endometrioid carcinoma | Female | >=65 | I/II | Unknown | Unknown | SD |
| MED30 | SNV | Missense_Mutation | c.252N>T | p.Gln84His | p.Q84H | Q96HR3 | protein_coding | tolerated(0.06) | benign(0.025) | TCGA-BS-A0UJ-01 | Endometrium | uterine corpus endometrioid carcinoma | Female | >=65 | I/II | Unknown | Unknown | SD | |
| MED30 | SNV | Missense_Mutation | c.523N>A | p.Ala175Thr | p.A175T | Q96HR3 | protein_coding | tolerated(1) | possibly_damaging(0.851) | TCGA-D1-A103-01 | Endometrium | uterine corpus endometrioid carcinoma | Female | >=65 | I/II | Unknown | Unknown | SD | |
| MED30 | SNV | Missense_Mutation | novel | c.212N>T | p.Tyr71Phe | p.Y71F | Q96HR3 | protein_coding | tolerated(0.54) | benign(0.239) | TCGA-DD-AAVV-01 | Liver | liver hepatocellular carcinoma | Male | <65 | I/II | Unknown | Unknown | SD |
| Page: 1 2 |
Top |
Related drugs of malignant transformation related genes |
| Identification of chemicals and drugs interact with genes involved in malignant transfromation |
| (DGIdb 4.0) |
| Entrez ID | Symbol | Category | Interaction Types | Drug Claim Name | Drug Name | PMIDs |
| Page: 1 |

Copyright 2023-Present -The University of Texas Health Science Center at Houston |