
|
|||||
|
 | |
| |
| |
| |
| |
| |
|
Gene: MED28 |
Gene summary for MED28 |
| Gene information | Species | Human | Gene symbol | MED28 | Gene ID | 80306 |
| Gene name | mediator complex subunit 28 | |
| Gene Alias | 1500003D12Rik | |
| Cytomap | 4p15.32 | |
| Gene Type | protein-coding | GO ID | GO:0008150 | UniProtAcc | Q9H204 |
Top |
Malignant transformation analysis |
| Identification of the aberrant gene expression in precancerous and cancerous lesions by comparing the gene expression of stem-like cells in diseased tissues with normal stem cells |
| Entrez ID | Symbol | Replicates | Species | Organ | Tissue | Adj P-value | Log2FC | Malignancy |
| 80306 | MED28 | LZE2T | Human | Esophagus | ESCC | 5.15e-04 | 3.58e-01 | 0.082 |
| 80306 | MED28 | LZE4T | Human | Esophagus | ESCC | 7.00e-16 | 1.22e-01 | 0.0811 |
| 80306 | MED28 | LZE7T | Human | Esophagus | ESCC | 1.83e-08 | 4.02e-01 | 0.0667 |
| 80306 | MED28 | LZE8T | Human | Esophagus | ESCC | 3.36e-09 | 4.14e-01 | 0.067 |
| 80306 | MED28 | LZE20T | Human | Esophagus | ESCC | 1.50e-08 | 3.73e-01 | 0.0662 |
| 80306 | MED28 | LZE22T | Human | Esophagus | ESCC | 1.18e-04 | 5.33e-01 | 0.068 |
| 80306 | MED28 | LZE24T | Human | Esophagus | ESCC | 6.82e-24 | 4.85e-01 | 0.0596 |
| 80306 | MED28 | LZE21T | Human | Esophagus | ESCC | 2.13e-02 | 7.27e-02 | 0.0655 |
| 80306 | MED28 | LZE6T | Human | Esophagus | ESCC | 4.48e-09 | 2.87e-01 | 0.0845 |
| 80306 | MED28 | P1T-E | Human | Esophagus | ESCC | 5.35e-08 | 3.95e-01 | 0.0875 |
| 80306 | MED28 | P2T-E | Human | Esophagus | ESCC | 2.48e-48 | 9.64e-01 | 0.1177 |
| 80306 | MED28 | P4T-E | Human | Esophagus | ESCC | 9.91e-46 | 1.06e+00 | 0.1323 |
| 80306 | MED28 | P5T-E | Human | Esophagus | ESCC | 2.88e-19 | 4.56e-01 | 0.1327 |
| 80306 | MED28 | P8T-E | Human | Esophagus | ESCC | 9.50e-24 | 4.07e-01 | 0.0889 |
| 80306 | MED28 | P9T-E | Human | Esophagus | ESCC | 1.83e-18 | 4.56e-01 | 0.1131 |
| 80306 | MED28 | P10T-E | Human | Esophagus | ESCC | 5.08e-27 | 5.36e-01 | 0.116 |
| 80306 | MED28 | P11T-E | Human | Esophagus | ESCC | 2.63e-12 | 6.61e-01 | 0.1426 |
| 80306 | MED28 | P12T-E | Human | Esophagus | ESCC | 4.64e-30 | 6.59e-01 | 0.1122 |
| 80306 | MED28 | P15T-E | Human | Esophagus | ESCC | 6.73e-27 | 4.90e-01 | 0.1149 |
| 80306 | MED28 | P16T-E | Human | Esophagus | ESCC | 2.00e-44 | 8.12e-01 | 0.1153 |
| Page: 1 2 3 4 5 6 7 |
| Tissue | Expression Dynamics | Abbreviation |
| Esophagus | 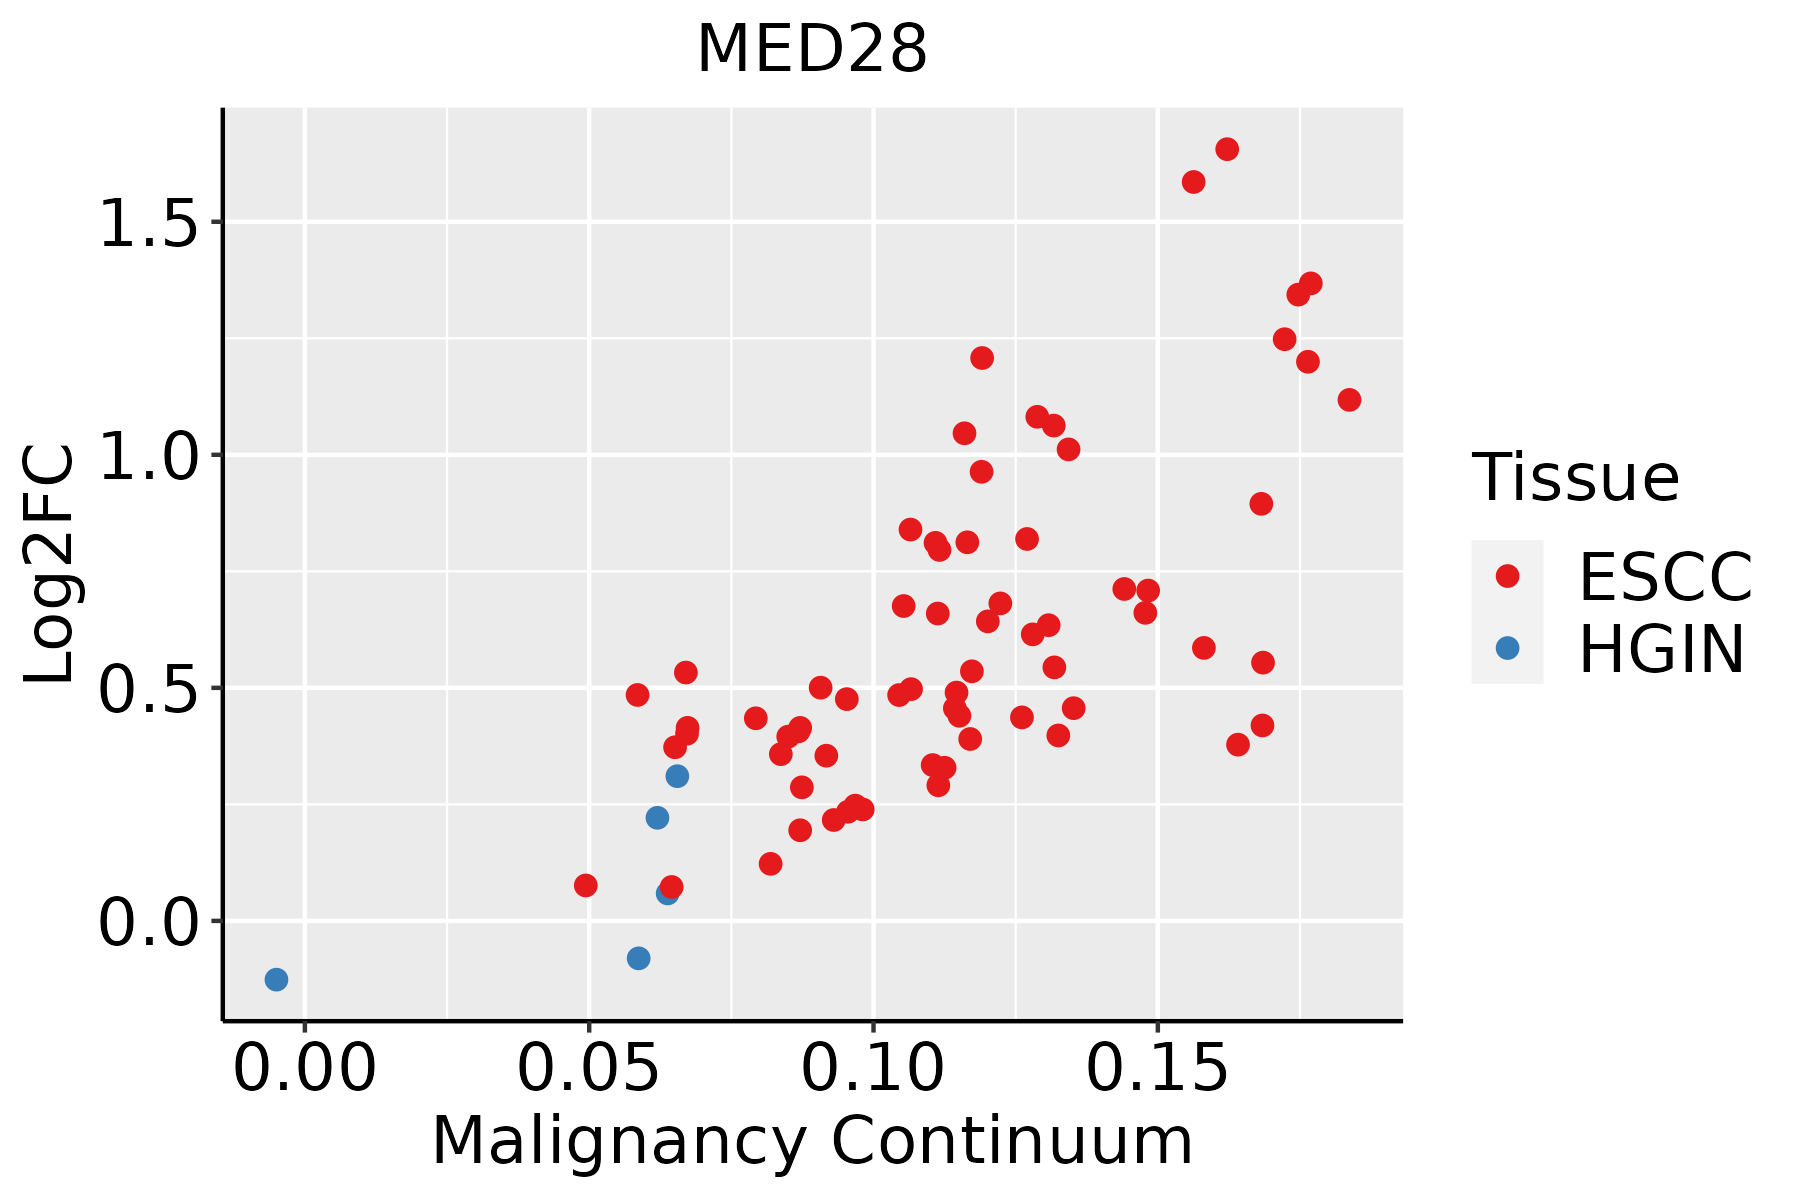 | ESCC: Esophageal squamous cell carcinoma |
| HGIN: High-grade intraepithelial neoplasias | ||
| LGIN: Low-grade intraepithelial neoplasias | ||
| Liver | 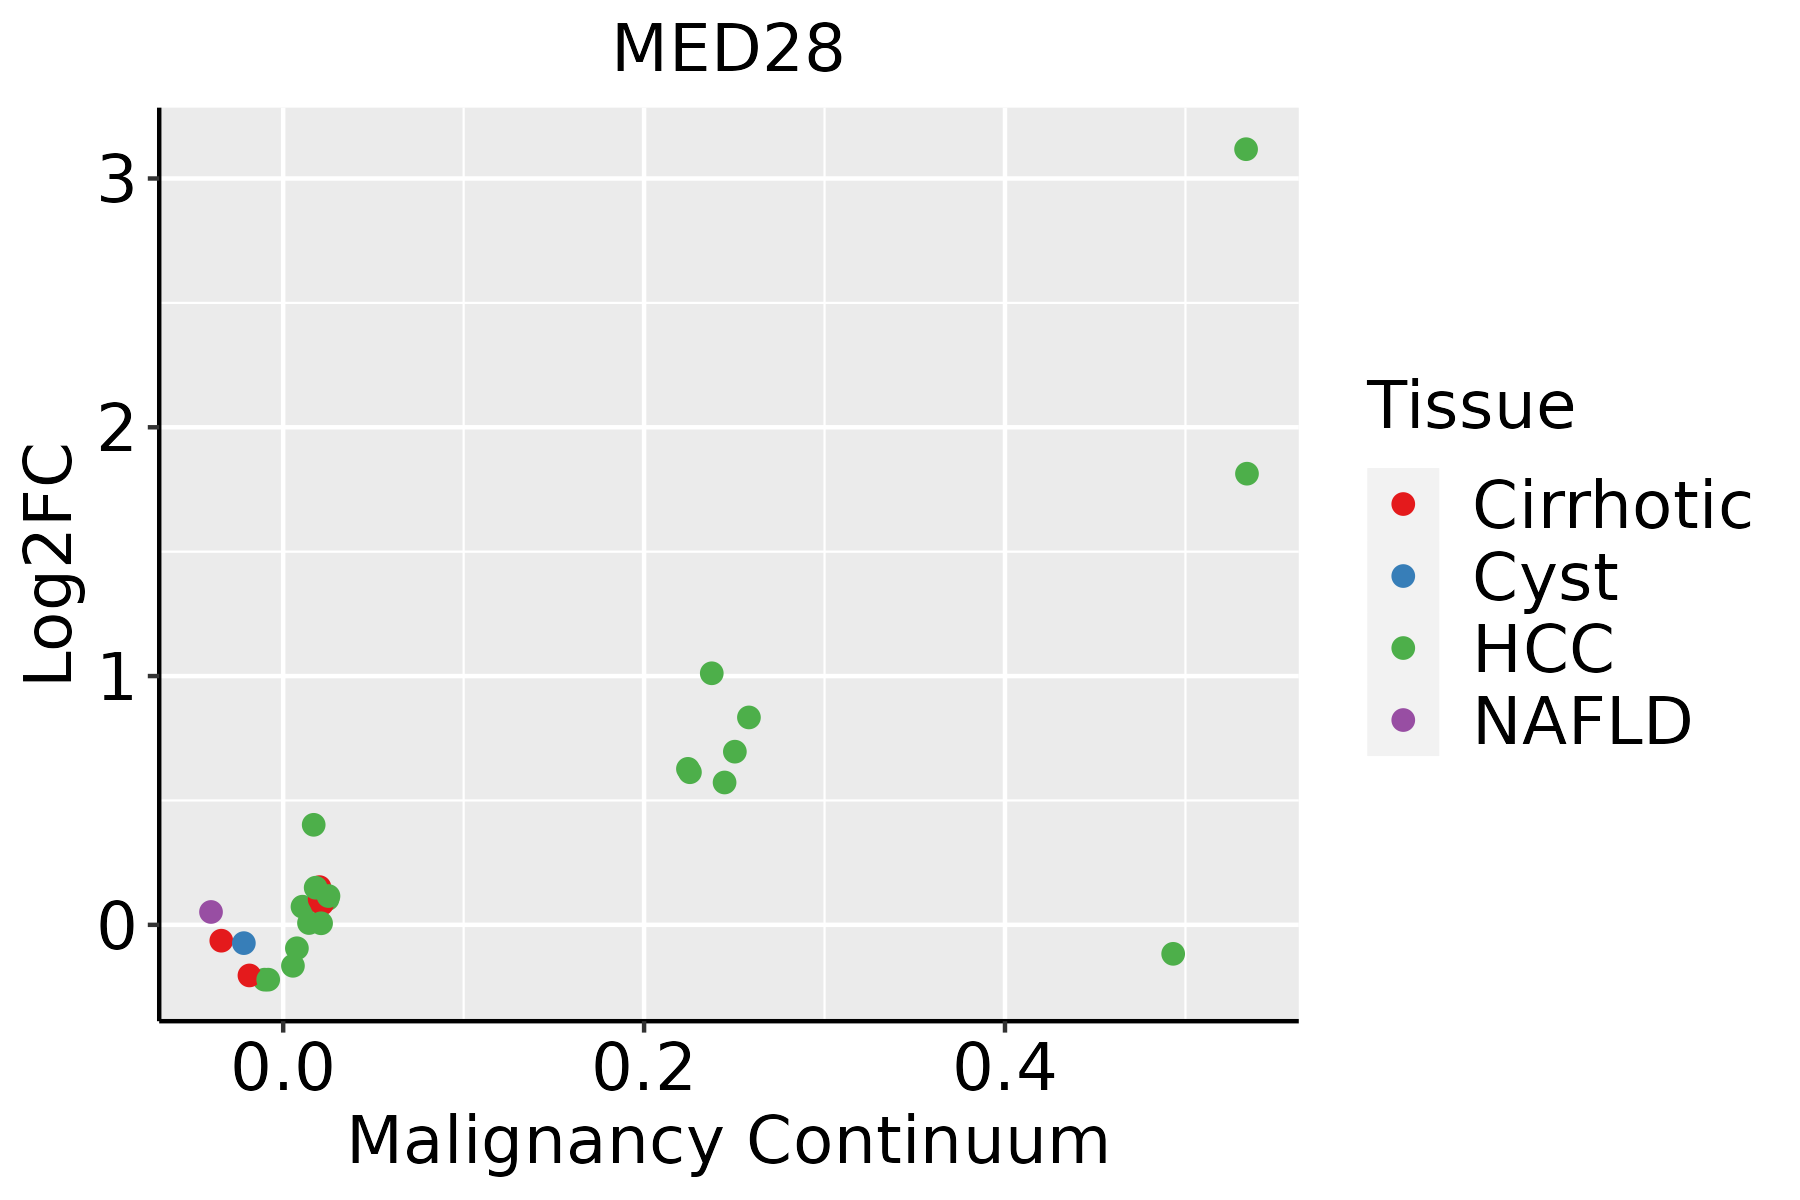 | HCC: Hepatocellular carcinoma |
| NAFLD: Non-alcoholic fatty liver disease | ||
| Oral Cavity |  | EOLP: Erosive Oral lichen planus |
| LP: leukoplakia | ||
| NEOLP: Non-erosive oral lichen planus | ||
| OSCC: Oral squamous cell carcinoma | ||
| Skin | 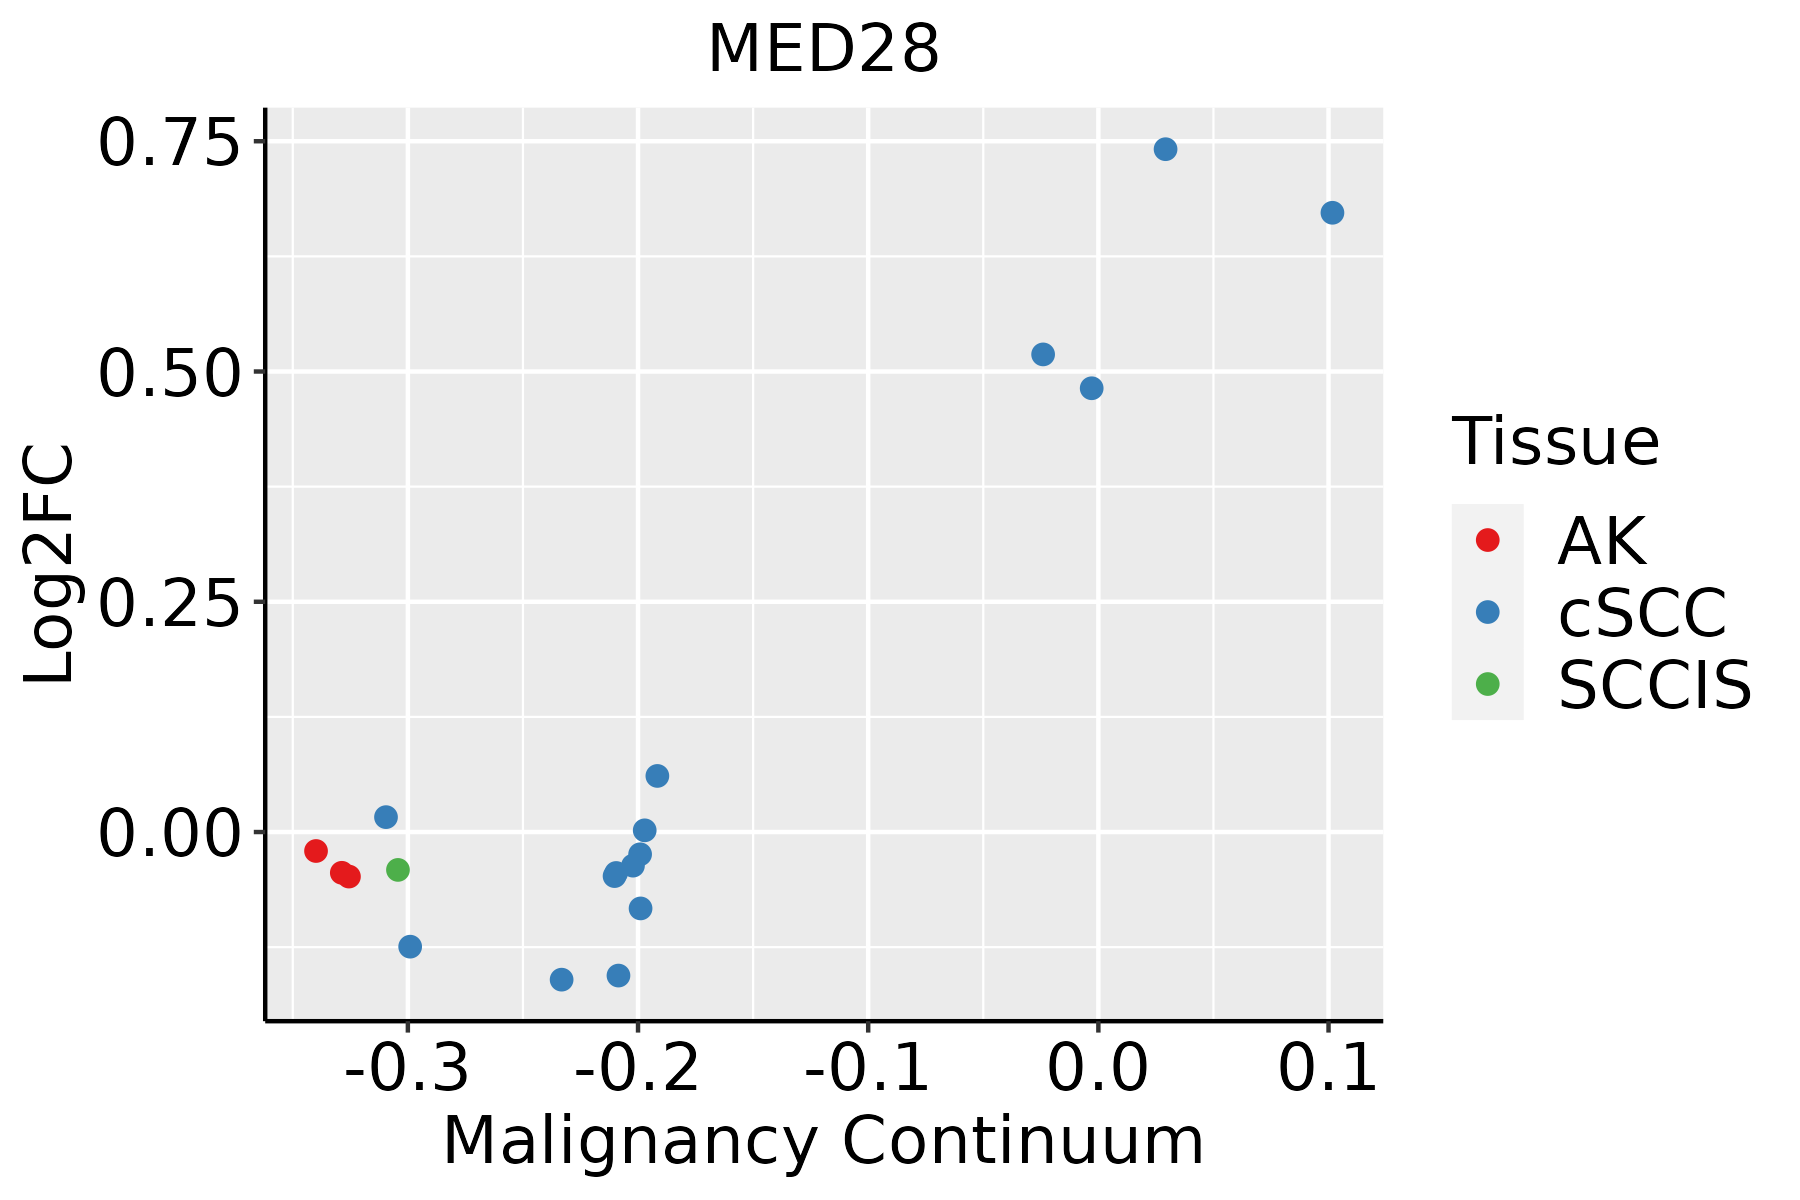 | AK: Actinic keratosis |
| cSCC: Cutaneous squamous cell carcinoma | ||
| SCCIS:squamous cell carcinoma in situ | ||
| Thyroid | 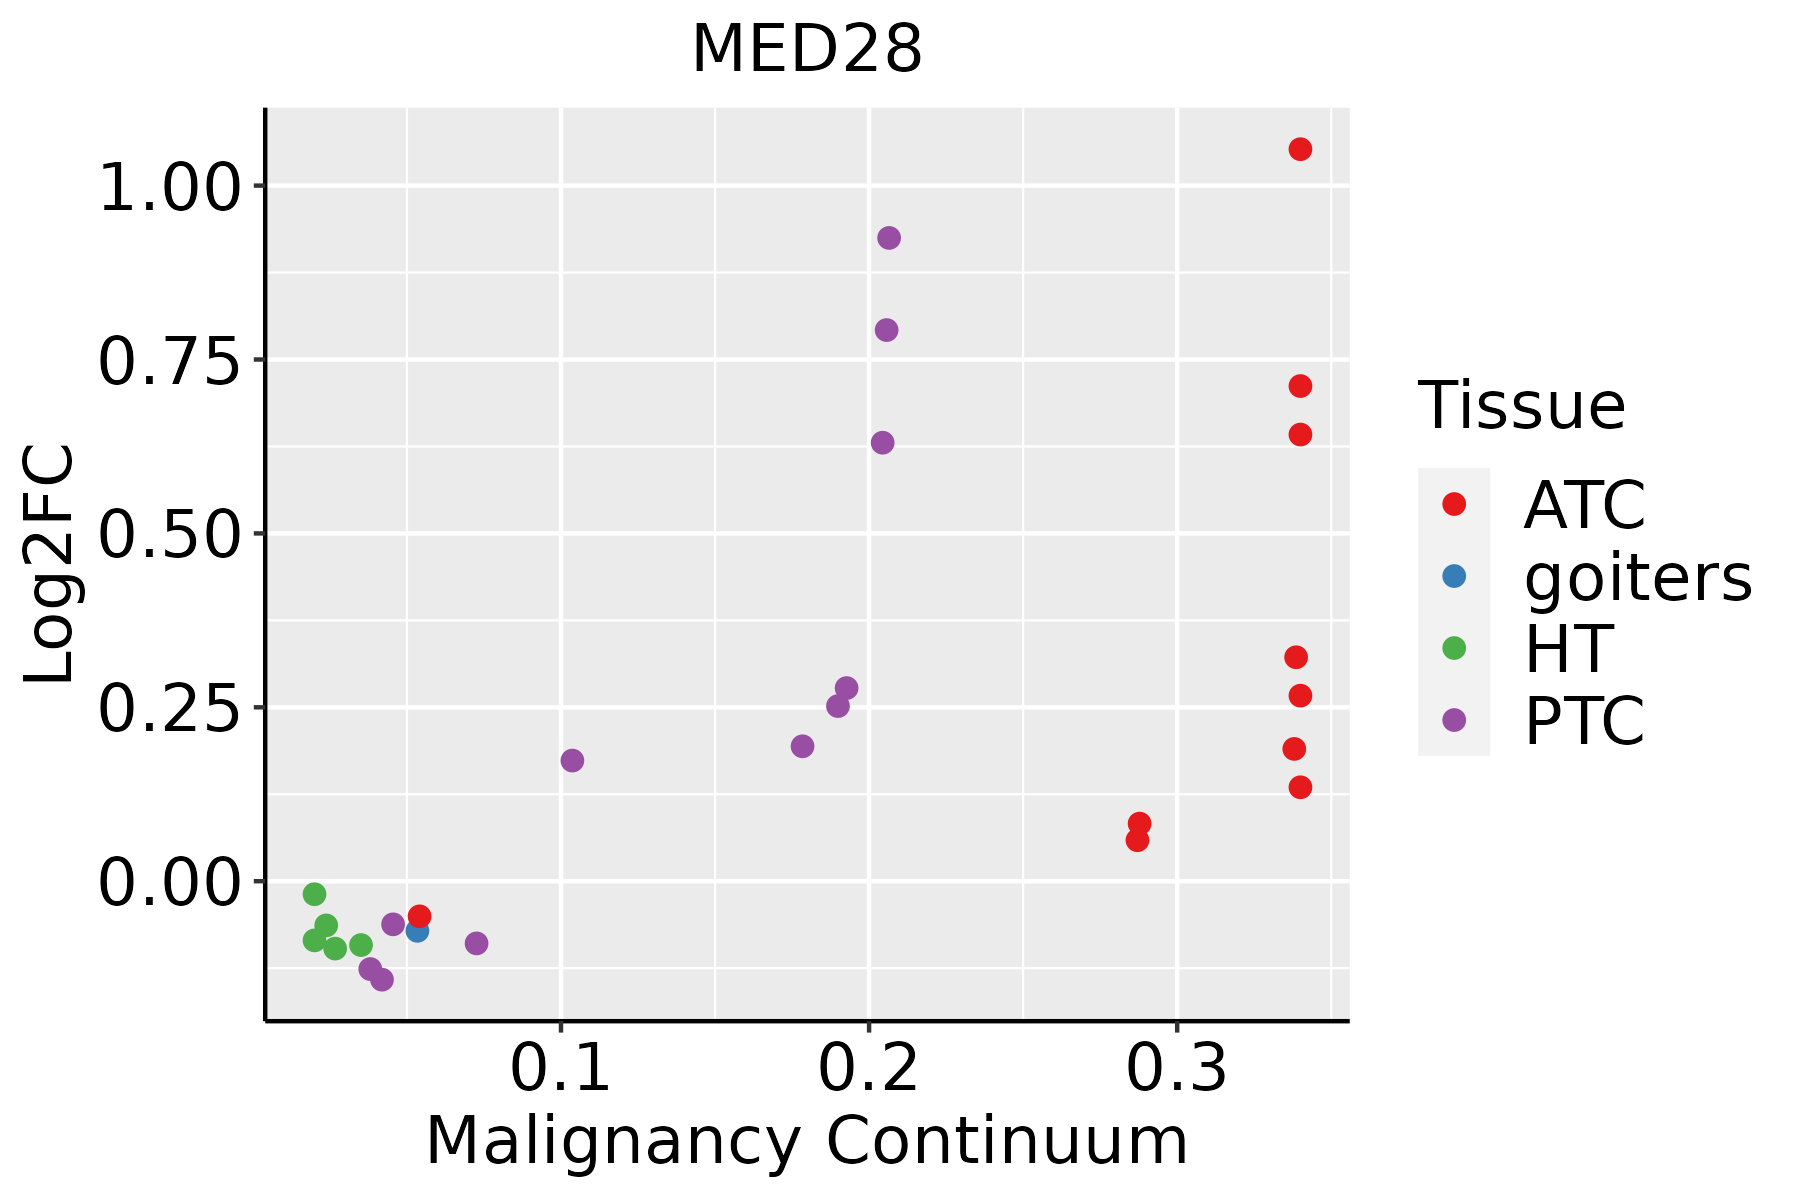 | ATC: Anaplastic thyroid cancer |
| HT: Hashimoto's thyroiditis | ||
| PTC: Papillary thyroid cancer |
| ∗log2FC in expression of this searched gene in stem-like cells from each diseased tissue sample relative to stem-like cells in normal samples in each tissue plotted against the malignancy continuum. Samples are colored based on if they are from different disease stage. |
Top |
Malignant transformation related pathway analysis |
| Find out the enriched GO biological processes and KEGG pathways involved in transition from healthy to precancer to cancer |
| Tissue | Disease Stage | Enriched GO biological Processes |
| Colorectum | AD |  |
| Colorectum | SER |  |
| Colorectum | MSS |  |
| Colorectum | MSI-H |  |
| Colorectum | FAP |  |
| ∗Top 15 enriched GO BP terms are showed in the bar plot of each disease state in each tissue. Each row represents a significant GO biological process which is colored according to the -log10(p.adjust). |
| Page: 1 2 3 4 5 6 7 8 9 |
| GO ID | Tissue | Disease Stage | Description | Gene Ratio | Bg Ratio | pvalue | p.adjust | Count |
| GO:009872714 | Esophagus | ESCC | maintenance of cell number | 90/8552 | 134/18723 | 3.94e-07 | 5.43e-06 | 90 |
| GO:001982714 | Esophagus | ESCC | stem cell population maintenance | 88/8552 | 131/18723 | 5.23e-07 | 6.97e-06 | 88 |
| GO:001982711 | Liver | Cirrhotic | stem cell population maintenance | 48/4634 | 131/18723 | 1.58e-03 | 1.03e-02 | 48 |
| GO:009872711 | Liver | Cirrhotic | maintenance of cell number | 48/4634 | 134/18723 | 2.70e-03 | 1.58e-02 | 48 |
| GO:00987272 | Liver | HCC | maintenance of cell number | 77/7958 | 134/18723 | 3.32e-04 | 2.33e-03 | 77 |
| GO:00198272 | Liver | HCC | stem cell population maintenance | 75/7958 | 131/18723 | 4.58e-04 | 3.04e-03 | 75 |
| GO:00987277 | Oral cavity | OSCC | maintenance of cell number | 81/7305 | 134/18723 | 3.96e-07 | 5.90e-06 | 81 |
| GO:00198276 | Oral cavity | OSCC | stem cell population maintenance | 79/7305 | 131/18723 | 6.28e-07 | 8.96e-06 | 79 |
| GO:00426927 | Oral cavity | OSCC | muscle cell differentiation | 175/7305 | 384/18723 | 4.79e-03 | 1.92e-02 | 175 |
| GO:001982715 | Skin | cSCC | stem cell population maintenance | 58/4864 | 131/18723 | 4.20e-06 | 6.24e-05 | 58 |
| GO:009872715 | Skin | cSCC | maintenance of cell number | 58/4864 | 134/18723 | 9.83e-06 | 1.29e-04 | 58 |
| GO:009872710 | Thyroid | PTC | maintenance of cell number | 63/5968 | 134/18723 | 1.73e-04 | 1.32e-03 | 63 |
| GO:00198279 | Thyroid | PTC | stem cell population maintenance | 61/5968 | 131/18723 | 3.01e-04 | 2.12e-03 | 61 |
| GO:009872722 | Thyroid | ATC | maintenance of cell number | 70/6293 | 134/18723 | 6.45e-06 | 6.69e-05 | 70 |
| GO:001982722 | Thyroid | ATC | stem cell population maintenance | 67/6293 | 131/18723 | 2.48e-05 | 2.16e-04 | 67 |
| GO:004269216 | Thyroid | ATC | muscle cell differentiation | 165/6293 | 384/18723 | 7.17e-05 | 5.46e-04 | 165 |
| Page: 1 |
| Pathway ID | Tissue | Disease Stage | Description | Gene Ratio | Bg Ratio | pvalue | p.adjust | qvalue | Count |
| Page: 1 |
Top |
Cell-cell communication analysis |
| Identification of potential cell-cell interactions between two cell types and their ligand-receptor pairs for different disease states |
| Ligand | Receptor | LRpair | Pathway | Tissue | Disease Stage |
| Page: 1 |
Top |
Single-cell gene regulatory network inference analysis |
| Find out the significant the regulons (TFs) and the target genes of each regulon across cell types for different disease states |
| TF | Cell Type | Tissue | Disease Stage | Target Gene | RSS | Regulon Activity |
| ∗The dot plots of a searched regulon are shown for all cell subpopulations in each disease state of each tissue based on the regulon specific score inferred using pySCENIC and by calculating the average expression. |
| Page: 1 |
Top |
Somatic mutation of malignant transformation related genes |
| Annotation of somatic variants for genes involved in malignant transformation |
| Hugo Symbol | Variant Class | Variant Classification | dbSNP RS | HGVSc | HGVSp | HGVSp Short | SWISSPROT | BIOTYPE | SIFT | PolyPhen | Tumor Sample Barcode | Tissue | Histology | Sex | Age | Stage | Therapy Types | Drugs | Outcome |
| MED28 | insertion | Frame_Shift_Ins | novel | c.437_438insTGGGTGGGGACACAGC | p.Asn147GlyfsTer53 | p.N147Gfs*53 | Q9H204 | protein_coding | TCGA-B6-A0RE-01 | Breast | breast invasive carcinoma | Female | <65 | I/II | Unknown | Unknown | SD | ||
| MED28 | SNV | Missense_Mutation | novel | c.61C>T | p.Pro21Ser | p.P21S | Q9H204 | protein_coding | tolerated_low_confidence(0.15) | benign(0) | TCGA-Q1-A5R2-01 | Cervix | cervical & endocervical cancer | Female | <65 | I/II | Chemotherapy | cisplatin | PR |
| MED28 | SNV | Missense_Mutation | c.95C>A | p.Ala32Glu | p.A32E | Q9H204 | protein_coding | tolerated(0.05) | benign(0.157) | TCGA-DM-A28A-01 | Colorectum | colon adenocarcinoma | Male | >=65 | III/IV | Unknown | Unknown | SD | |
| MED28 | SNV | Missense_Mutation | c.306A>T | p.Leu102Phe | p.L102F | Q9H204 | protein_coding | deleterious(0.01) | probably_damaging(0.998) | TCGA-F4-6461-01 | Colorectum | colon adenocarcinoma | Female | <65 | III/IV | Unknown | Unknown | PD | |
| MED28 | SNV | Missense_Mutation | novel | c.376N>T | p.Asp126Tyr | p.D126Y | Q9H204 | protein_coding | deleterious(0) | possibly_damaging(0.828) | TCGA-AP-A1DV-01 | Endometrium | uterine corpus endometrioid carcinoma | Female | <65 | I/II | Unknown | Unknown | SD |
| MED28 | SNV | Missense_Mutation | novel | c.216A>C | p.Glu72Asp | p.E72D | Q9H204 | protein_coding | deleterious(0.01) | probably_damaging(0.992) | TCGA-B5-A1MR-01 | Endometrium | uterine corpus endometrioid carcinoma | Female | >=65 | III/IV | Unknown | Unknown | SD |
| MED28 | SNV | Missense_Mutation | novel | c.355N>G | p.Arg119Gly | p.R119G | Q9H204 | protein_coding | deleterious(0) | benign(0.422) | TCGA-B5-A1MX-01 | Endometrium | uterine corpus endometrioid carcinoma | Female | <65 | I/II | Hormone Therapy | megace | SD |
| MED28 | SNV | Missense_Mutation | novel | c.343N>A | p.Val115Met | p.V115M | Q9H204 | protein_coding | deleterious(0.02) | possibly_damaging(0.776) | TCGA-B5-A5OC-01 | Endometrium | uterine corpus endometrioid carcinoma | Female | >=65 | III/IV | Chemotherapy | cisplatin | SD |
| MED28 | SNV | Missense_Mutation | c.311T>C | p.Val104Ala | p.V104A | Q9H204 | protein_coding | tolerated(0.53) | benign(0.135) | TCGA-BS-A0UJ-01 | Endometrium | uterine corpus endometrioid carcinoma | Female | >=65 | I/II | Unknown | Unknown | SD | |
| MED28 | SNV | Missense_Mutation | novel | c.293N>C | p.Lys98Thr | p.K98T | Q9H204 | protein_coding | tolerated(0.06) | probably_damaging(0.997) | TCGA-DF-A2KU-01 | Endometrium | uterine corpus endometrioid carcinoma | Female | Unknown | I/II | Unknown | Unknown | SD |
| Page: 1 2 |
Top |
Related drugs of malignant transformation related genes |
| Identification of chemicals and drugs interact with genes involved in malignant transfromation |
| (DGIdb 4.0) |
| Entrez ID | Symbol | Category | Interaction Types | Drug Claim Name | Drug Name | PMIDs |
| Page: 1 |

Copyright 2023-Present -The University of Texas Health Science Center at Houston |